
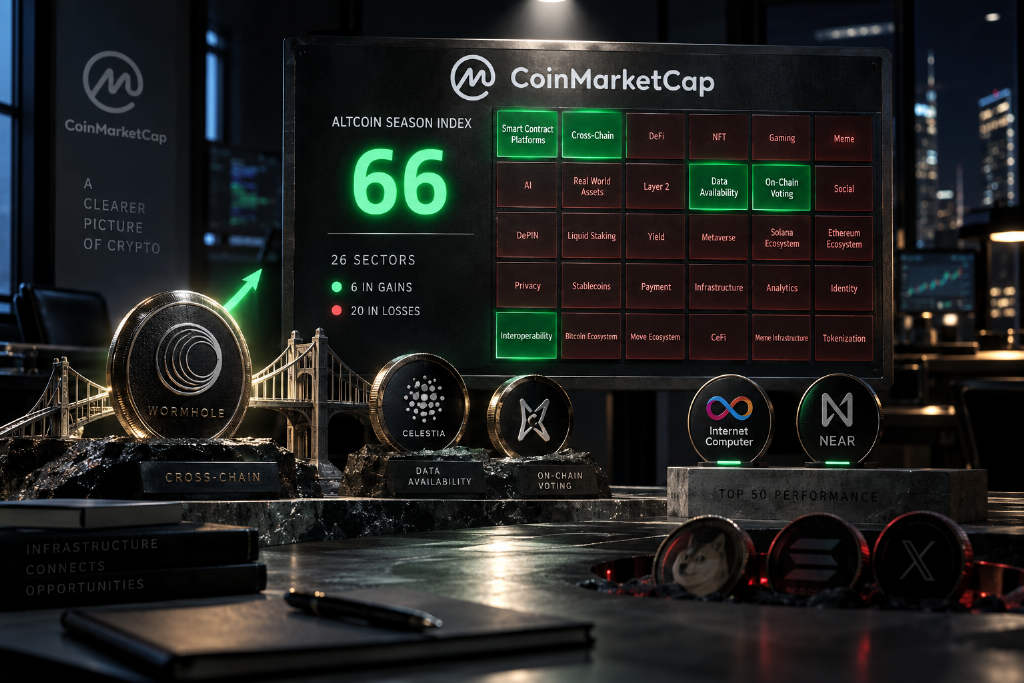
CoinMarketCap data showed the Altcoin Season Index at 66 as of Oct. 12, 2026, 14:08 Beijing time, or 06:08 UTC, the highest level in a year. The measure tracks how many of the top 100 tokens have outperformed Bitcoin over the past 90 days. It does not measure how many sectors are rising right now.

At the same timestamp, Bitcoin traded at $83,815, up 1.02% over 24 hours and down 2.35% over seven days. Total crypto market capitalization stood at $2.84 trillion, down 3.37% on the week. Total market volume reached $55.36 billion, up 26.86% from the previous day. The report said all figures came from CoinMarketCap, with the Fear and Greed Index, Altcoin Season Index, community trending list, narrative rotation tracker and breakout scanner using the platform’s own readings.
Index at a yearly high, breadth at 23.1%
The Altcoin Season Index was 66 on the day, compared with 62 the day before, 63 a week earlier and 39 a month earlier.
Market breadth told a different story. Of 26 valid narrative categories, only 6 posted gains over the past seven days, leaving breadth at 23.1%. In the Sept. 27 edition, 24 categories were up, or 92%. In a little more than two weeks, the number of advancing categories fell to one-quarter of its earlier level. The report labeled the rotation state as concentration in a small group of leaders.
The three best-performing categories moved in the same general direction. On-chain governance gained 56.47% over seven days, cross-chain bridge tokens rose 16.34%, and data availability added 13.02%.
The report treated the top-ranked governance category with caution. Its constituent tokens were not listed in the rotation board, so scale could not be verified. For that reason, the author did not treat it as the week’s main theme. Data availability had the broadest participation among the leaders: Celestia traded at $0.593, up 24.34% over seven days; Filecoin traded at $1.243, up 17.31% over seven days and 13.55% on the day, with volume up 124%; Arweave, in the same category, traded at $4.29 and fell 4.13% over seven days, failing to keep pace.
The three weakest categories were of another kind. Social fell 7.49% over seven days, meme dropped 6.60%, and the Solana ecosystem lost 6.44%. Within meme, DOGE fell 8.61%, SHIB lost 7.07%, and PEPE declined 3.53%. In the Solana bucket, SOL traded at $112.63 and fell 6.66% over seven days, PUMP lost 9.23%, BONK dropped 12.41%, and only JUP rose, up 8.58%.
On-chain data for the Solana category moved in the same direction as prices. Daily DEX volume on Solana was $670 million, 60% below its 30-day baseline. Ethereum posted $705 million, 48% below baseline. Arbitrum came in at $95 million, 28% below baseline. All three chains sat below their reference levels at the same time.
The report’s framing was blunt: what was rising were the infrastructure layers that move assets from one chain to another, while what was falling were the user-facing themes that dominated the summer.
An AI composite category across four tracked sectors added a supporting data point. Across 51 tokens, average price rose 8.5%, market capitalization gained 6.78%, and volume increased 58%, the best showing among the four tracked groups. But large caps did not participate. Bittensor traded at $299 and was almost flat over seven days. Render traded at $2.00 and rose 0.27% over the same period. The move came from smaller and mid-cap names inside the basket.
The report also discarded one printed figure. The rotation board showed an energy category up 453,499% over seven days with a market cap of $57.6 million. Because it fell below the $100 million threshold, it was excluded from the 26 valid categories and omitted from the analysis. At that size, percentage moves of that magnitude were not treated as meaningful.
Only two names in the top 50 cleared the outperformance line
Among the top 50 tokens, the average 24-hour gain was 3.55%, the median was 2.64%, and the standard deviation was 3.42 percentage points. That put the outperformance line at 11.55%, calculated as the mean plus two standard deviations. Only two tokens cleared it. None fell below the laggard line of negative 4.45%.
Internet Computer traded at $3.448, up 13.09% in 24 hours, ranking No. 46. NEAR traded at $5.892, up 12.42%, ranking No. 16. The next names were Zcash, up 9.12%; Pump.fun, up 8.59%; Ondo, up 7.83%; Avalanche, up 7.44%; Canton, up 7.20%; and Ethena, up 7.05%. The weakest name in the top 50 was MemeCore, down 4.07%.
The structure behind the two breakouts was different.

For Internet Computer, the report pointed to identifiable catalysts. The DFINITY team’s application for the ".icp" top-level domain passed ICANN’s initial review and entered the public comment stage. The team also said cloud engines would launch soon and issued vouchers to early developers building agent infrastructure. Third-party coverage mentioned that network fees were near historical lows. Buying showed up in spot, while perpetuals had not yet reached the threshold to count as the main driver. Volume increased 130.2%. Over seven days, the token was up only 4.88%, meaning the day’s move accounted for nearly all of that weekly gain.
NEAR did not have an equivalent fresh headline. Based on the report’s tracking, the move was driven by technical momentum and event visibility rather than new information. NEAR was up 17.19% over seven days and 150% over 30 days, with volume up 61.2%. It was also one of five tokens that appeared on both the hot-search list and the community attention list.
Even so, aligned-window spot order flow for NEAR showed a mild net sell of $26.8 million. The report said the recent leg had been lifted by derivatives. Its final classification still leaned spot-led, but only narrowly.
On durability, several independent high-signal accounts were discussing a monthly breakout above multi-year resistance. The report treated that as a new market narrative rather than recycled language. At the same time, the three-day liquidation heatmap leaned lower: the pool around $5.53 held 288 million points, 6.0% below the current price, while the pool 2.4% above sat at 73 million points.
The report stopped short of assigning direction to that setup. With a token up 150% over 30 days and downside liquidation fuel roughly four times the comparable upside zone, the data could fit short re-entry at higher levels or trailing stops from earlier longs. This edition did not separate the two.
Wormhole jumped 59.07%, and the category was basically just Wormhole
Wormhole traded at $0.0281, up 59.07% over 24 hours, with a market-cap ranking of No. 149, outside the top 50.
The move looked clearer when placed back into its mapped sector. Wormhole was assigned to DeFi. Within that peer group, the 24-hour median move was a gain of 1.09%, while the seven-day median was a decline of 1.22%. W delivered 58 percentage points of excess return on the day and 93 percentage points over seven days. The report classified that as sustained outperformance, not a single-day spike.
Volume rose 333%, equal to 169% of its market capitalization. A one-day turnover above total market cap is the kind of reading usually seen when a small-cap token is traded heavily in concentrated fashion.
The main driver was in perpetuals. Within the observed window, spot order flow was rising while futures order flow was falling. The report said that shape matched a derivatives-led push that was then met by spot profit-taking. On the three-day heatmap, the heaviest zone sat 3.05% below the current price.
The second-strongest narrative category for the week was cross-chain bridge tokens, up 16.34%. But that category had only one component: W, which was up 91.4% over seven days.
For that reason, the report rejected the idea that the week should be described as a rotation into cross-chain infrastructure. If only one token in a category is moving, then it is that token moving, not the whole category. The report said the only category with several components participating together was data availability, and even there the gain was only about 80% of the cross-chain bridge category’s move.
Six details under the surface
Positioning, fund-flow and cross-asset data were current through Oct. 12, 06:08 UTC. The report highlighted six details.
Two sentiment gauges moved in opposite directions
The Fear and Greed Index stood at 58, in neutral territory, down from 67 a week earlier and 68 a month earlier. The yearly high was 82 on Aug. 27. Over the same period, the Altcoin Season Index rose from 63 to 66. The first gauge was driven by Bitcoin’s momentum and volatility. The second counted how many top-100 tokens had outperformed Bitcoin over 90 days. The report said sentiment weakened as Bitcoin failed to hold a move higher and ETF flows turned negative, while a small group of mid-cap tokens kept outperforming on a relative basis.
Bitcoin dominance rose as well
Bitcoin’s market-cap share increased from 59.15% a week earlier to 59.34%. That happened on the same day the Altcoin Season Index hit a one-year high. Both could be true because Ethereum’s share fell from 11.33% to 11.01%. In the report’s reading, the winners in this altcoin phase were NEAR, Internet Computer, Zcash and one cross-chain bridge token, not Ethereum.

The hottest category was down
Layer 1 ranked first in community discussion volume, with 38 independent authors, yet the category fell 2.59% over seven days and rose only 1.67% on the day. Fifth place in discussion went to the digital commodity regulation category, down 2.84% over seven days and made up of several major tokens. Attention was still clustered around mainstream assets. Money was not.
Strategy spent more on preferred buybacks than on Bitcoin purchases
STRC preferred shares traded at $99.66, a 0.34% discount to par, which the report described as a normal range. MSTR fell 3.54% over the past five trading days, while Bitcoin rose 0.64% over the same period. The company’s disclosed purchase for Sept. 28 through Oct. 4 was its smallest of the year, and the amount spent buying back preferred shares was several times larger than what it spent buying Bitcoin. The report said this came from company disclosure rather than CoinMarketCap data.
Bitcoin remained in the upper half of its 30-day range
Bitcoin’s 30-day range ran from $74,945 to $87,364. The current price sat at the 71st percentile, 4.06% below the high, with a 14-day RSI of 54. Compared with the Oct. 1 edition, Bitcoin was up just 0.4%. In other words, price went in a circle over 11 days while the Altcoin Season Index still rose from 63 to 66. The index tracks relative performance, not absolute location.
The stablecoin gap widened again
Stablecoin supply on Ethereum stood at $147.1 billion, down 0.72% over 30 days. USDT accounted for 49.68% and USDC for 30.65%, a gap of 19.03 percentage points. The previous two readings were 18.59 points and 17.97 points. The gap widened for three straight editions while total supply contracted.
What comes next
The first macro event on the schedule was the Sept. U.S. CPI release due on Wednesday, Oct. 14, Beijing time. Market expectations were for 3.7% year-over-year, versus 3.4% the previous month. It was the only macro item listed in this edition and the first major test for the week.
The University of Michigan consumer sentiment reading released on Oct. 9 came in at 46.3, versus expectations of 47.6 and a prior reading of 48.1. In the same survey, one-year inflation expectations were 4.7% and five- to 10-year expectations were 3.5%. The report said those two inflation figures mattered more than the 46.3 sentiment number during a CPI week.
For single-name monitoring, the report flagged the pool below NEAR. The $5.53 zone held 288 million points of liquidation fuel, four times the comparable upside area. For a token up 150% over 30 days, that level could matter if the market starts moving lower.
It also highlighted Wormhole’s trading activity. Daily turnover reached 169% of market capitalization. Whether that can hold for more than one day will decide whether the move is a broader run or a one-day event.
One more thing to watch is breadth itself. Of the six categories now in the green, only data availability shows several components moving together. The report said this phase would look more like a genuine rotation only if a second category starts to do the same.
An index high does not mean a broad rally
The report’s conclusion was direct. The Altcoin Season Index reached a one-year high, while breadth was cut sharply. Both statements were true at once. The two key data points behind that view were the index at 66 versus 39 a month earlier, and only 6 of 26 valid narrative categories up over seven days versus 24 in the Sept. 27 reading.
The market’s rewarded direction had changed as well. The leaders were on-chain governance, cross-chain bridges and data availability, all tied to the infrastructure that moves assets and data. The laggards were social, meme and the Solana ecosystem, all linked to the user-facing themes that had led in summer.
As for why Bitcoin dominance and the Altcoin Season Index could rise together, the report placed the answer on Ethereum: its share of total market cap dropped from 11.33% to 11.01%, and this round of capital bypassed it.
The Altcoin Season Index counts how many tokens have outperformed Bitcoin over the past 90 days. It does not say those tokens are still rising today. On that day’s tape, only two names cleared the outperformance line.
