

An anonymous trader has put on a large Bitcoin options spread on Deribit, buying 20,000 July 31 $70,000 call options and selling 20,000 calls at the $72,000 strike for the same expiry. Based on Bitcoin’s current price, the two legs carry about $2.5 billion in total notional value.
At the time of writing, Bitcoin was trading near $64,289. That leaves the market needing to close a gap of about 8.9% just to reach the lower strike, with the full payoff zone tied to a move into the $70,000-$72,000 range before the contracts expire.
$70,000 and $72,000 lead July 31 call positioning
Deribit’s July 31 options board shows more than 20,000 Bitcoin call contracts clustered at the $70,000 and $72,000 strikes. Those two levels are the largest call concentrations for that expiry. Exchange data showed roughly 27,000 contracts at $70,000 and about 21,000 at $72,000 as of publication.
Deribit Chief Commercial Officer Jean-David Péquignot told CoinDesk that one large transaction involved buying 20,000 July 31 $70,000 calls while selling the same number of $72,000 calls for the same date.
The concentration visible in exchange data separately backs the presence of large positions at both strikes, matching a 20,000-by-20,000 bull call spread.
Using the current Bitcoin price, the two legs amount to around $2.5 billion in total notional terms. Premium paid, capital deployed, and net exposure are different measures and should not be confused with that figure.
A capped-upside structure with a short clock
Under this setup, the long $70,000 call provides upside exposure above the lower strike, while the short $72,000 call lowers the cost of the trade and caps gains beyond that level. The bull call spread reaches its maximum payoff if Bitcoin is at or above the higher strike at expiry.
The structure can express a directional view, hedge another options position, or offset a separate exposure. But neither Deribit’s open interest charts nor the reported block trade identify the broader portfolio of the counterparty, so the clearest read on the position comes from its capped payoff and short maturity.
A July 17 review of options positioning by CryptoSlate found about $4.5 billion in Bitcoin call open interest between $70,000 and $80,000. Open interest tracks the number of contracts that remain open. Direction still depends on how those calls were bought, sold, and combined with the rest of a portfolio. That concentration highlights important price zones, but it does not turn every contract into the same bullish bet.
A separate prediction-market snapshot on July 20 showed a 14.5% probability of Bitcoin touching $70,000 this month and a 4.1% probability of reaching $72,500. The threshold for $67,500 stood at 34.5%, while the probability of touching $62,500 on the downside was 67.4%.
Each threshold is an independent binary event rather than a mutually exclusive one, meaning Bitcoin could hit several of them during a volatile month. Those contracts measure whether a level is touched at any point in July, not where options settle on July 31. For that reason, the probabilities provide wider market context but do not answer the same question as the spread itself.
Fed timing puts the final stretch under a microscope
The Federal Reserve’s official calendar places the next Federal Open Market Committee meeting on July 28 and 29. The policy decision is scheduled for 2 p.m. Eastern Time on July 29, followed by a press conference at 2:30 p.m. The bull call spread expires on July 31.
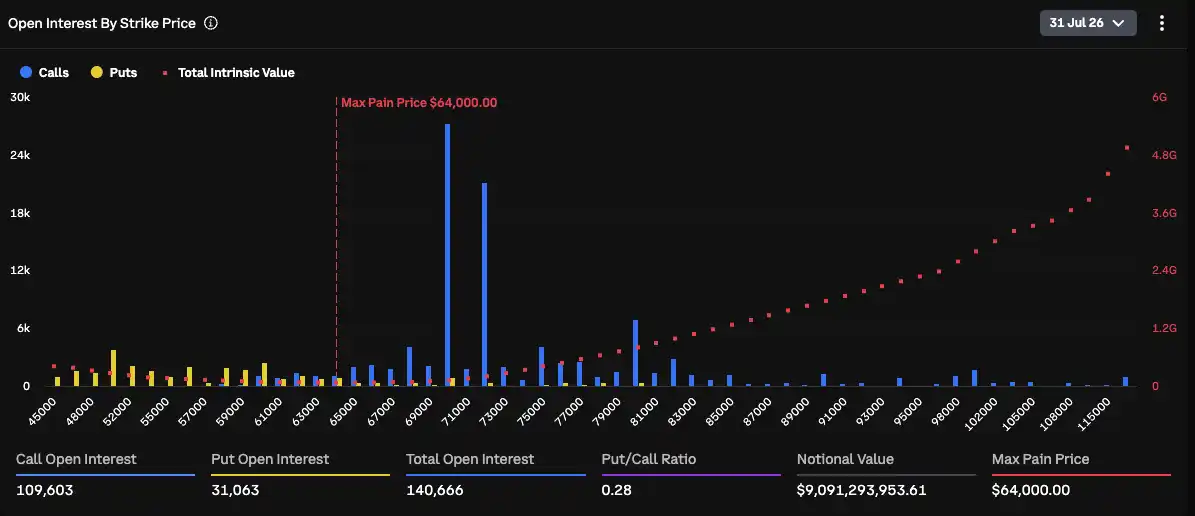
That puts the Fed decision directly in the last phase of the trade. Based on Bitcoin’s July 20 price, spot still needs to break through the $69,000 area before it can move into the $70,000-$72,000 band, and recent buying and selling has been concentrated around that level.
CryptoSlate’s on-chain analysis published July 19 placed the test point for the cost basis of recent buyers near $69,000, with Bitcoin still below that level at the time. The same analysis identified $52,891 as a conditional lower-pressure boundary if weak demand persists. Both levels move with price action, making them reference points rather than fixed destinations.
ETF flows add a second demand test
US spot Bitcoin ETF flows provide another way to gauge demand. Farside’s daily table recorded net inflows of $197 million from July 6 through July 10 and another $75 million from July 13 through July 17, for a combined $272 million.
During the same stretch, one trading day produced $424 million in outflows. That showed how quickly a positive run can reverse even after two weeks of net additions.
ETF buyers still added $272 million over those two periods, but the single-day $424 million withdrawal illustrated how fragile that support can be. A sustained break through the $69,000-$70,000 area, backed by steadier inflows, would offer broader confirmation for the spread. Repeated failure there would leave the trade looking more like a stand-alone tactical position into expiry.
Longer-term forecasts are running on different clocks
Those near-term conditions are separate from the longer-dated views offered by institutions. Digital asset financial services firm NYDIG said on July 10 that matching the duration of the previous two major cycle pullbacks, along with a shallower decline of about 70%, could imply a potential low near $38,000 to $39,000 in early October.
Coinbase Institutional, in an analysis dated July 3, identified $58,000 to $59,000 as the first high-intensity support zone, followed by $48,000 to $50,000, around $42,000, and then $39,000 to $40,000 if higher levels fail. Its July 6 positioning report said end-of-June positions had been washed out and that options skew was leaning toward downside protection. Both pieces came before the July 18 bull call spread flow and served as earlier risk markers.
Citigroup cut its 12-month Bitcoin target to $82,000 from $112,000 and set a $53,000 bear-case scenario tied to recession and continued ETF outflows. Citi also reduced its assumed 12-month net ETF inflow from $10 billion to zero. In other outlooks, Standard Chartered kept its $100,000 target for the end of 2026, while Bernstein maintained a more aggressive $150,000 year-end target.
Those figures cover an early-October cycle scenario, conditional support zones, 12-month bank targets, and year-end targets. They do not sit on the same time frame as a spread expiring on July 31.
The July path is shorter and more exact
For this trade, the decision tree is more immediate. Spot needs to cover the 8.9% distance to $70,000, absorb selling around the recent buyers’ cost basis, and do it while ETF flows remain uneven.
Bitcoin was up 0.80% over the past 24 hours and remained the largest crypto asset by market capitalization. The broader crypto market was valued at $2.23 trillion, with 24-hour trading volume at $69.65 billion and Bitcoin dominance at 58.73%.