
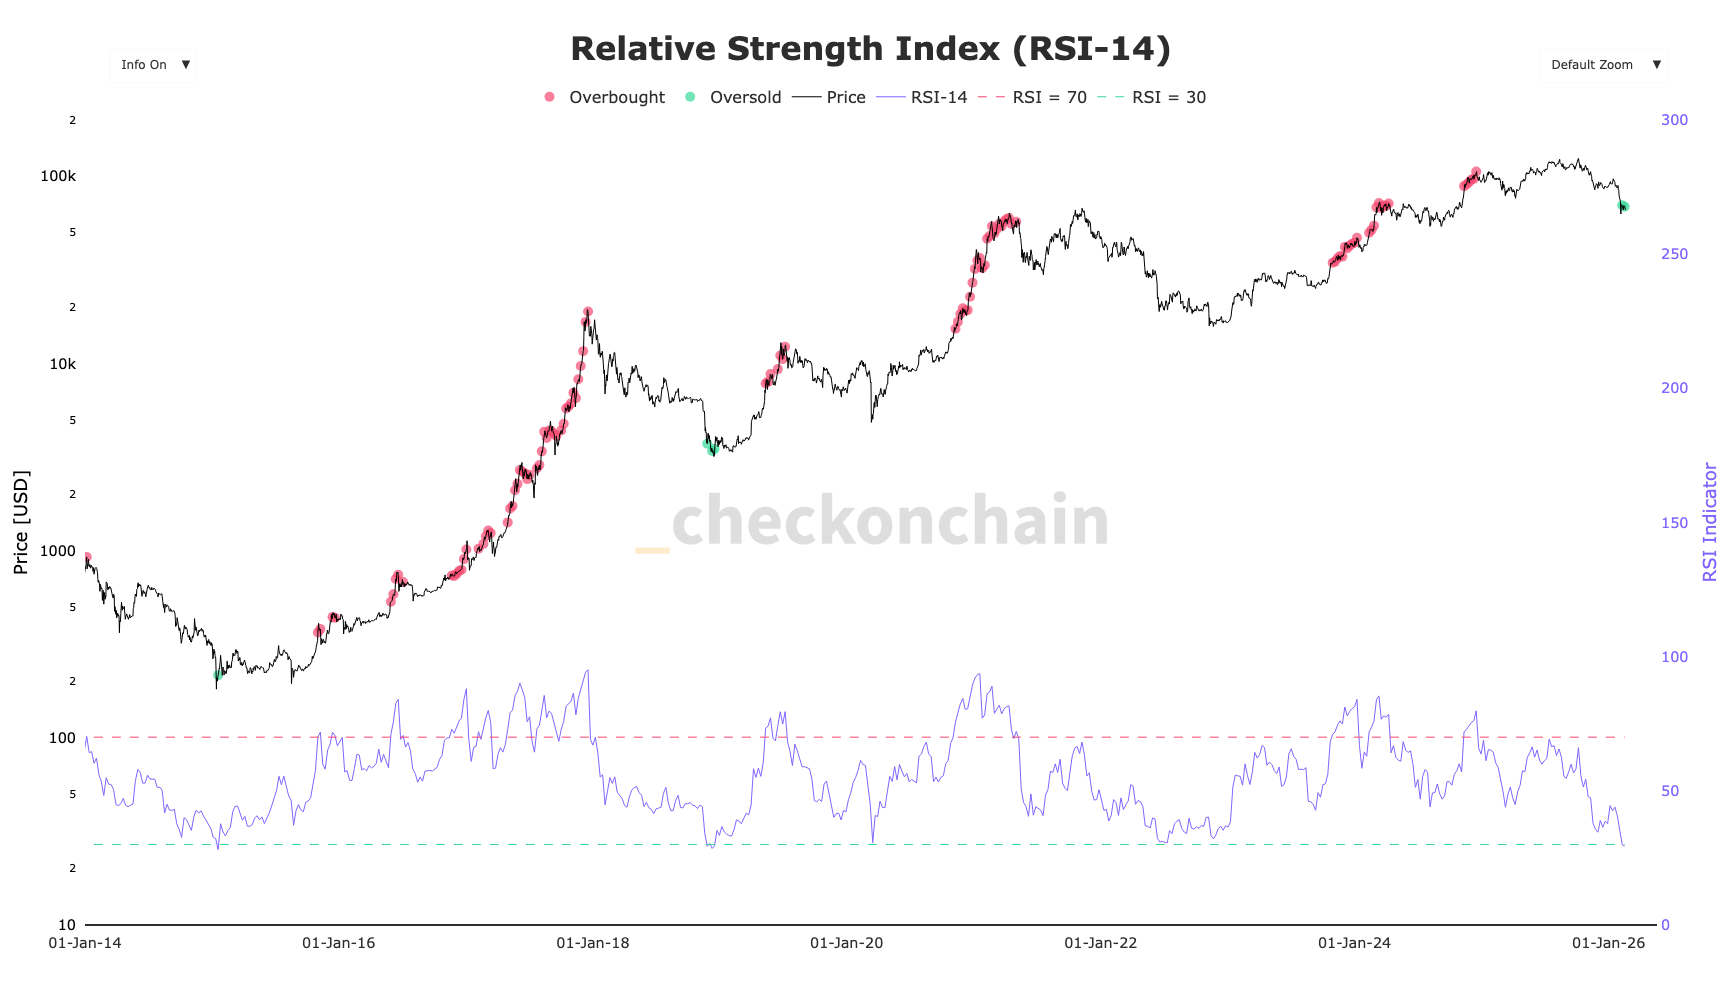
Bitcoin’s 14-day Relative Strength Index (RSI) dropped below 30 this month, marking only the third time that the signal has appeared in its history, according to checkonchain. The reading is widely used to flag oversold conditions, showing that selling pressure has become unusually intense over a short period.
RSI tracks momentum by comparing the speed and size of recent gains and losses across a 14-day window, producing a value between 0 and 100. The source says readings above 100 are generally treated as overbought, while levels below 30 indicate oversold conditions. Bitcoin last approached an extreme high in December 2024, when it first moved above $100,000.
Earlier sub-30 readings were followed by months of sideways trading
The previous two breakdowns below 30 both appeared near cycle lows. In January 2015, Bitcoin’s RSI fell to roughly 28 while price traded near $200. The market then spent about eight months consolidating before a sustained recovery took hold. A similar pattern showed up in December 2018, when RSI slipped below 30 around $3,500. That phase was followed by roughly three months of sideways accumulation before Bitcoin pushed higher.
Bitcoin trades near $66,000 as fear stays elevated
BTC is now trading around $66,000. Over much of the past 30 days, the Crypto Fear & Greed Index has remained in either “fear” or “extreme fear.” Since its October peak, Bitcoin has declined by more than 50%, briefly dropping toward $60,000.
Based on those earlier cases, the latest oversold RSI signal may point less to an immediate rebound and more to a prolonged period of consolidation, with price holding around the $60,000 area for the coming months before any new move higher.