Bitcoin 5-Wave Correction Structure Analysis
On the 4-hour timeframe, the oversold bounce that began from the June 6 low of $59,100 concluded at endpoint 39 ($67,300). The market then entered a clear 5-wave corrective structure (endpoint 39 to endpoint 44), with the (43-44) wave currently unfolding. The final location of endpoint 44 will determine the short-term direction: if above $58,110, a relatively strong technical rebound is expected, likely leading to a wide-ranging box consolidation; if below $58,110 but with bullish divergence in momentum, a rebound is still possible but with uncertain strength; if below $58,110 without divergence, further breakdown is a risk. Quantitative model analysis indicates the first two scenarios have a higher probability.
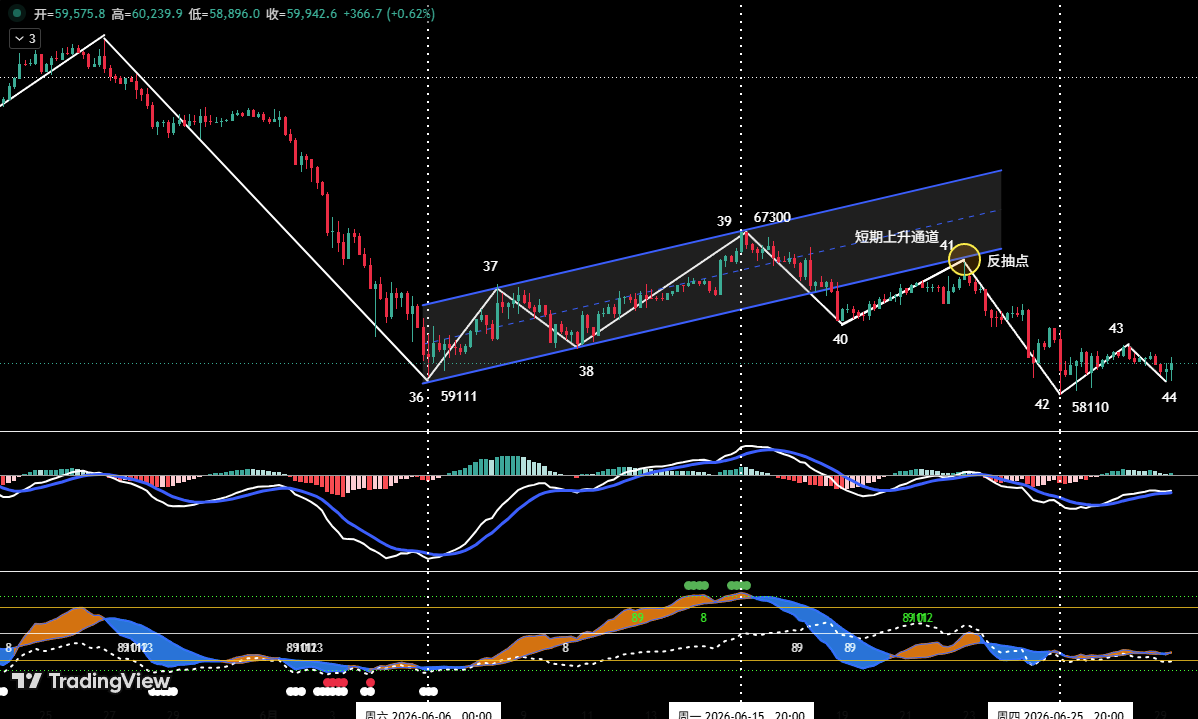
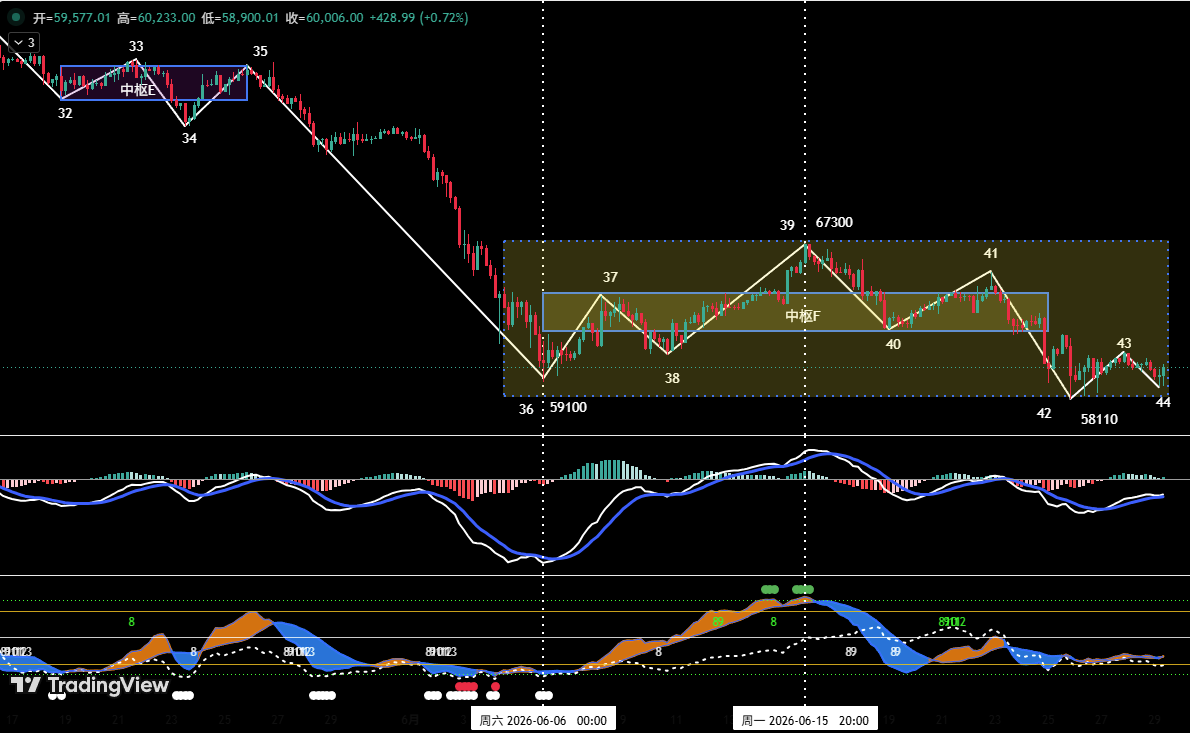
Key resistance zones: $60,900–$62,300 (previous swing high/low area), $65,500, and $67,300–$69,500. Support focuses on the previous low of $58,110. The medium-term strategy maintains 20% short positions (daily bearish channel breakdown confirmed); short-term strategy uses 30% positions for scalping on 30/60-minute timeframes, with three predefined operational plans (A/B/C) to dynamically adapt.
HYPE Corrective Structure and Support Opportunity
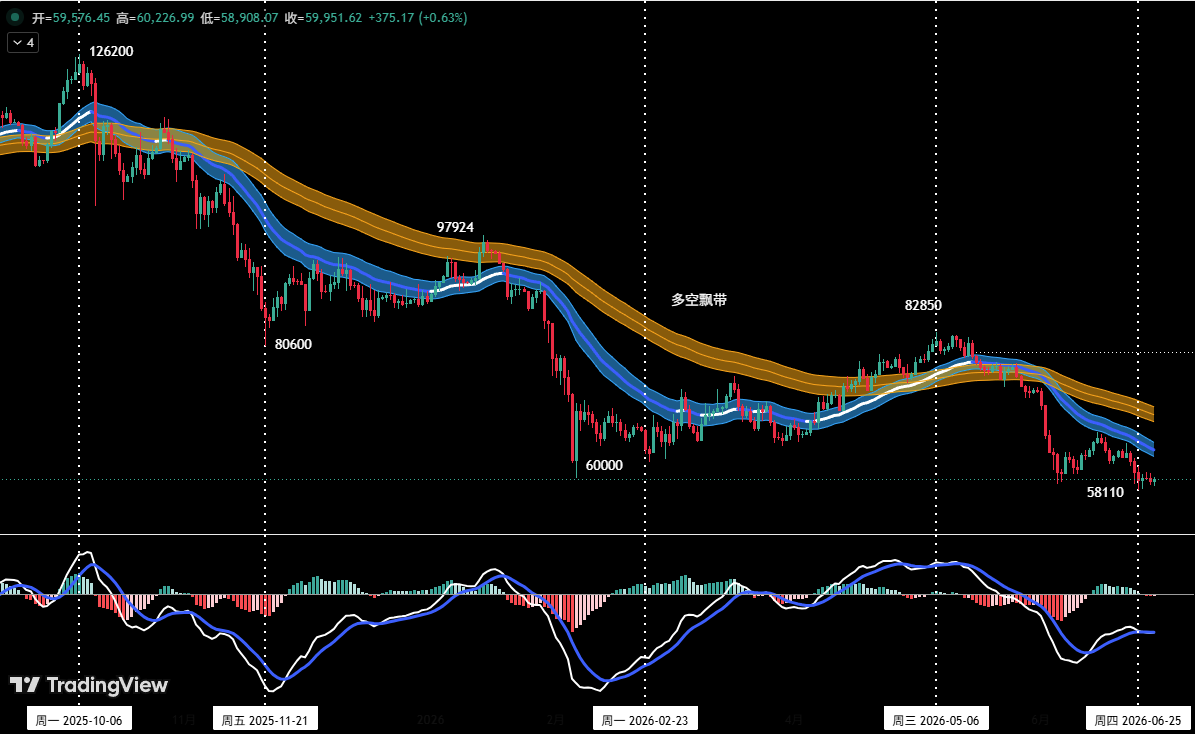
HYPE began its correction from the June 16 high of $76.94 (endpoint 51). On the 4-hour chart, it can be subdivided into five waves: 51-52, 52-53, 53-54, 54-55, 55-56. The current 55-56 wave is in progress, and the location of endpoint 56 is pivotal. Quantitative models suggest a higher probability of scenario one, where endpoint 56 forms a double bottom above the previous low. Key resistance at $65.5 and $71.5; support lies above $58.8 and deeper at $52–$54.
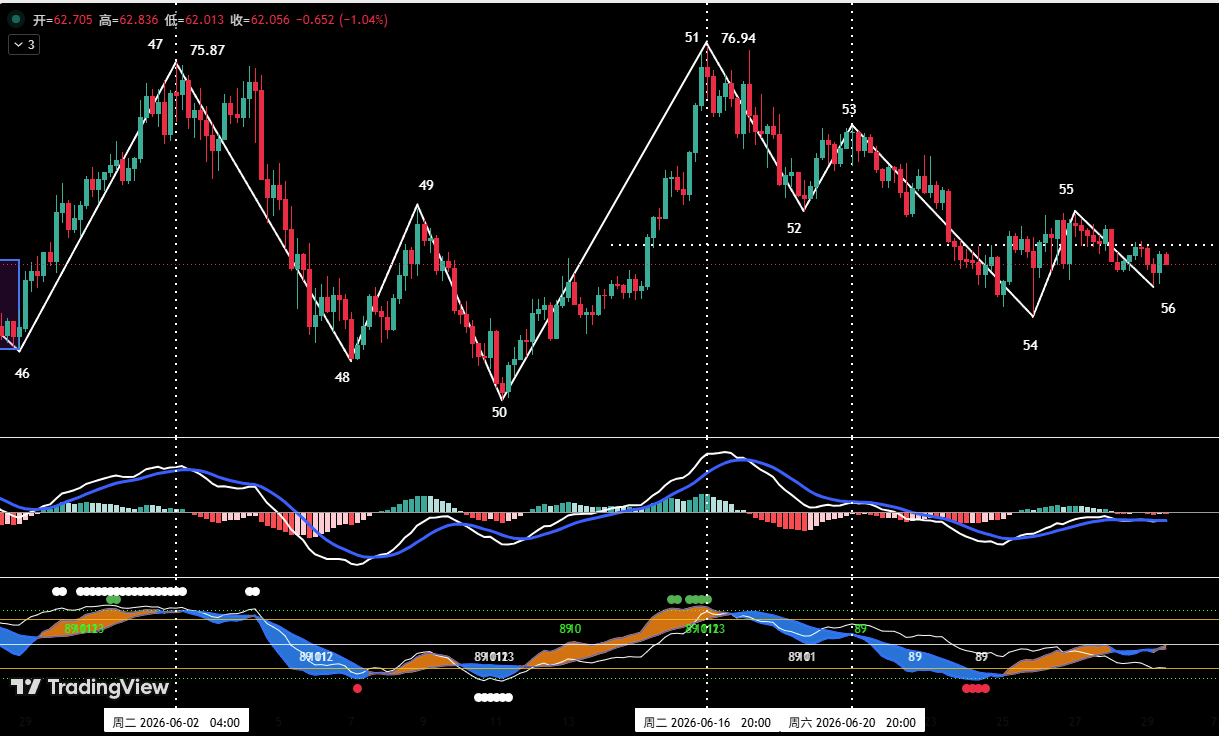
Short-term strategy: 'buy dips, avoid chasing'. When price stabilizes around the support zone with model-confirmed bottom signals, consider light long positions (≤30% of capital) with strict stop-losses.
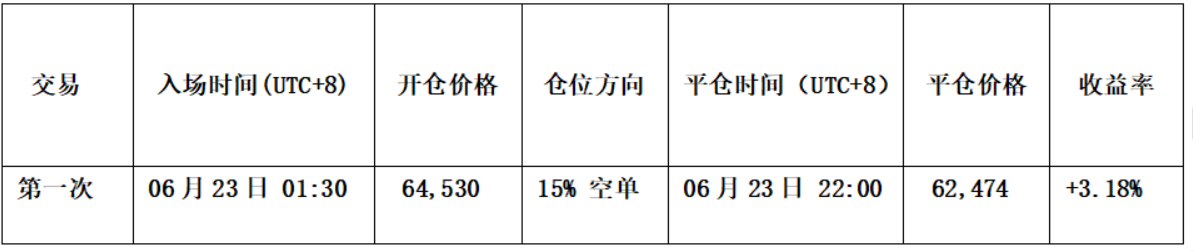
Last Week's Trades: Two Short Scalps Net 6.21% Profit
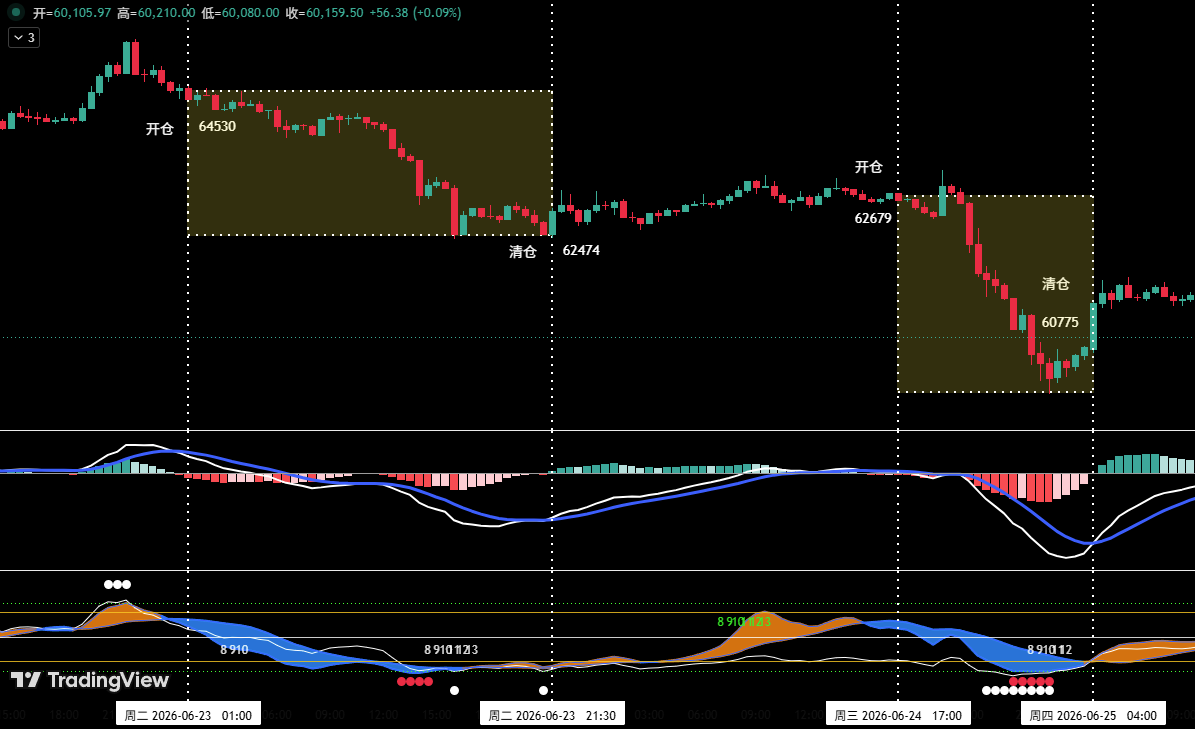
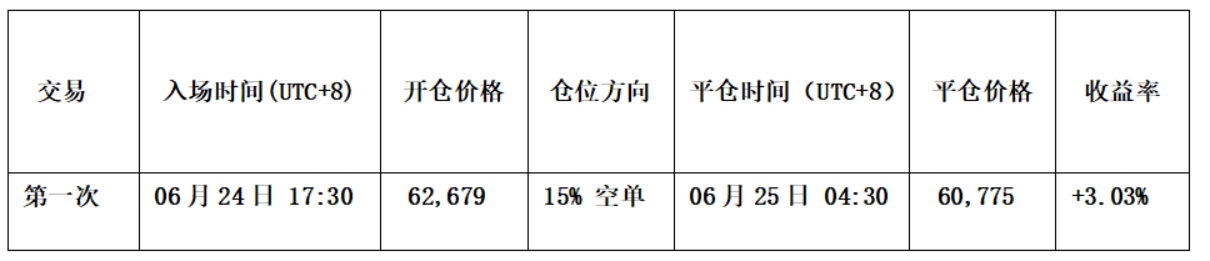
Adhering strictly to the operational plan, two short-term short trades were executed based on the spread and momentum quantitative models. Trade 1: Opened 15% short at $64,530, closed at $62,474, profit ~3.18%. Trade 2: Opened 15% short at $62,679, closed at $60,775, profit ~3.03%. Total profit ~6.21%. All trades used 1x leverage.
Risk Disclaimer
Financial markets change rapidly; all analysis and strategies require dynamic adjustment. The views, models, and strategies herein are based on personal technical analysis and serve only as a trading journal. They do not constitute investment advice. Market risk exists; invest with caution and do not rely on this content for decisions.