
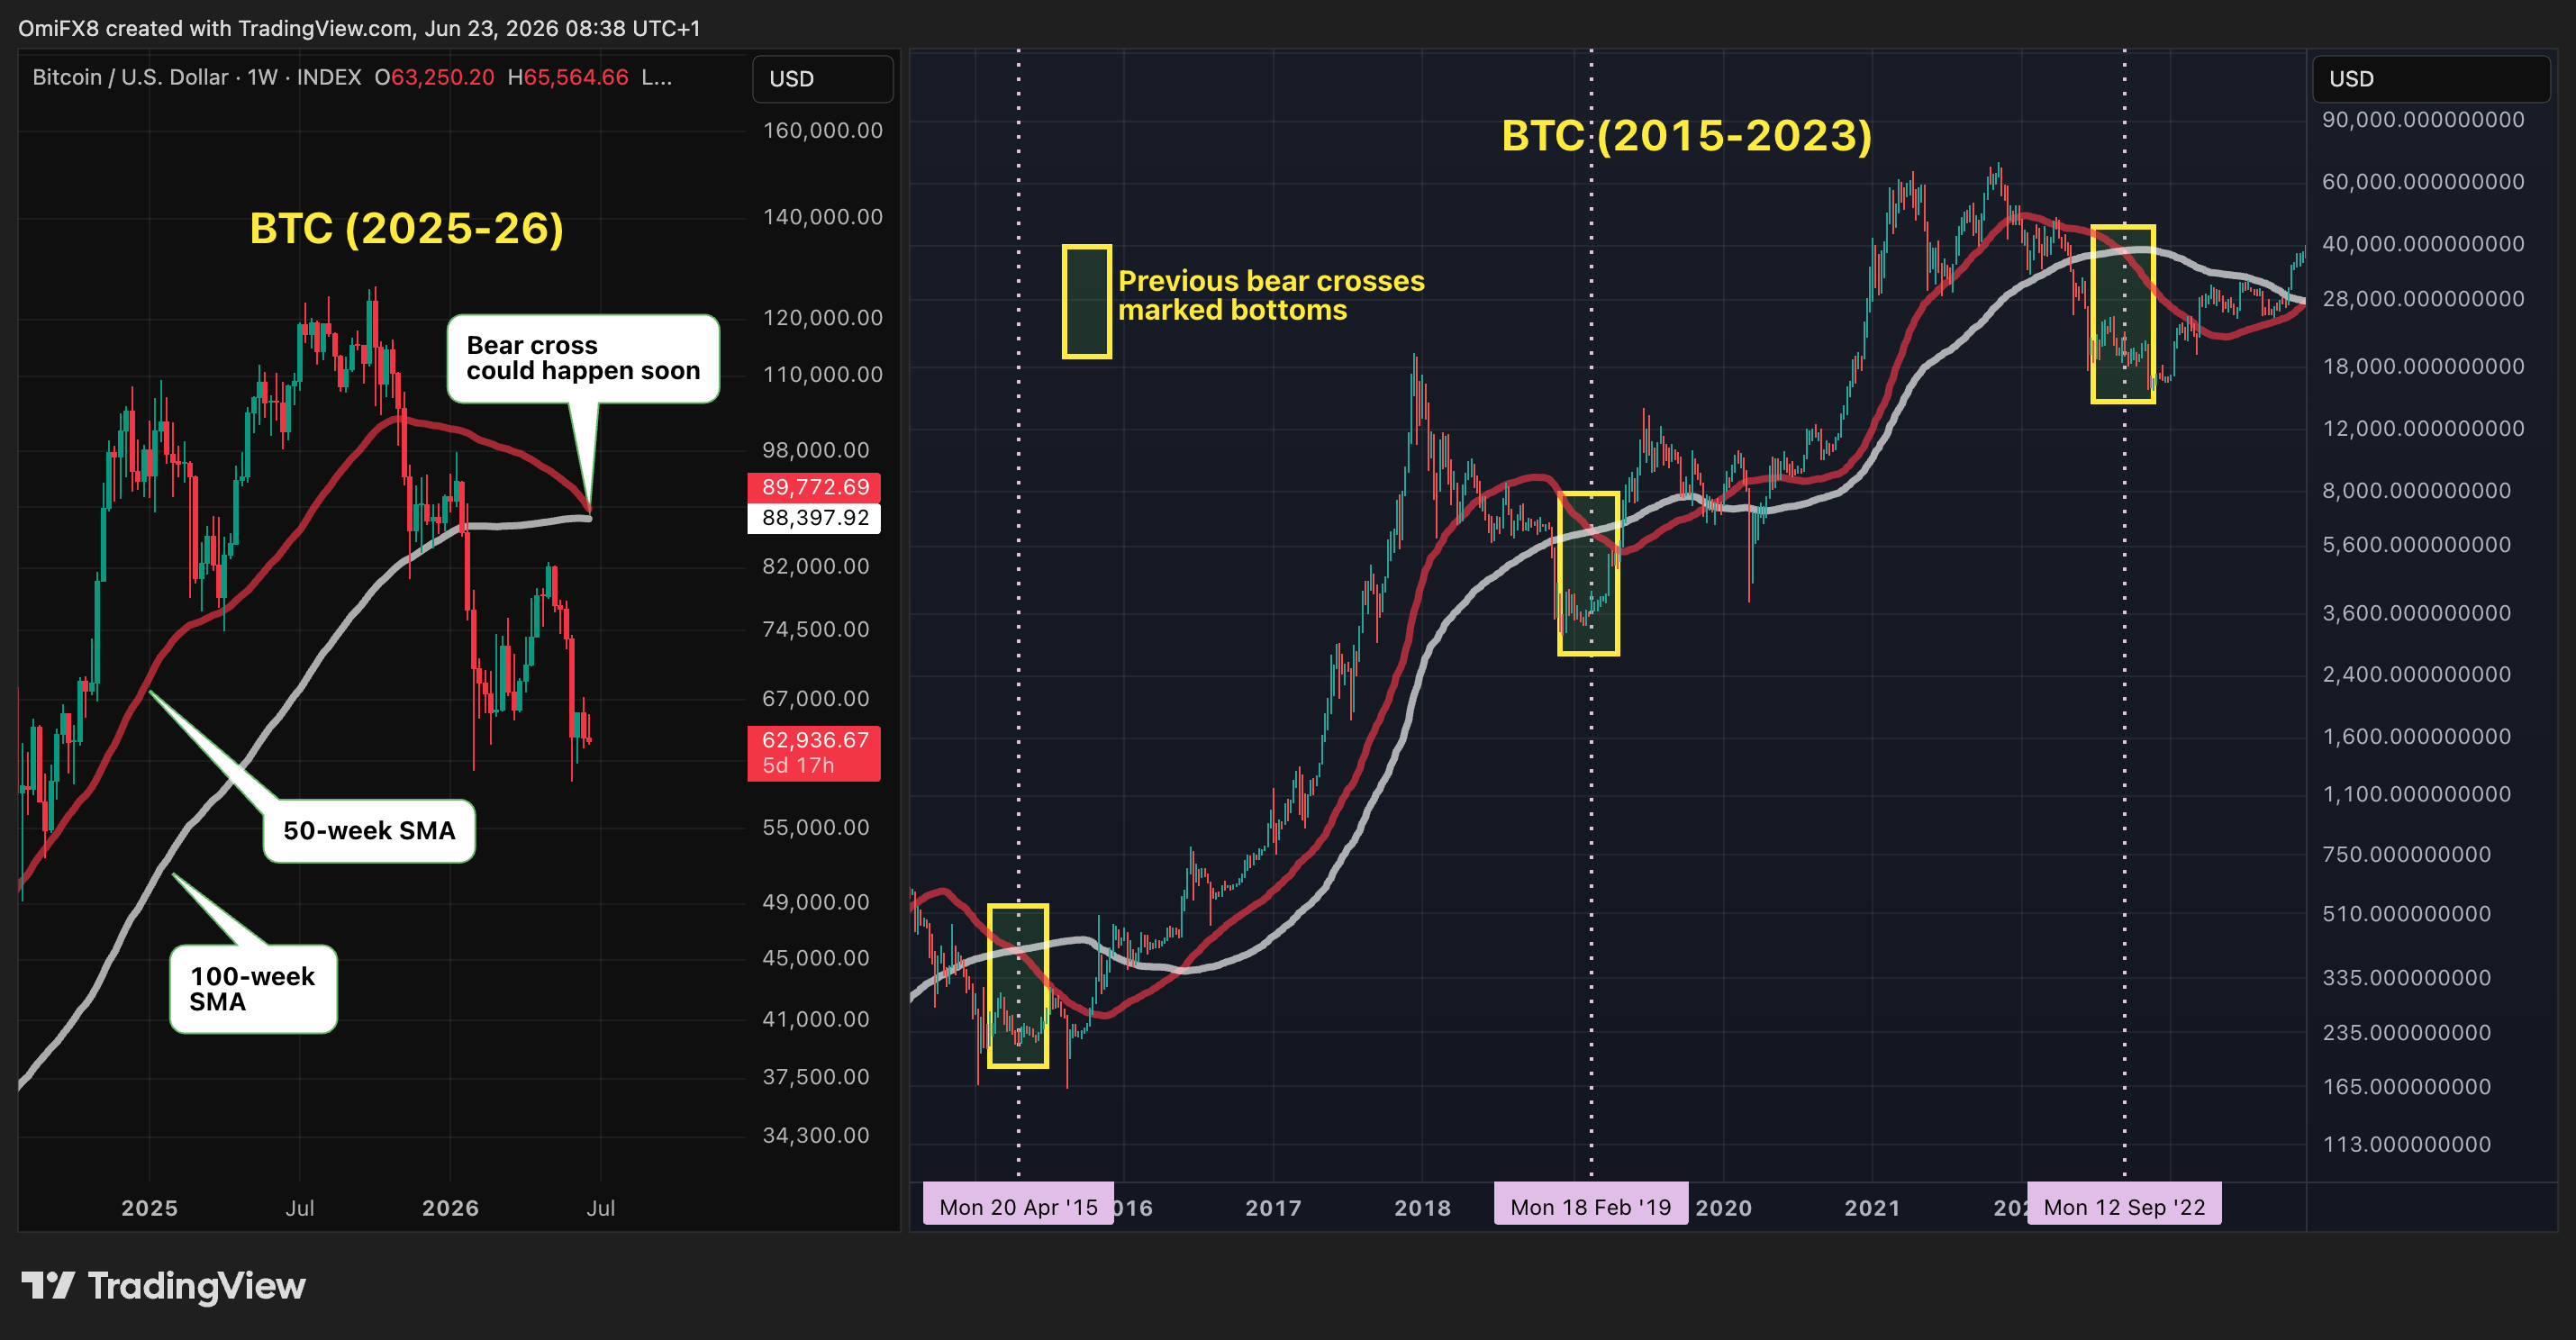
Bitcoin is nearing a weekly chart signal that is usually labeled bearish, yet some analysts read it very differently. At the current pace, Bitcoin’s 50-week simple moving average could slip below the 100-week average as soon as next week, creating what technical traders call a bear cross.
On the surface, that sounds negative. A shorter-term average dropping under a longer-term one is often treated as proof that recent price action has weakened enough to drag trend momentum lower. In Bitcoin’s case, though, the historical record attached to this specific setup points in the opposite direction.
All 3 prior crosses lined up with market bottoms
According to the source material, Bitcoin has seen this 50-week versus 100-week bear cross only three times in its history. Each time, the signal marked a market bottom and was followed by a rally that lasted about three years. If that pattern holds again, the pending cross may say less about fresh downside and more about a decline that is already close to exhaustion.
That interpretation rests on the nature of long-duration moving averages. They are lagging tools. By design, they summarize prices that have already traded, which means they often react after a major move has largely played out rather than before it begins.
The setup reflects past damage more than future direction
The 50-week and 100-week averages represent roughly one year and two years of prior price action. The coming crossover is therefore mostly a delayed response to Bitcoin’s earlier slide. The source notes that Bitcoin fell about 50% from $126,000 in October to nearly $60,000, and that decline is what has pushed the two averages toward an intersection.
Because of that lag, the signal has limited forecasting power on its own. By the time a bear cross appears on such long time frames, speculative excess is often already gone, short-term traders may have exited, and capitulation may have already happened. That is why some market participants treat the event less as a warning and more as a possible sign that a bottoming phase is already in place.
Bond yields, ETF flows and Strategy still matter
The article also cautions against drawing firm conclusions from a sample size of only three cases. Past patterns are not guarantees, and broader macro conditions can easily overwhelm a technical setup. The source specifically points to bond yields, ETF flows, and the latest moves by Strategy (MSTR) as key variables for Bitcoin’s next move.
At the time of writing, Bitcoin traded near $62,400. The 50-week average stood at $89,771, while the 100-week average was $88,397. With the two lines now close together, attention is shifting from the crossover itself to whether spot price can hold near current levels once the signal arrives.