

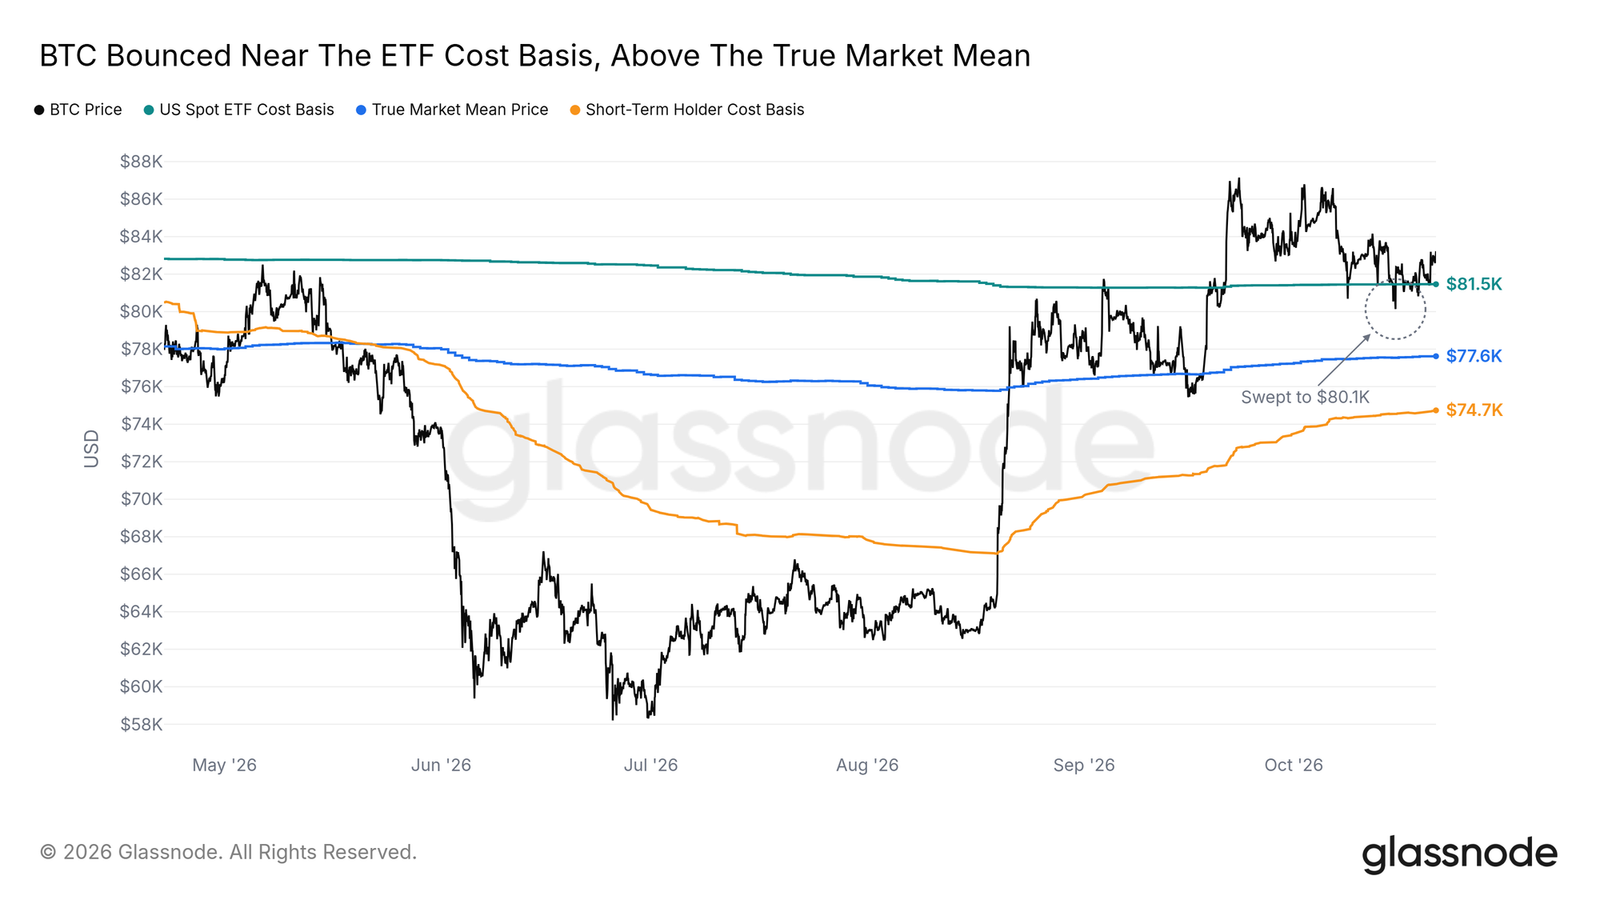
Bitcoin has once again found support near $80,000, but Glassnode says that line is not a comfortable floor yet. In its latest report, the firm said BTC briefly closed an hourly candle at $80.1K on Oct. 15, effectively sweeping the average cost basis of U.S. spot ETF holders and Bitcoin treasury companies before buyers stepped back in over the following days. Overhead, the market still faces a three-layer resistance zone between $85K and $87.5K: the cost basis of 6- to 12-month buyers, a concentrated Binance spot sell wall, and the largest nearby futures liquidation clusters.
$80K is more than a round number
Glassnode said the Oct. 15 dip mattered because it tested the cost basis of two major holder groups at the same time. The U.S. spot ETF cost basis sits slightly above $80K, while the average cost basis for the Bitcoin treasury companies tracked by Glassnode is about $80.2K. Both fall inside the $80K to $81.5K band. After the hourly close at $80.1K on Oct. 15, the next hourly candle moved back above that level.
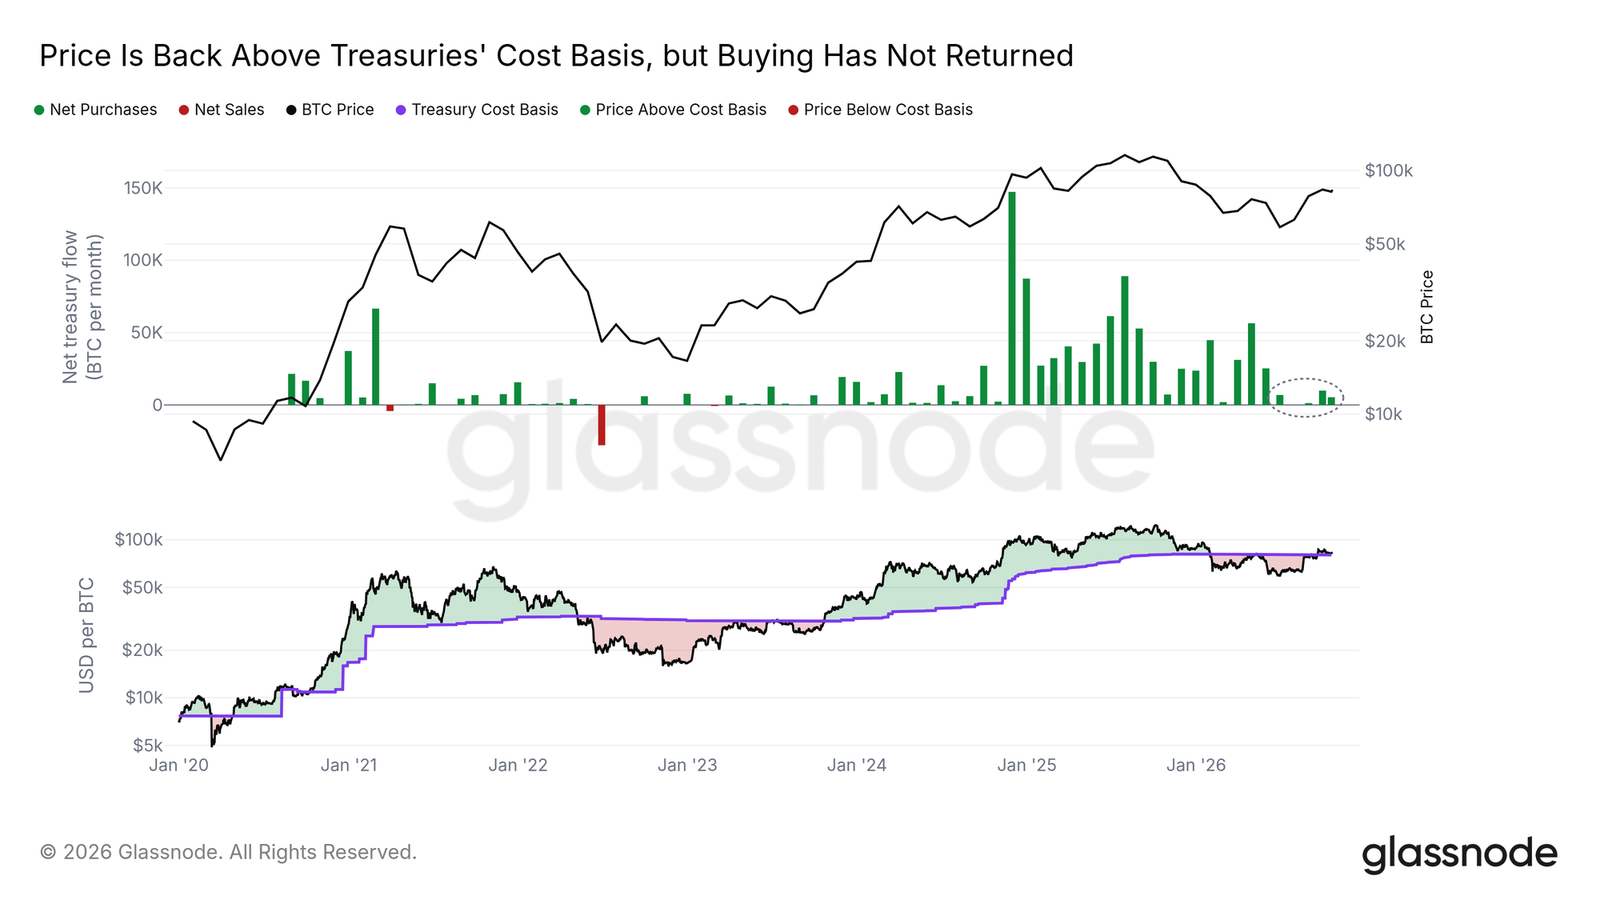
Corporate treasury buyers have spent most of this year underwater. At the end of June, they were more than 25% below cost at one point. Since Sept. 18, however, daily closes have remained above their average basis. The issue, according to the report, is that price has recovered but buying has not. Since June, monthly accumulation by these treasury companies has stayed below one-tenth of the peak seen in November 2024. If Bitcoin posts a daily close below $80K, ETF holders and treasury companies would, on average, be back in loss territory.
Below that sits what Glassnode calls the “true market mean,” the average cost basis of active investors, at about $77.6K. The Oct. 15 move did not reach that level.
Three layers of resistance between $85K and $87.5K
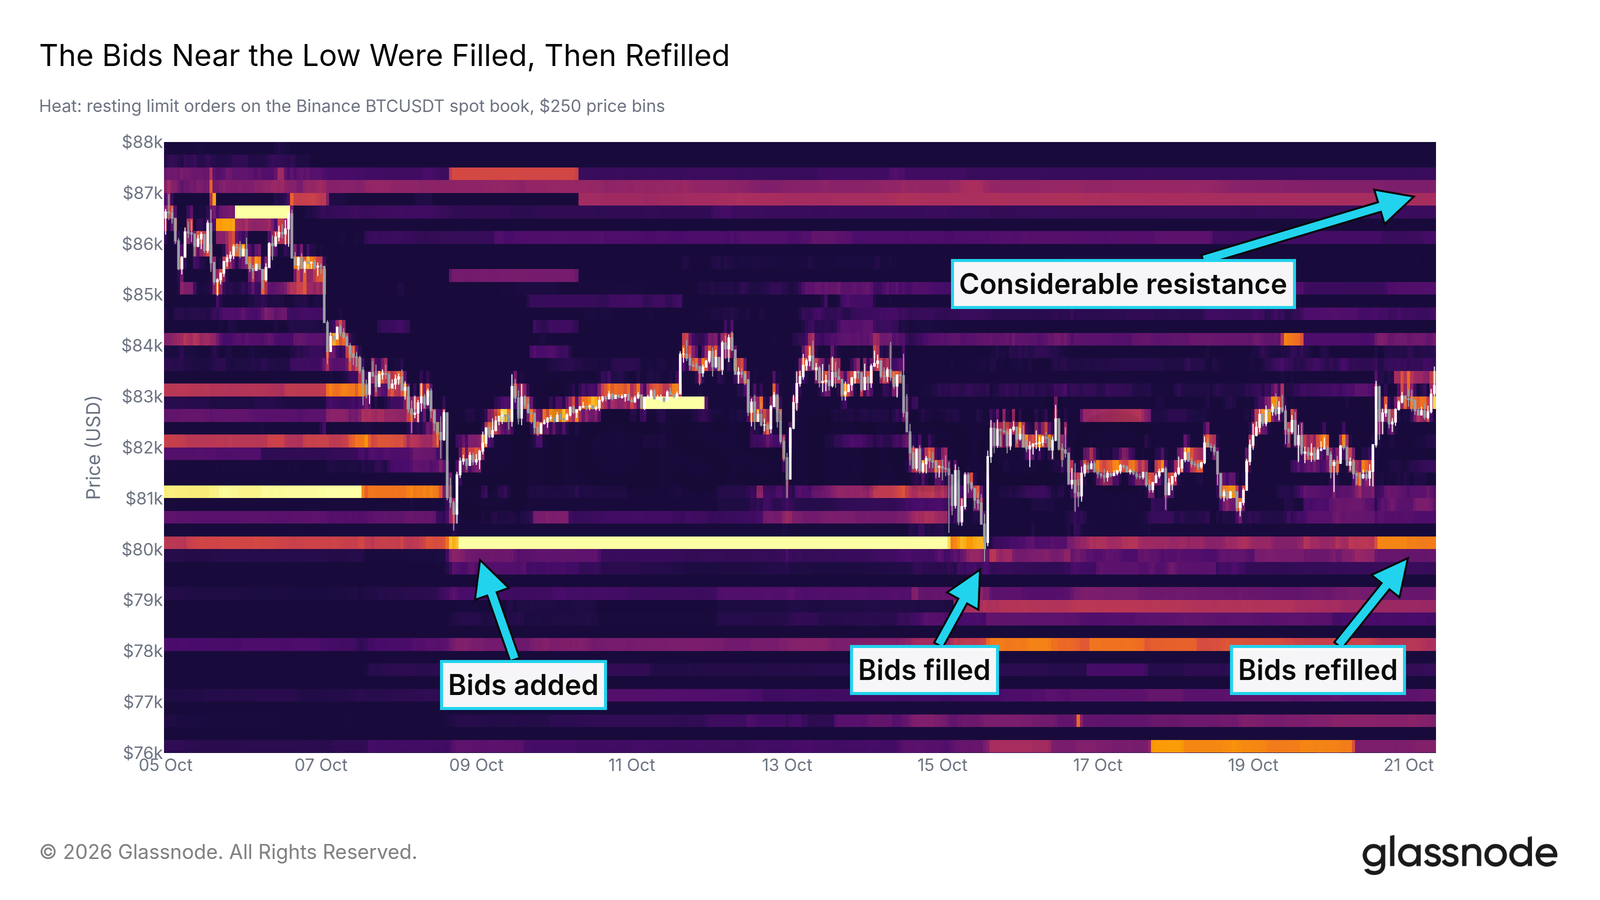
There is visible demand around $80K, but the path higher is crowded. The largest buy block on Binance’s spot order book had been sitting at $80K, was swept and mostly filled on Oct. 15, and had been rebuilt by Oct. 20. The size is smaller than at the peak, though Glassnode said it still shows buyers are willing to take supply in that area.
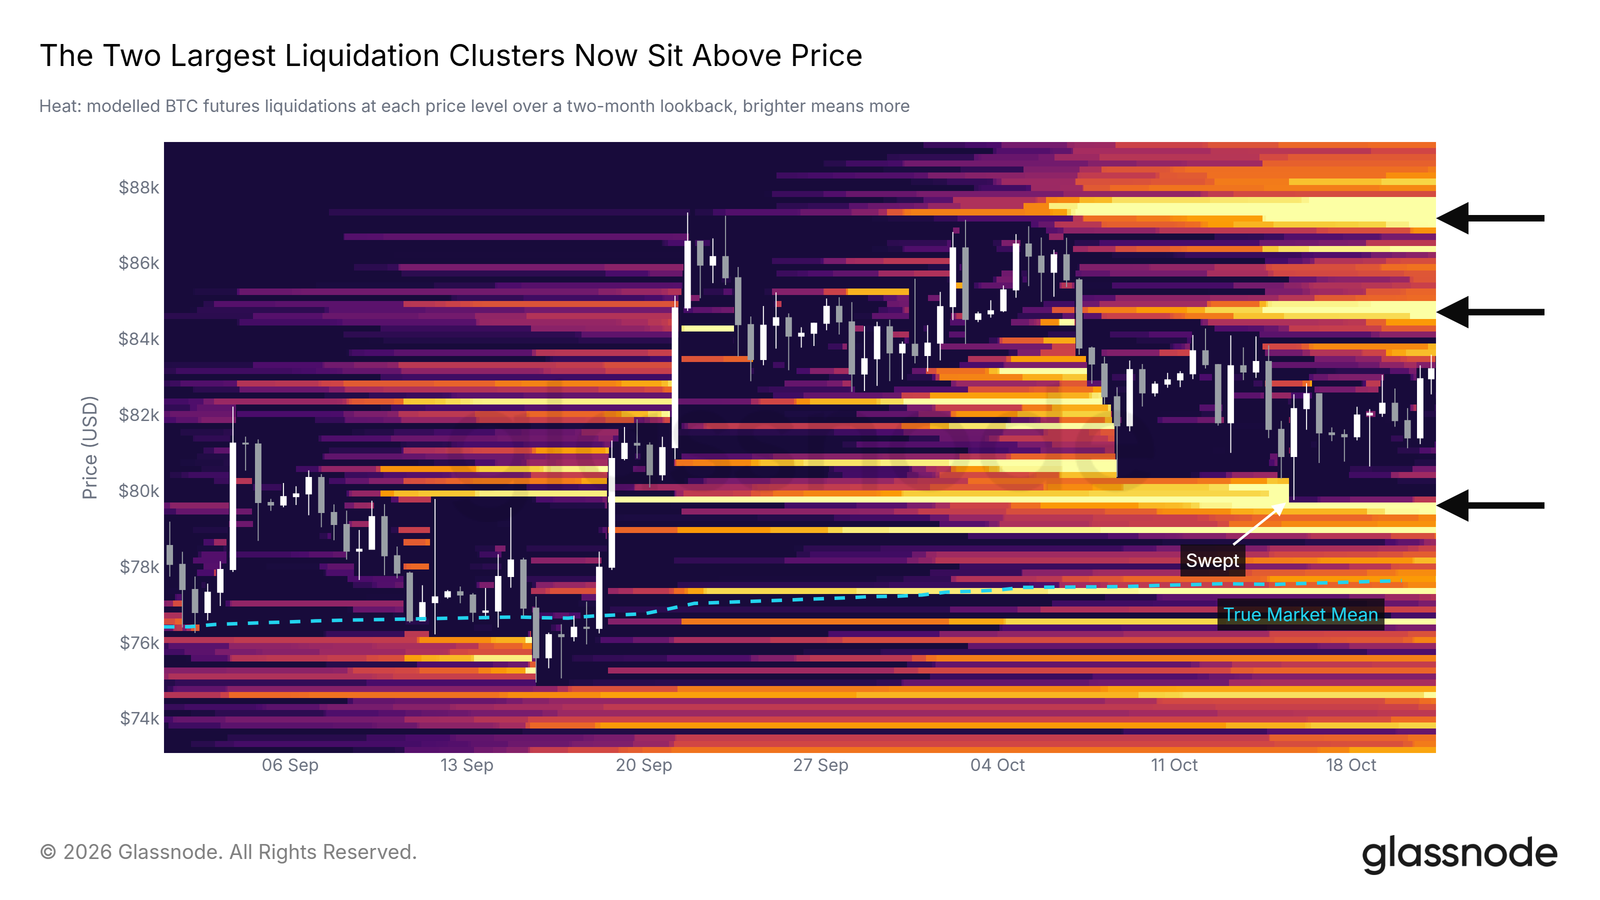
The first heavy resistance zone lies between $86.5K and $87.5K, where spot sell orders are most concentrated. Liquidation heatmaps show that after the bright band near $80K was cleared on Oct. 15, the two largest liquidation clusters shifted above price, one near $85K and another near $87K. A move toward $87K could force short covering and speed up the advance, but that same area also runs into spot selling. On the downside, a liquidation line remains near $79.6K, just below the Oct. 15 low.
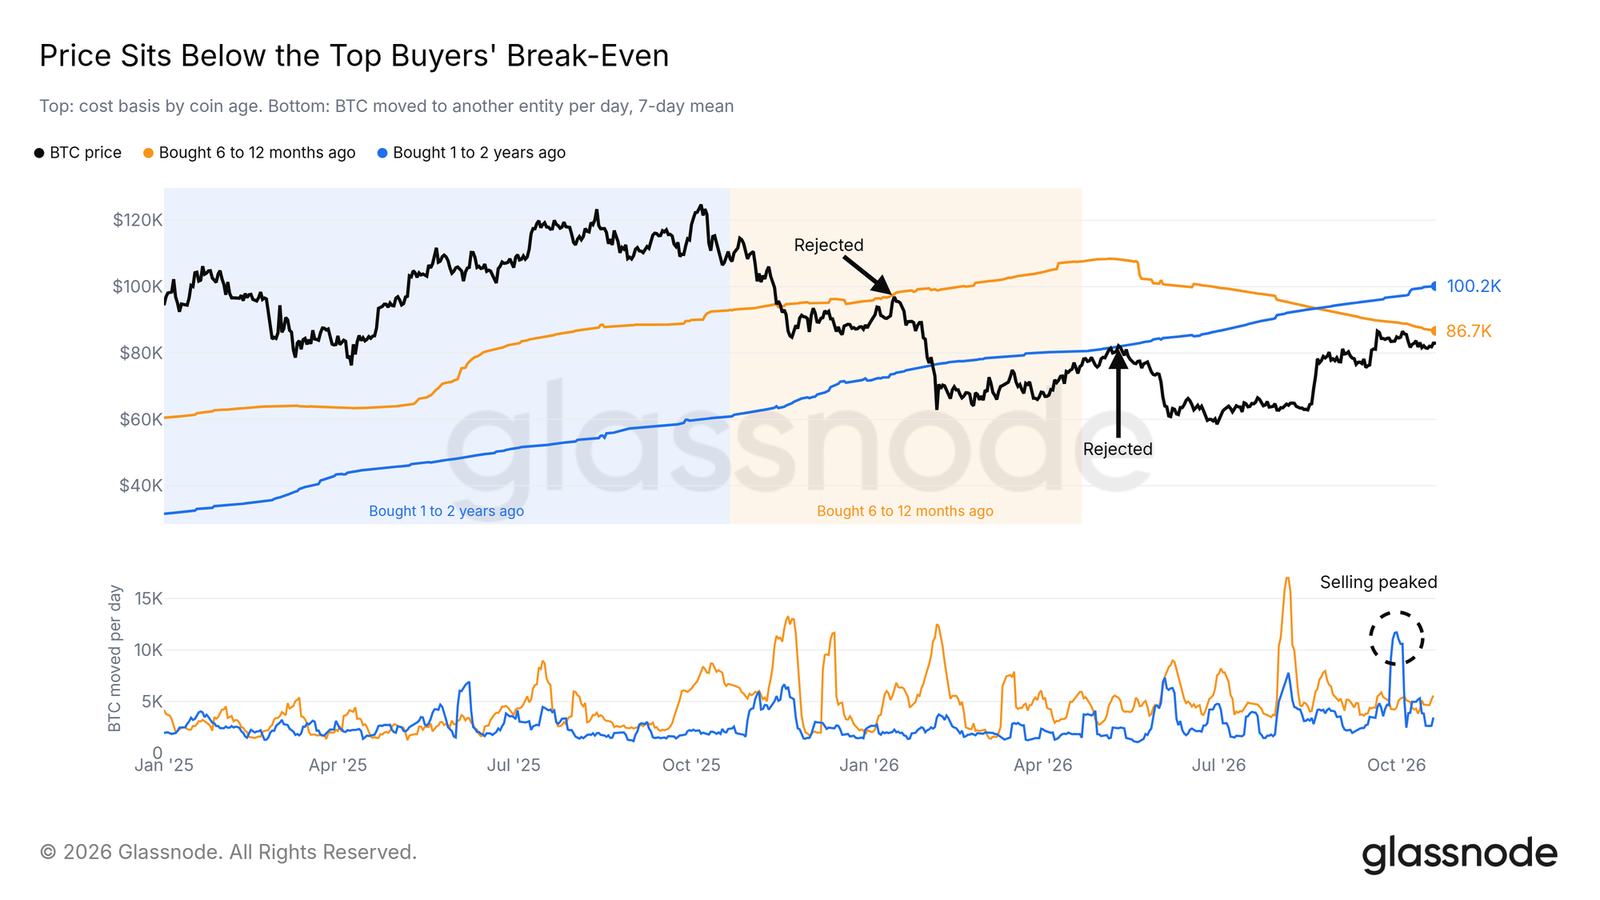
A broader ceiling comes from buyers over the past two years. Bitcoin bought 6 to 12 months ago now has a cost basis of about $86.7K, down from the $88K cited in the previous week’s report. Coins bought 1 to 2 years ago have a cost basis close to $100K. Glassnode said selling from that older cohort is slowing. Distribution by 1- to 2-year holders peaked in early October after the September high, and daily selling volume has now dropped to less than one-third of that earlier pace. A daily close above $86.7K would bring the 6- to 12-month cohort back to breakeven on average and remove the nearest supply layer.
ETF inflows returned, but volume did not
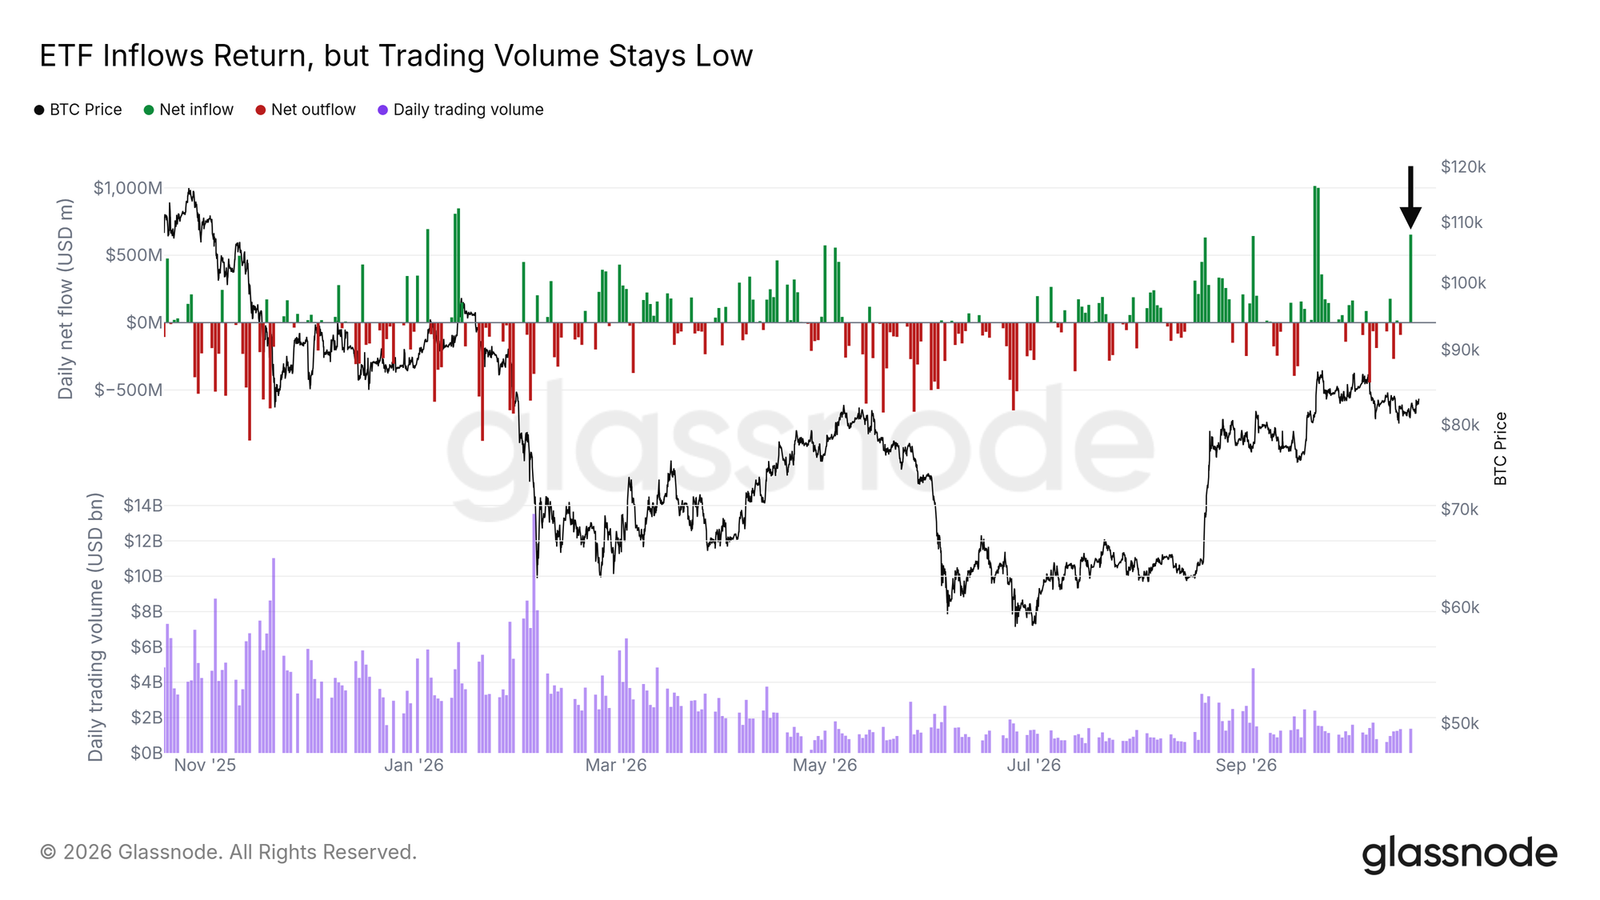
Glassnode flagged one constructive change in flows. After a week of net outflows, U.S. spot ETFs recorded about $653 million in inflows on Monday, Oct. 19, the largest single-day intake since Sept. 22 and enough to push weekly flows back into positive territory.
Trading activity, though, has not matched that rebound. ETF turnover that day was below a typical session over the past year, and the 30-day average volume is now less than one-quarter of the level seen a year ago. In other words, inflows are back, but the report said it is still unclear whether demand is broadening. Glassnode argued that only a run of continued inflows alongside stronger volume would show that buying is more than a one-day event.
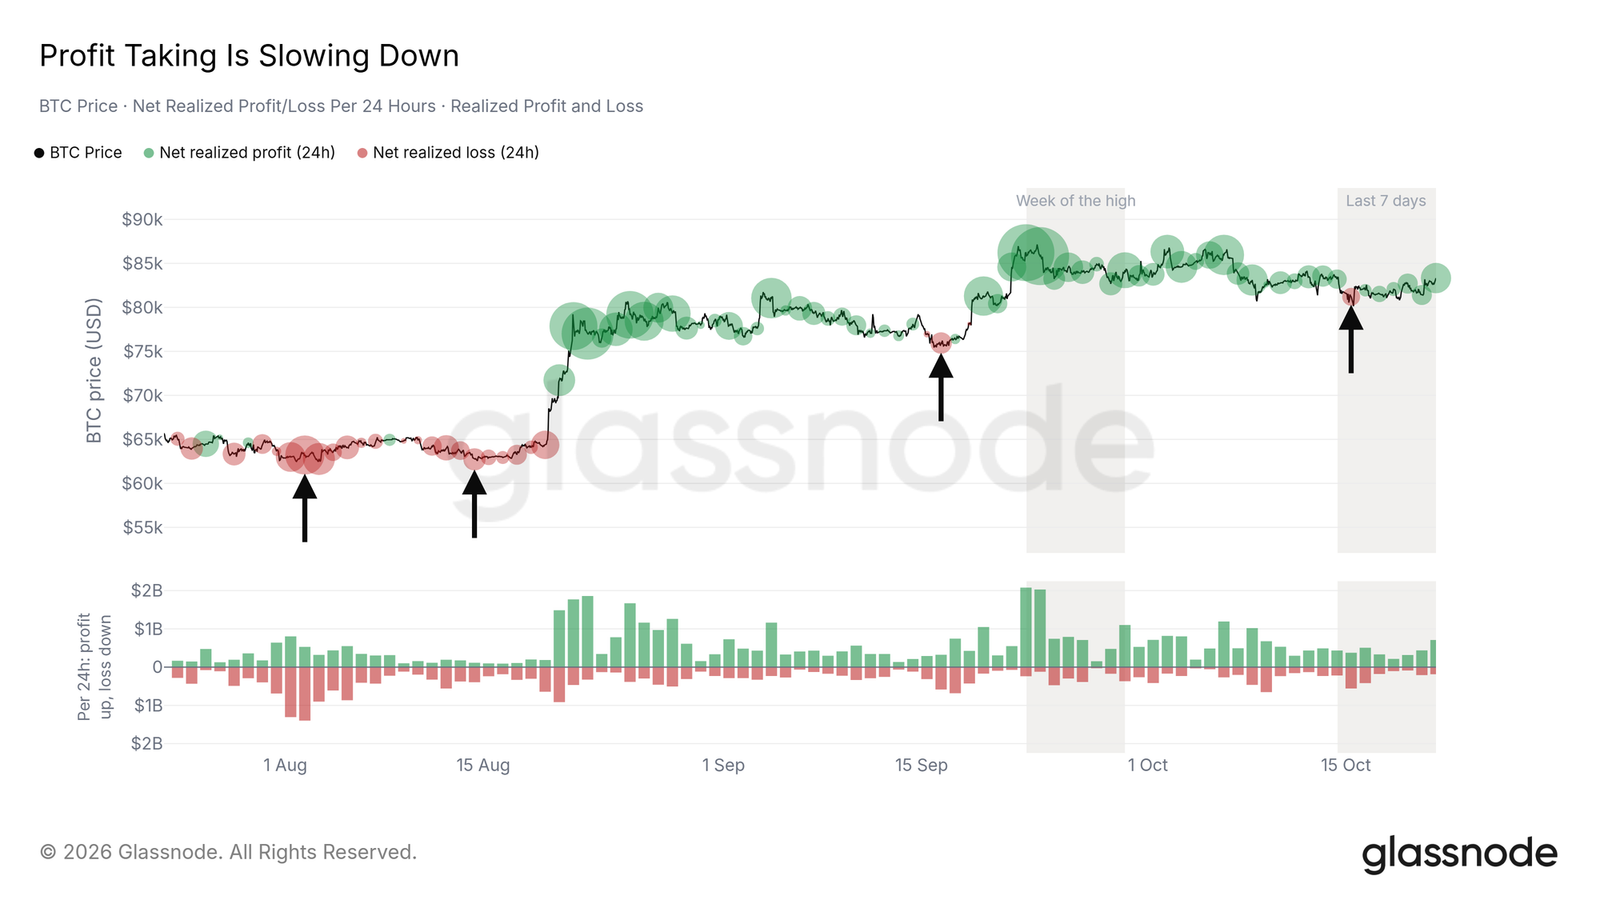
On-chain profit-taking has also cooled. Over the past week, the growth rate of realized profit fell to about half the level seen in the week of the September peak. Realized losses stayed stable, with the largest single loss recorded in the 24 hours ending on the morning of Oct. 15, when Bitcoin was sliding toward $80K. If profit-taking heats up again as price approaches $87K, Glassnode said that would be the first sign that sellers are returning near the top of the range.
Two dates on the calendar: Oct. 28 and Nov. 11
Glassnode said two upcoming events could break the range.
The first is the Federal Reserve’s rate decision on Oct. 28. WTI crude is up about 73% this year, and household inflation expectations have risen by 0.5 percentage points. Core inflation is roughly flat versus the start of the year, but both headline CPI and core CPI for September came in above forecasts. The 2-year U.S. Treasury yield has climbed by more than 1 percentage point this year to 4.8%, well above the upper end of the Fed’s 4% target range, even after a rate increase on Sept. 16. Bitcoin rose about 10% after that hike. If oil keeps pushing inflation expectations higher, the report said, a second rate increase cannot be ruled out.
The second is MSCI’s index removal list, due on Nov. 11. After the U.S. stock market closed on Oct. 15, MSCI approved a new rule aimed at “non-operating companies.” In its August consultation, using May data for testing, MSCI had already flagged Strategy and Metaplanet. Companies already included in MSCI indexes are removed only if they fail the test in both of the most recent annual filing periods. The final list will be published on Nov. 11 and take effect at the close on Nov. 30.
Strategy shares fell nearly 10% on Oct. 16, their worst single-day drop since February, while Bitcoin was almost unchanged that day. If Strategy appears on the list, funds tracking MSCI indexes would be forced to sell the stock. With treasury companies already cutting Bitcoin purchases sharply, Glassnode said the immediate pressure would be on the share price, followed by a more direct question: whether the company would keep buying Bitcoin.
Altcoin leverage has cooled, but positions remain largely in place
Crowded altcoin trades have started to unwind. After Bitcoin moved toward $80K and found buyers on Oct. 15, the median altcoin fell about 4% over the following weekend, the largest weekend decline since May. Glassnode’s “single-asset bubble” gauge, which tracks leverage crowding in individual altcoins, peaked on Oct. 7 and then dropped out of its elevated zone. Its “global bubble” measure for the broader altcoin market never entered the elevated zone and has since moved lower.
Funding rates tell a similar story. At the end of September, nearly one-quarter of altcoins were paying funding above neutral. That share has now dropped to less than 5%, close to the bottom of the two-year range. Still, the report cautioned that after adjusting for price changes, open interest is only about 5% below the October peak. Most leverage is still open. If funding rates start rising again, Glassnode said that would be the first sign of a fresh crowding cycle.
Rotation, tokenized gold, and exchange reserves
The report also mapped this year’s leadership rotation across assets. On a two-month return basis, gold and silver led in the first quarter, U.S. equities led from spring through July, and Bitcoin has led over the past 10 weeks.
Trading in tokenized gold on crypto exchanges has moved with the metals trade. Spot volume in tokenized gold peaked in mid-February when precious metals were leading, then fell to 15% of that peak by late July. It more than doubled again in mid-September when Bitcoin took the lead, then slipped back to 20% of the February peak. Binance still holds the largest share, while OKX and Gate posted the biggest gains this year. Gate’s share rose from 0.6% in 2024 to 12% so far in 2026.
Even as spot volume cooled, gold exposure did not leave in a meaningful way. Open interest in tokenized gold perpetuals now equals 7.0 tonnes of gold, 62% above the level seen when spot volume peaked in February. In mid-September, as spot trading slowed, that figure kept rising from 5.0 tonnes, suggesting traders were holding gold exposure for longer. Since Jan. 1, Gate has accounted for 42% of the total net increase in open interest, lifting its rank from ninth to second. OKX climbed six places. On a one-week average, Gate led the exchanges tracked by Glassnode with 1.7 tonnes, followed by OKX at 1.5 tonnes. The report said that if metals stop leading and positions still hold above 6 tonnes, that would show traders are keeping gold exposure without support from a strong metals trend.
Bitcoin reserves on exchanges are thinner overall
Bitcoin reserves on exchanges, by contrast, have generally become thinner. Glassnode’s proof-of-reserves indicator tracks public exchange addresses. Among 11 exchanges holding at least 1,000 BTC, six now hold less than they did a year ago. Gate’s reserves rose 4.9%, while the median change across the other 10 exchanges was a decline of 6.4%. The breadth of those declines widened in spring: at the end of last November, only four exchanges held less than they had in October of the prior year; by the end of May, that number had risen to eight, and it now stands at six.
Growth at the largest exchange kept the aggregate total from falling, but the other 10 exchanges combined are down about 10%. Gate published its latest proof of reserves this week. As of Oct. 18, its reserves exceeded user deposits by about $1.4 billion, and coverage ratios for Bitcoin, Ether, stablecoins, and other major assets were all above 100%.
The range is still intact
Glassnode’s conclusion is straightforward: Bitcoin remains trapped inside the range. The Oct. 15 dip found buyers around the $80K to $81.5K zone defined by ETF and treasury-company cost bases, and profit-taking eased afterward. Above the market, the $85K to $87.5K area still contains the 6- to 12-month cost basis, concentrated spot sell orders, and the largest liquidation clusters.
A daily close above $87.5K, combined with continued ETF inflows and stronger trading volume, would suggest demand is starting to absorb that supply. A daily close below $80K would push ETF holders and treasury companies back into average losses and bring the true market mean near $77.6K into view. Between those two levels, the market still has to get through the Fed’s Oct. 28 decision and MSCI’s Nov. 11 list.