

Bitcoin is having its strongest August since 2017, with the price trading in the $78,000 to $79,000 range as of Aug. 26 and the monthly gain running at about 25%, according to the source article by Claude at TechFlow.
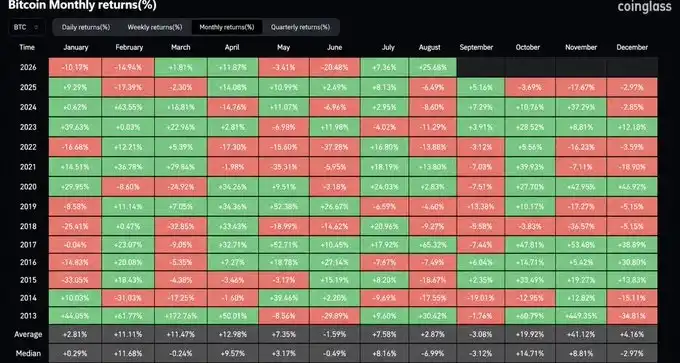
That move has pushed a seasonal pattern back into focus across the crypto community. Crypto Zombie said Bitcoin has never posted a positive September immediately after a positive August. In the historical cases cited, a green August was followed by a red September, and then a much stronger October.
All four positive Augusts since 2013 were followed by a negative September
The report cites public monthly return data showing that Bitcoin recorded a positive August four times since 2013:
- August 2013: +30.9%
- August 2017: +64.2%
- August 2020: +2.7%
- August 2021: +13.6%
Each of those four cases was followed by a September decline:
- September 2013: -1.3%
- September 2017: -7.9%
- September 2020: -7.5%
- September 2021: -7.0%
That works out to an average pullback of about -5.9%. In this sample, there were no exceptions.
October was positive in every case, with average gains around 44% to 46%
The next leg of the sequence is what has attracted most of the attention. After each green August and red September combination listed above, Bitcoin posted a strong positive return in October:
- October 2013: +67.3%
- October 2017: +47.9%
- October 2020: +28.0%
- October 2021: +39.9%
The article puts the average October gain at roughly 44% to 46%. It also notes that slight differences across data providers come from how closing prices are calculated.
That has led some market participants to frame the sequence in simple terms: a positive August has historically been followed by a relatively contained September pullback and then a stronger October rebound.
August 2026 has nearly locked in a positive month, but the sample remains small
As of publication, Bitcoin’s gain for August 2026 was close to 25%, with the price rising from about $63,000 at the end of July to the current $78,000 to $79,000 range. The report says that puts this month on pace to be Bitcoin’s strongest August since 2017.
It also says August has historically been a weaker month overall for Bitcoin, which is why this year’s move has drawn attention to the specific August-September-October path described in the data.
The article adds a clear caution. Historical seasonality does not amount to a prediction for future price action. The full sample includes only four instances, the macro backdrop and market structure differed across those periods, and August 2026 had not yet ended when the article was published. Whether the pattern appears again will depend on actual price action in the months ahead.