

Bitcoin may be at or near a long-term cycle low, according to a Blockworks Research report that brings together five historically rare signals now flashing at the same time.
The study says Bitcoin is down 50% from its all-time high and that the current bear market has lasted more than 40 weeks. It argues that a mix of relative-strength measures, on-chain cost data and cycle timing points to a zone that has historically appeared near major lows in both price and time.
Diminishing returns change the case for passive holding
The report says Bitcoin’s price has been broadly flat since March 2021. Measured against the Nasdaq, the asset has also been largely flat since November 2017, a stretch of nearly nine years. Over that period, Bitcoin has carried much higher volatility than equities, leaving its risk-adjusted performance weaker than stock indexes.
That backdrop matters for positioning. The paper argues that the passive, always-long approach that worked in prior cycles is losing effectiveness as Bitcoin’s marginal upside and downside returns compress over time. In that framework, excess returns increasingly depend on conditional opportunities to add or reduce exposure rather than simply holding through every phase.
The indicators used in the study are designed as conditional signals. They stay quiet most of the time and tend to appear only in the tail ends of multi-year cycles, in some cases only a few times per decade. Right now, the report says, they are all pointing in the same direction: Bitcoin may be at or close to a long-cycle price low.
Signal 1: Nasdaq/Bitcoin relative strength reaches a historic extreme
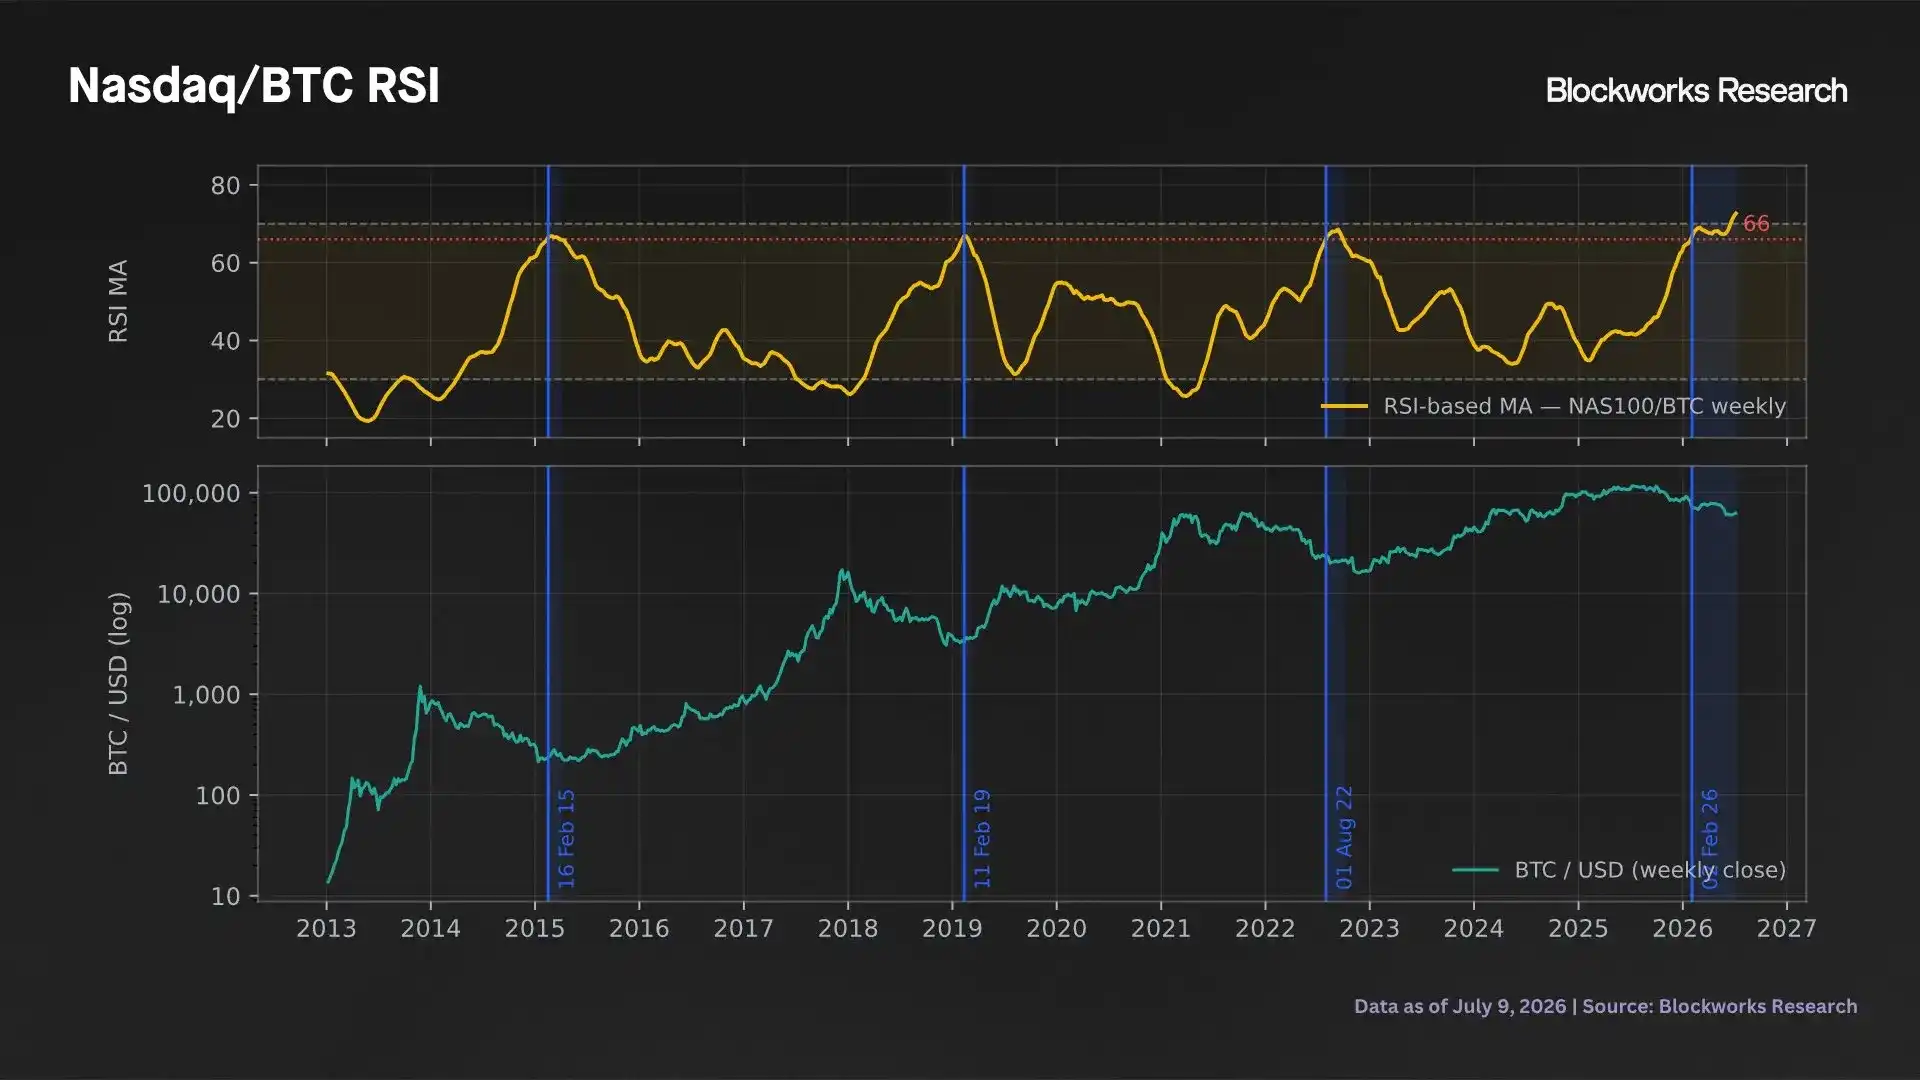
The first signal is built from the ratio of the Nasdaq 100 to Bitcoin, using weekly closes across the past 875 periods. The researchers calculate a 14-period relative strength index, or RSI, and smooth it with a 14-period simple moving average.

In this setup, a rising RSI means the Nasdaq is overbought relative to Bitcoin, while a falling reading implies the opposite. The report says this is not meant as a short-term trading signal. It is a multi-year cycle tool based on a 14-week oscillator and its 14-week moving average.
Historically, the RSI moving average has been above 65 only 5.78% of the time, and above 70 just 0.35% of the time. Those thresholds were crossed in only four periods: February 2015, February 2019, August 2022, and the current stretch that began in late January 2026 and is still ongoing.
The current reading is 72.6, the highest on record. That is 4.1 points above the previous high of 68.5 set in September 2022, and every observation above 70 has appeared within the past month. The present run has also lasted 24 weeks, the longest on record, versus 11 weeks in 2015, four weeks in 2019 and 10 weeks in 2022.
Read in reverse, the report says, this marks the most severe oversold condition ever recorded for Bitcoin relative to the Nasdaq.
Signal 2: Forward returns skew positive over one to three years
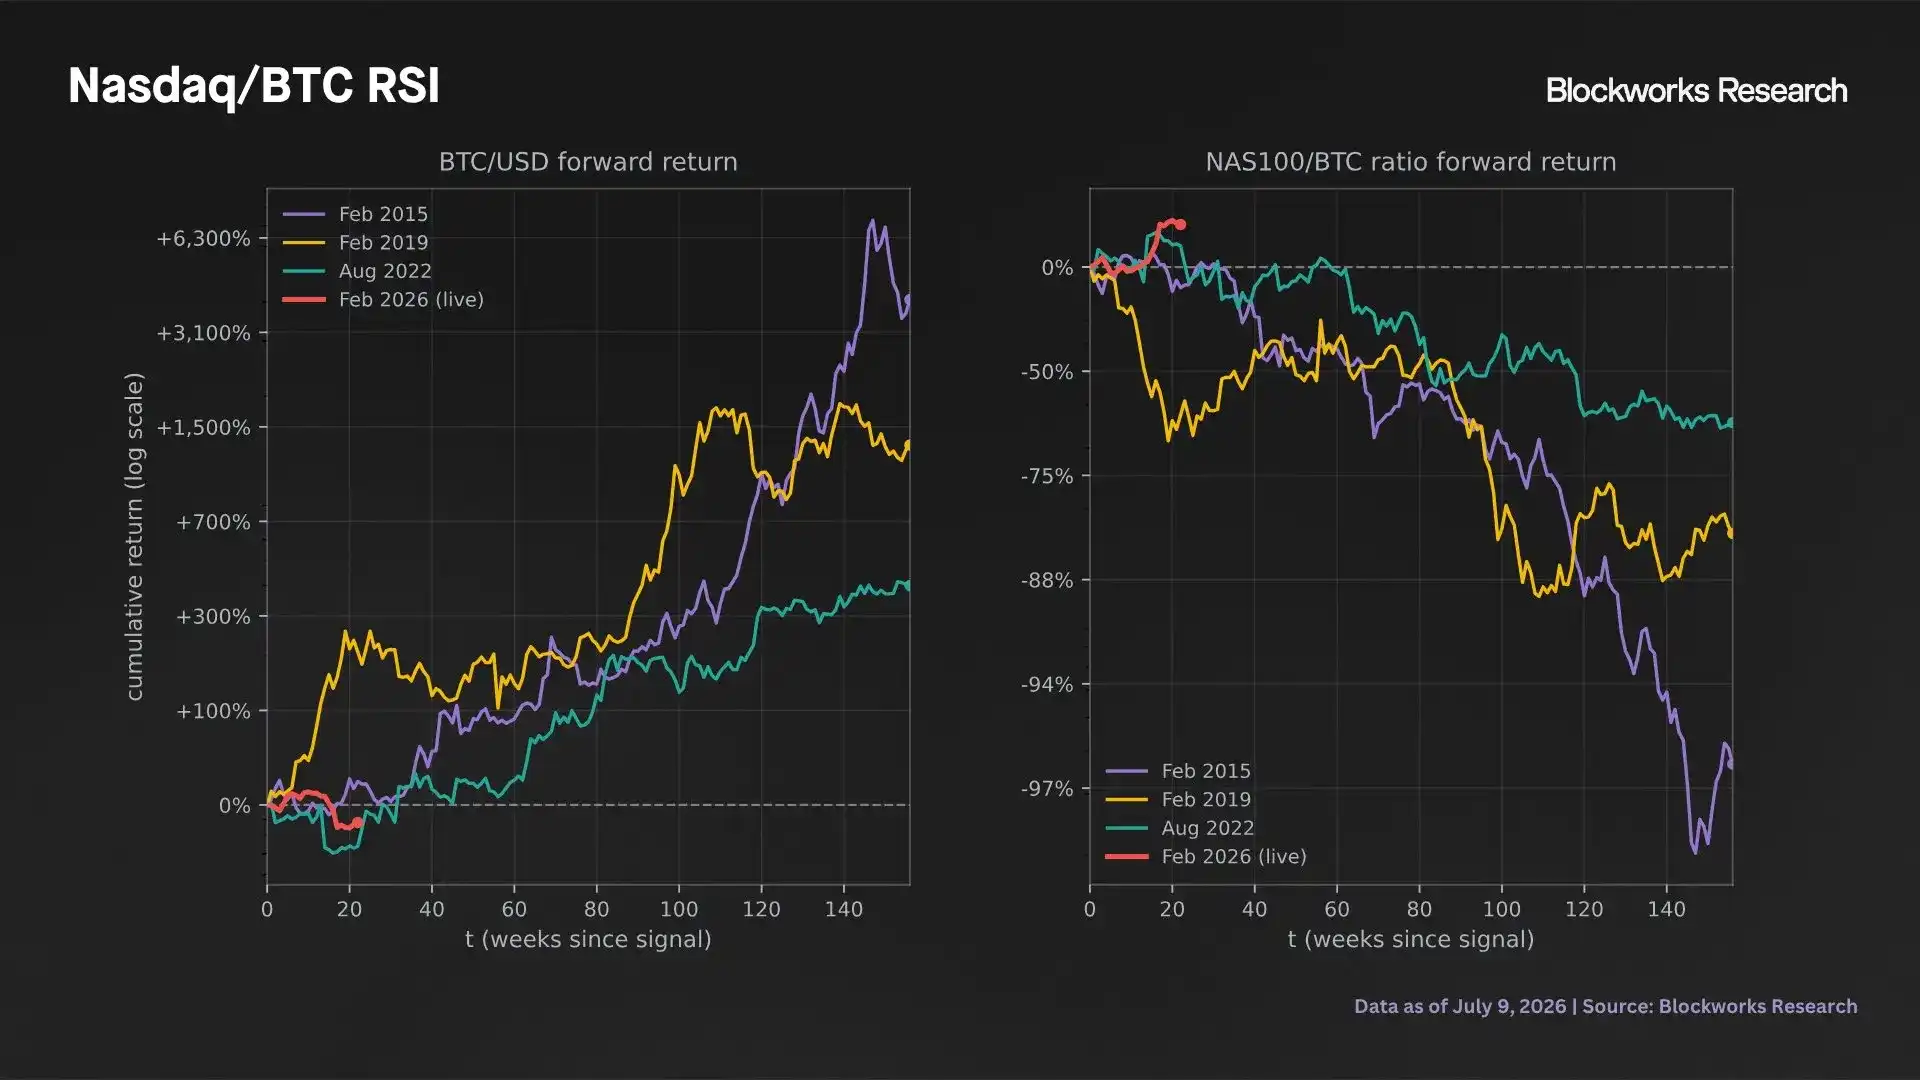
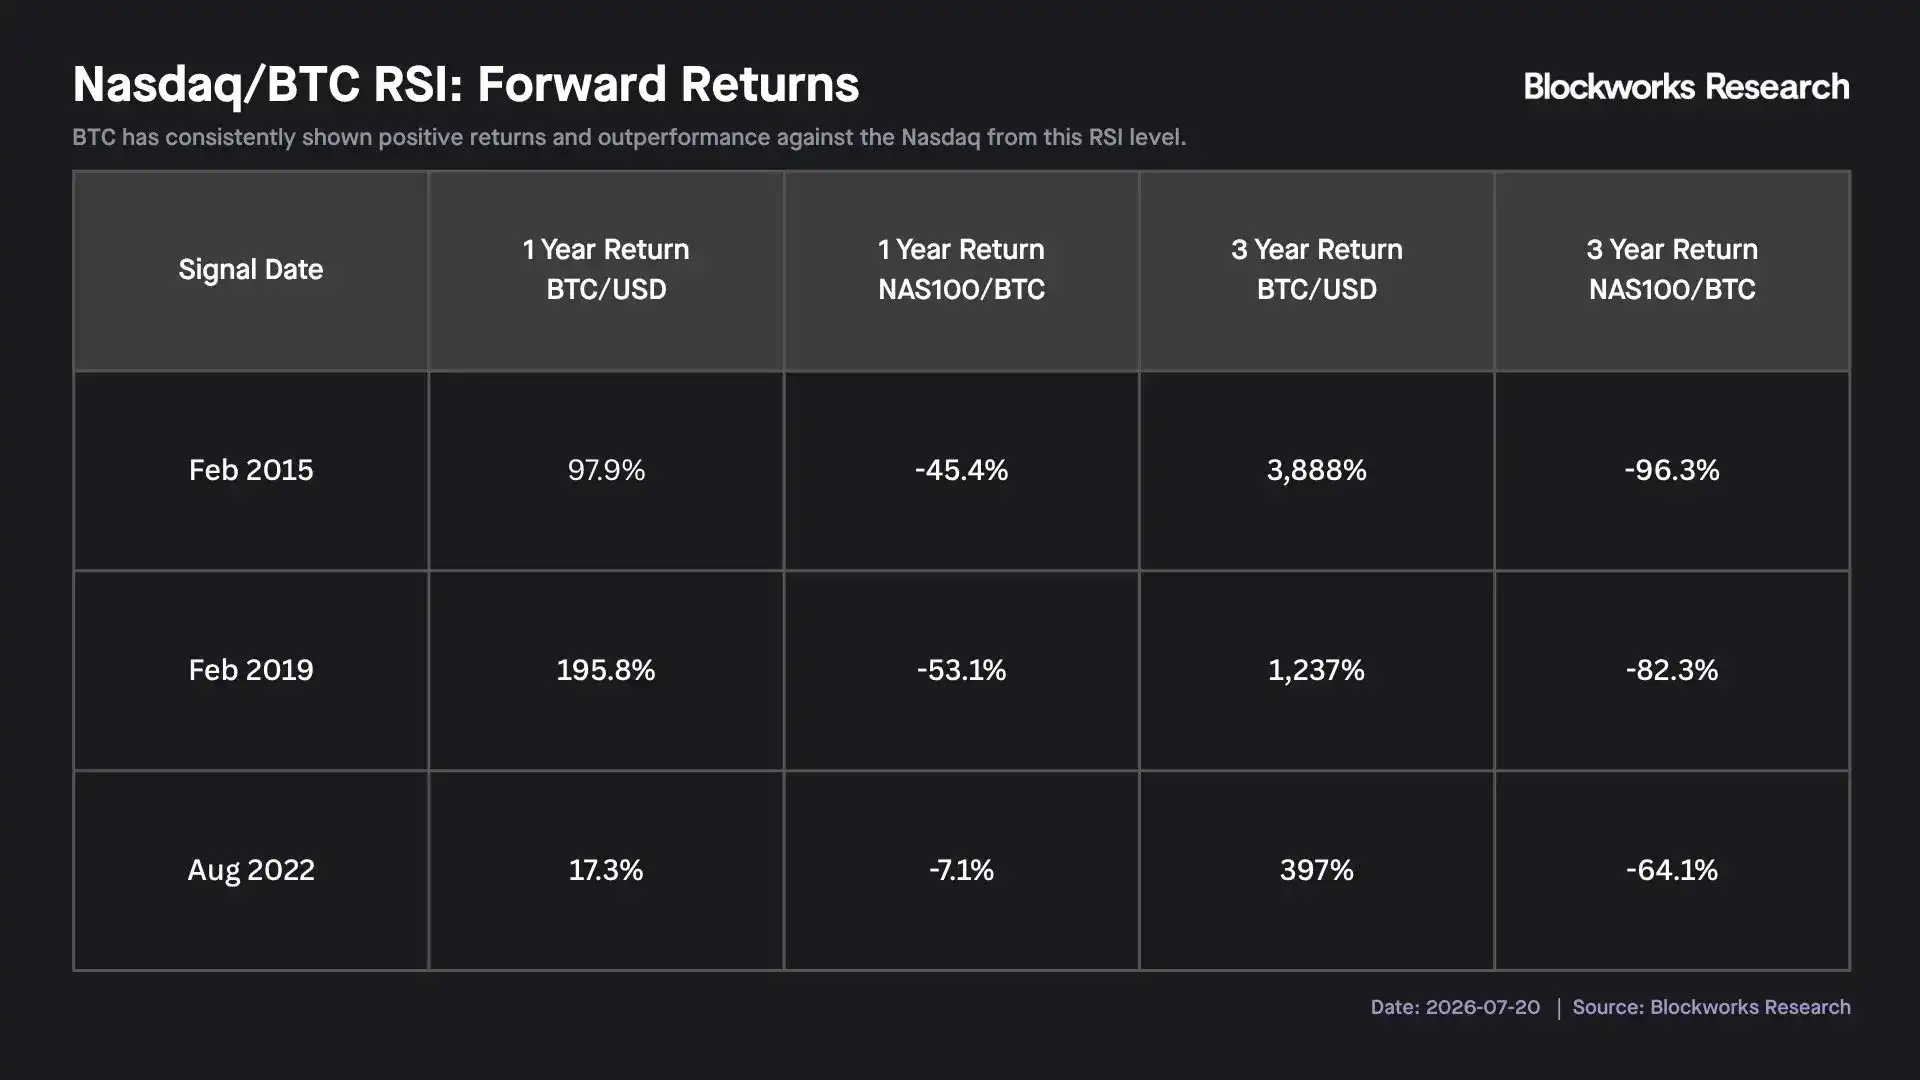
The study then looks at periods when the Nasdaq/Bitcoin RSI moved above 66. Across the three completed cases, expected return curves for both BTC/USD and BTC/NAS100 showed asymmetric upside, but mainly over longer horizons.
Short windows were far less useful. The report says 30- to 120-day returns were small and inconsistent in direction. In one example, Bitcoin fell 29.1% over 120 days after the 2022 signal, then rebounded 397% three years later. In other words, the relative-strength setup offers little guidance for the next few months, while the one- to three-year profile has looked much stronger.
The report also highlights return compression. Three-year Bitcoin gains in each cycle were roughly one-quarter to one-third of those seen in the prior cycle, matching the broader argument that marginal returns are fading. Even so, in every observed case Bitcoin outperformed the Nasdaq over the following three years.
Signal 3: Gold/Bitcoin relative strength is also at an extreme
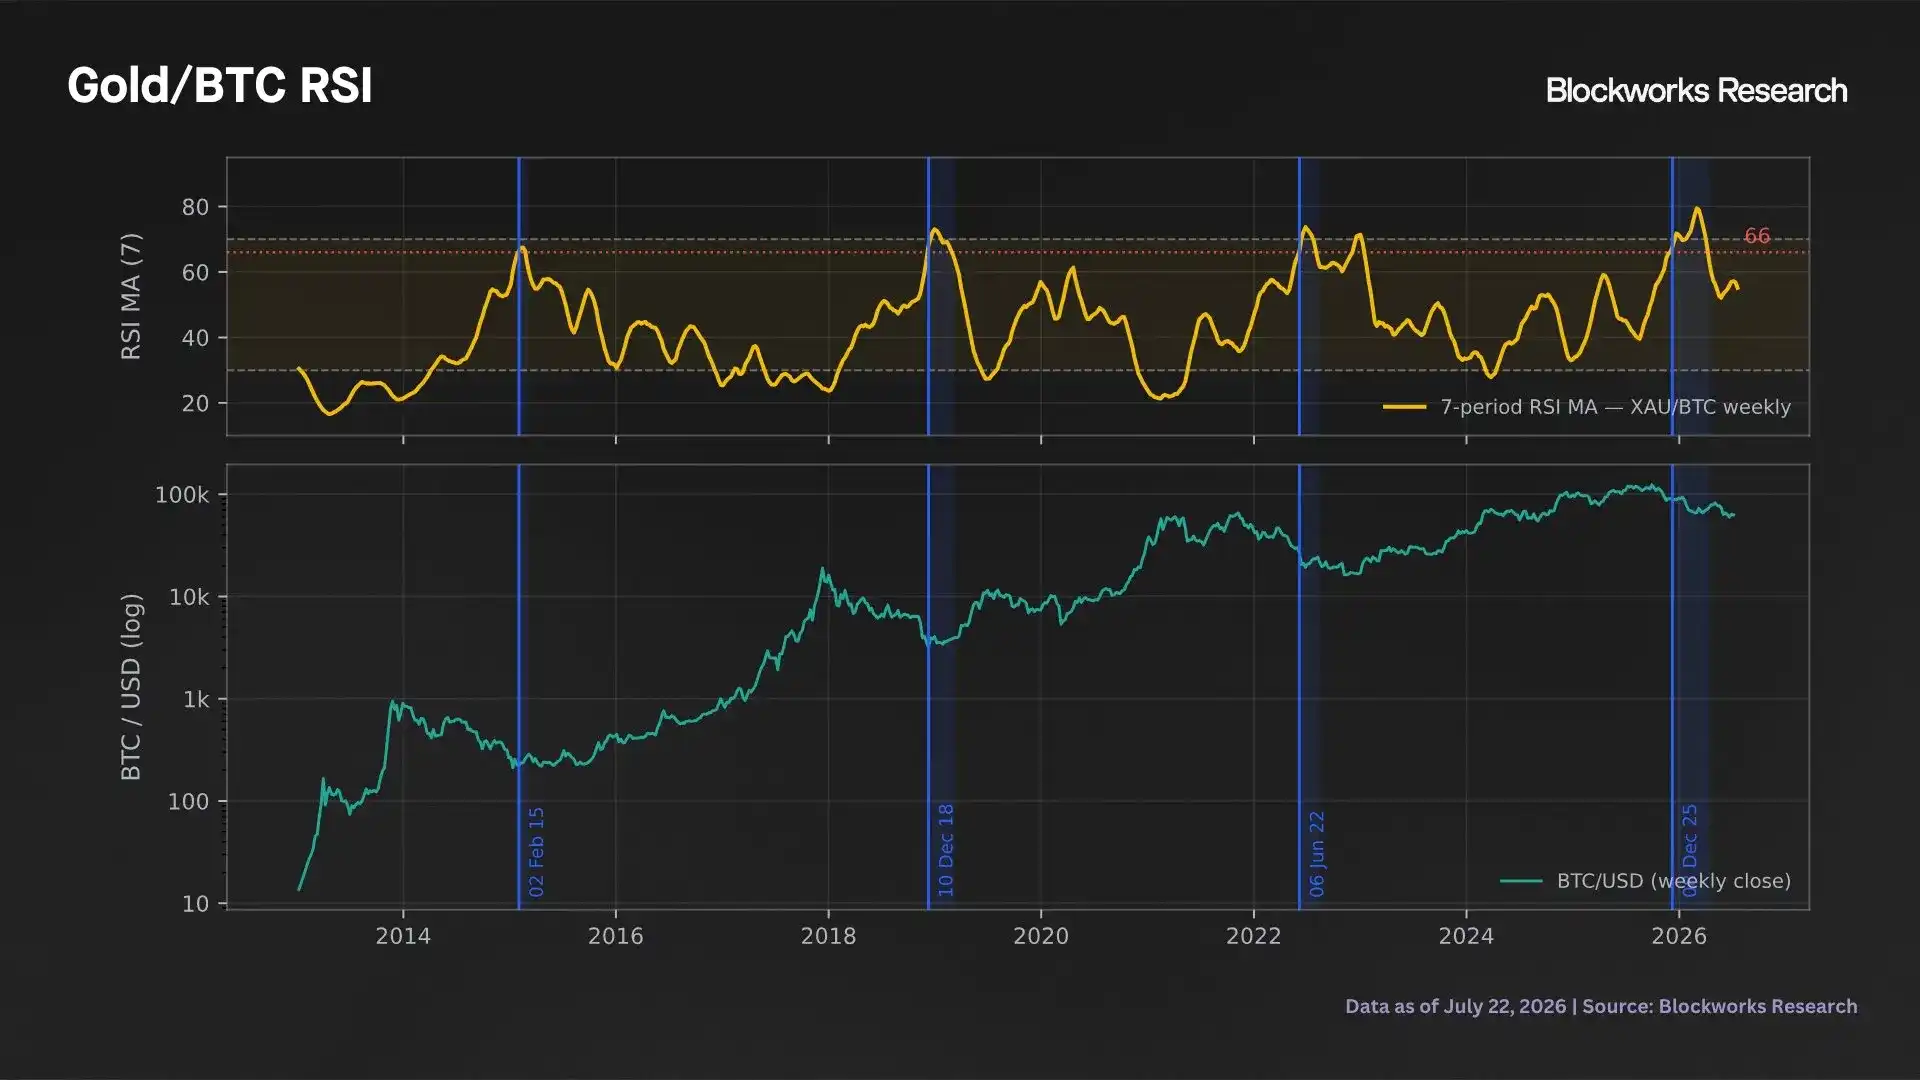
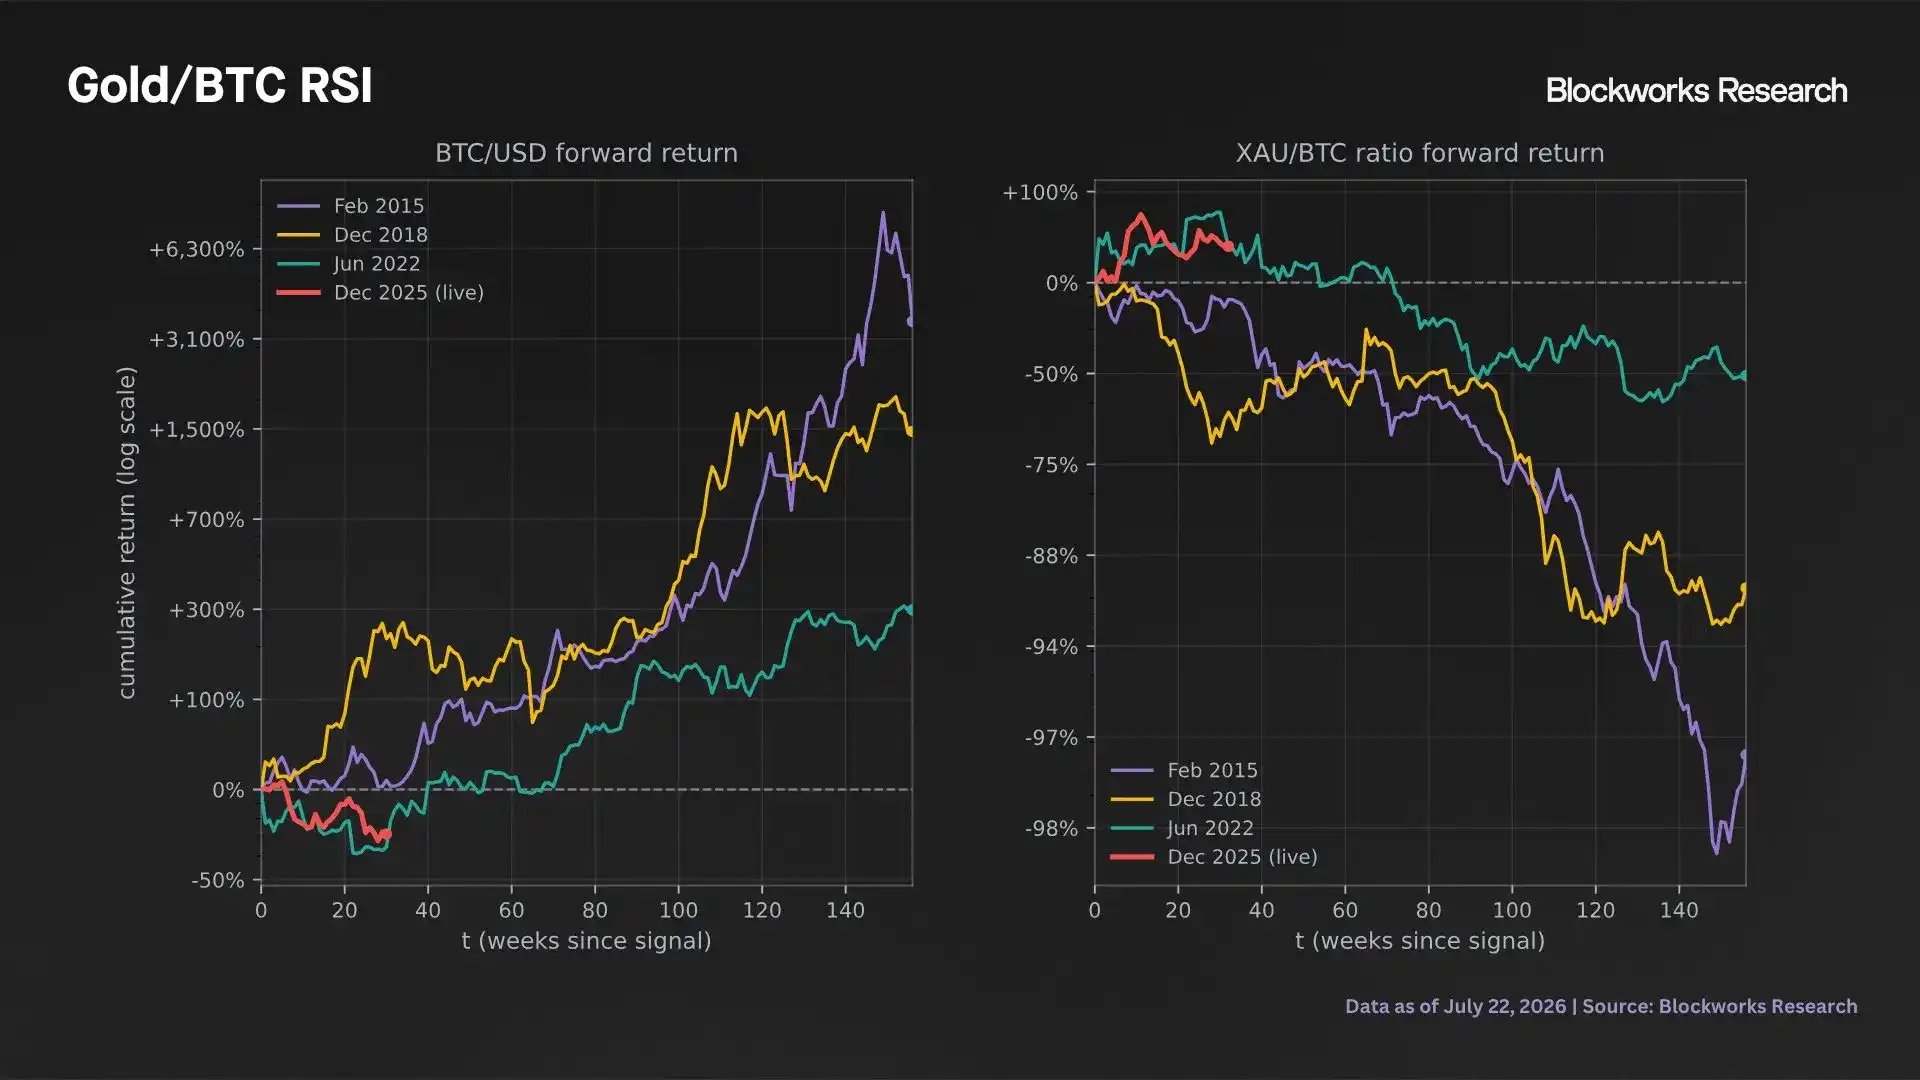
If the Nasdaq represents Bitcoin’s behavior as a risk asset, gold stands in for its role as a store of value in the report’s framework. Using a similar indicator on the gold/Bitcoin ratio, the researchers find the same pattern: readings above 66 are rare, clustered near extremes and tend to mean-revert.
By that measure, February 2026 marked the most overbought period ever recorded for gold relative to Bitcoin. The report says elevated RSI readings in this pair have typically appeared alongside long-cycle lows in Bitcoin’s price.
The forward return curves look similar to the Nasdaq study. Starting from such extreme RSI conditions, Bitcoin historically outperformed both gold and the U.S. dollar over the following one to three years.
Signal 4: Spot is nearing realized price, Bitcoin’s on-chain cost basis
The fourth signal is Bitcoin’s realized price, which estimates the aggregate on-chain cost basis of the circulating supply. Unlike spot price, which reflects the current market value, realized price measures the average price at which existing coins last moved on-chain and is used here as a proxy for deeper value.
Realized price currently stands at $53,000, about 18% below spot, according to the report. Historically, Bitcoin spot traded below realized price only 12% of the time.
The study describes realized price as a benchmark rather than a hard floor. Every past bear-market low saw Bitcoin trade below it, and once price entered that zone it often fell further before finding a bottom. In that sense, a move to or below $53,000 would fit prior cycle behavior rather than break from it.
From the first weekly close below realized price in each cycle, the next 150 weeks produced substantial positive returns in the historical data. The magnitude fell from cycle to cycle, but the direction remained the same.
The report adds that the first close below realized price has historically signaled the late stage of a bear market, not the beginning or middle. It also notes that the multiple of spot price over realized price has fallen sharply from a prior peak of 2025x, suggesting lower market risk than before.
Signal 5: The cycle clock points to week 60
The fifth signal is simpler. It maps the historical structure of Bitcoin bear markets in both price and time.
In the 2013, 2017 and 2021 cycles, major lows tended to form around the 60th week after the all-time high. The current cycle is at week 40, with a 50% drawdown, which the report says broadly matches the prior three bear-market paths. If the week-60 pattern holds again, the low would land around late November 2026.
The paper says that even with extreme RSI readings already in place for Nasdaq 100/Bitcoin and gold/Bitcoin, the current drawdown still fits the historical path.
It also notes that each cycle has taken less time to reclaim the previous all-time high. If that pattern continues, a new high should arrive within 120 weeks of the last peak, implying a fresh all-time high before February 2028.
The researchers are careful here. These observations do not explain why the cycle behaves this way, and they are based on only a handful of historical episodes. The report treats them as time anchors layered on top of the conditional signals above, not as a mechanism. Under that framing, Bitcoin may be roughly 20 weeks away from a low, or it may already have bottomed.
What the next three years could look like
The report then lays out a set of possible three-year paths. It does not present them as a forecast. Instead, it asks a narrower question: if the current setup resolves in a way similar to earlier episodes, where could Bitcoin’s price go?
To build those paths, the researchers assume diminishing marginal gains and losses, keep a discount to realized price in place, and reference the historical drawdown path in both price and time. Each path is taken from a three-year stretch that followed one of the prior signals, then scaled down by factors ranging from 0.33 to 0.80 to reflect cycle-by-cycle return compression.
The shaded bands in the chart mark the boundaries of those scaled historical distributions, not the full range of possible market volatility. The report says the bands are simply smaller versions of prior paths after similar signals, and they exclude outright signal failure.
Within that framework, returns by the end of 2026 may still vary. By 2027 and 2028, however, the distribution shifts clearly toward positive, asymmetric upside. That is why the paper says the coming quarters could offer an attractive window for long-term Bitcoin accumulation.
Risks and limits
The report spends considerable time on caveats. None of the indicators should be read as a causal mechanism for a cycle low, it says. They are recurring features that happened to appear near long-cycle bottoms in the historical record.
The sample size is also small. The RSI moving-average work covers four independent cycles, one of which is still unresolved. The realized-price analysis uses four cycles, while the cycle-symmetry work relies on the first three completed cycles. With samples this limited, a single major deviation would materially weaken the relationships shown in the study.
The report also argues that these signals are not independent confirmations. RSI extremes, proximity to realized price and the cycle clock are, to a large extent, different ways of measuring the same underlying fact: Bitcoin has suffered a large, extended drawdown. In any deep and persistent selloff, each of these measures should move toward an extreme, so their overlap does not necessarily create separate evidence.
Structural change is another risk. The current cycle is the first with ETF holdings, large-scale corporate ownership and a more developed derivatives market that includes options and perpetual futures. The familiar four-year cycle may ultimately prove to be just a description of four observations rather than a durable feature of the asset.
Finally, RSI is a relative signal. Bitcoin can outperform the Nasdaq or gold when both assets are rising, but it can also outperform because the other asset is falling faster or holding up better in relative terms. Even if the RSI setup favors Bitcoin, a drop in stocks or gold from current highs could still pull Bitcoin’s nominal price lower. The report says plainly that these signals have almost no predictive power for moves before November and mostly describe the asymmetry of returns over the next one to three years.
Bottom-line view
Taking the indicators together, the report’s conclusion is that Bitcoin may be at or near a cycle low, with that low potentially forming before year-end and an uptrend resuming afterward.
Each signal is near a historically rare extreme, and in prior cases those conditions were followed by strong multi-year Bitcoin returns and outperformance against stocks. If the ultimate low is not in yet, the stretch between now and that low could still mark an attractive long-term reaccumulation zone.
That is the core message of the research: these long-cycle indicators are quiet most of the time, but they are now flashing green together.