

Bitcoin rebound stays in place, but the larger structure remains weak
Odaily said its two main calls from last week were broadly confirmed by price action. The first was that Bitcoin had entered a daily-chart oversold rebound phase and that the height of that rebound would shape the next market move. The second was that HYPE had a high probability of correcting near “endpoint 61,” or $72.97. Since then, BTC has completed the expected multi-leg rebound into a key resistance area, while HYPE was rejected near $72.97 and at one point recorded a maximum decline of 9.39%.
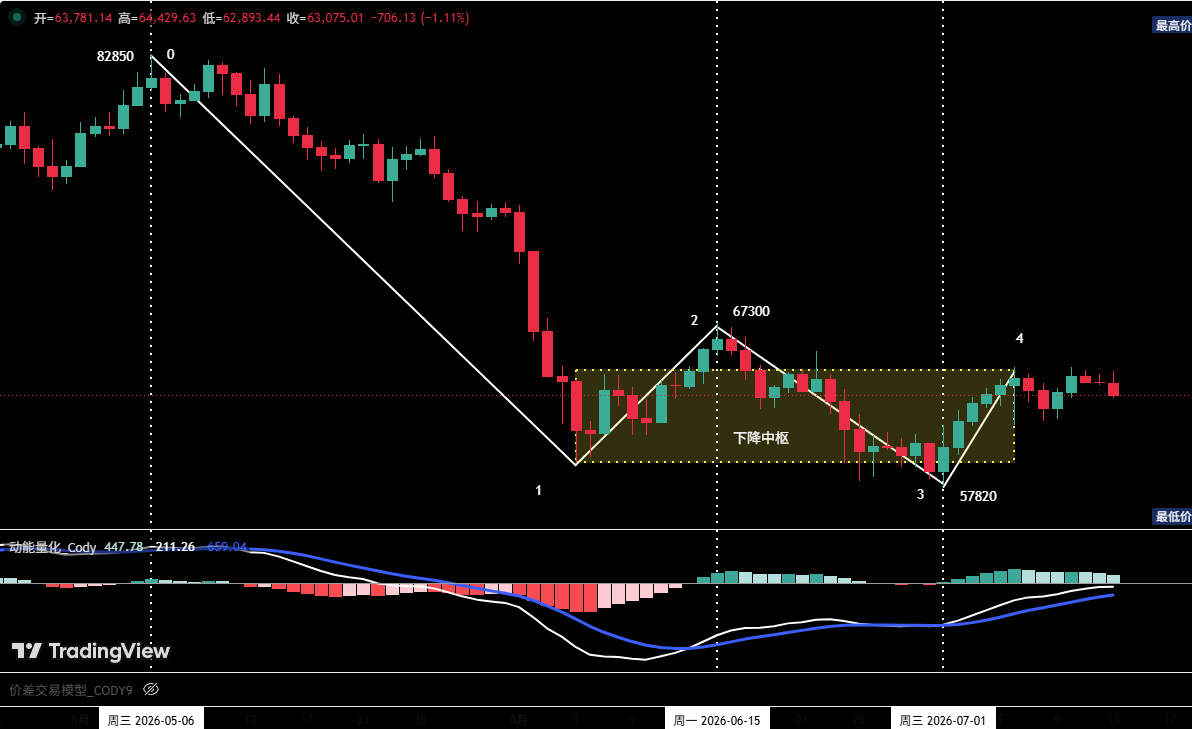
On the daily chart, the report breaks Bitcoin’s decline from the May 6 high of $82,850 into four legs: (0-1), (1-2), (2-3), and (3-4). After touching a low of $57,820 on July 1, BTC moved into the (3-4) rebound leg and has already pushed through resistance at $64,500. The analysis says that if this rebound first clears $64,500 and then $65,700, ideally, the odds would increase that once the (3-4) rebound ends, Bitcoin could stabilize above the $57,820 low and produce another rebound from there.
The same report says the overlap among the (1-2), (2-3), and (3-4) moves has started to form a descending consolidation zone on the daily timeframe. Under that framework, the market would more likely move into an extension phase made up of five or more overlapping segments, which points to short-term choppy consolidation rather than a clean trend reversal.
BTC this week: resistance at $64,700, support near $61,500
On the 4-hour chart, Odaily divides the rebound from the July 1 low of $57,820 into three legs: (44-45), (45-46), and (46-47). It says the market is now in the (46-47) rebound segment.
As price printed local high “endpoint 47,” the outlet said its in-house momentum quant model showed a bearish divergence, while its spread-trading model flashed a top warning signal. That setup, in its view, leaves a high probability of a technical correction on the intraday timeframe. If BTC does pull back, the report says traders should watch support near “endpoint 46.” If the market stabilizes there, the next rebound could target $65,700 first, with $67,300 as the next level if momentum is strong enough.
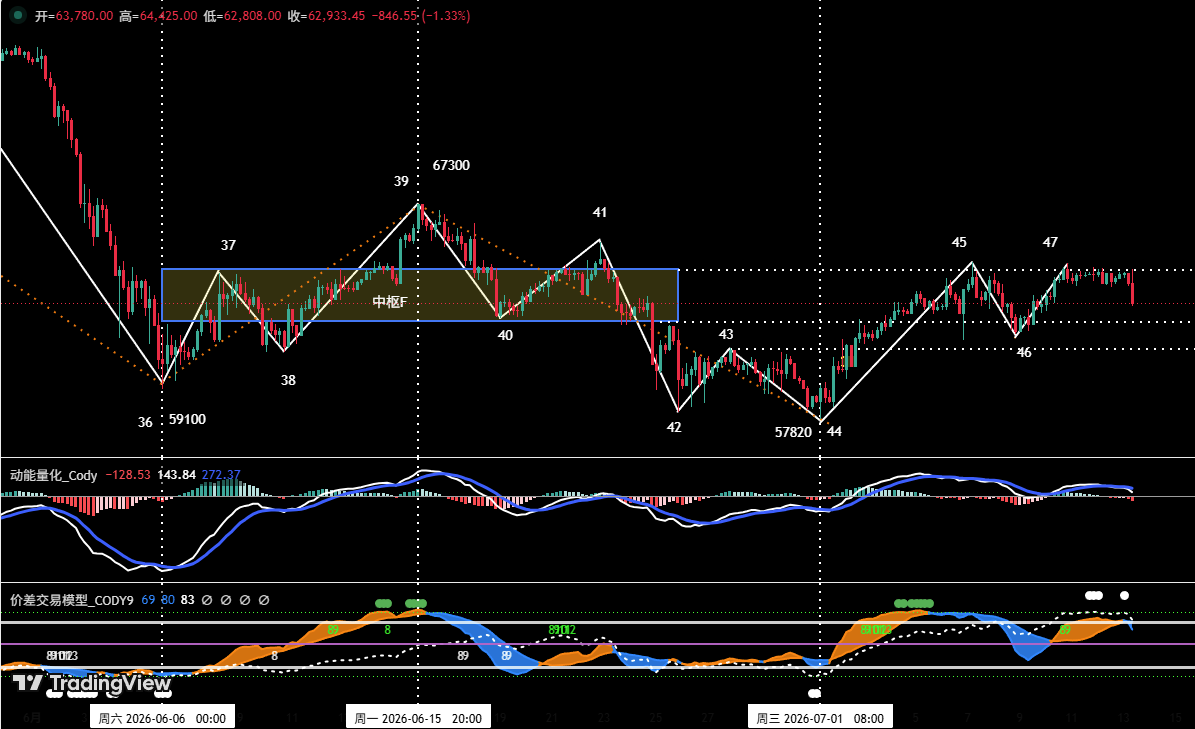
For the week of July 13 to July 19, the report says the main level to watch is resistance at $64,700. If a pullback develops as expected, support near $61,500 becomes the key test because its effectiveness would determine whether the rebound can continue.
The report lists the following resistance zones for BTC:
- First resistance: around $64,700
- Second resistance: $65,700 to $67,300
- Third resistance: $69,500 to $71,000
Its support levels are:
- First support: $60,950 to $62,000
- Second support: near $57,820
- Third support: near $55,000
Positioning: medium-term short at about 20%, with three short-term setups
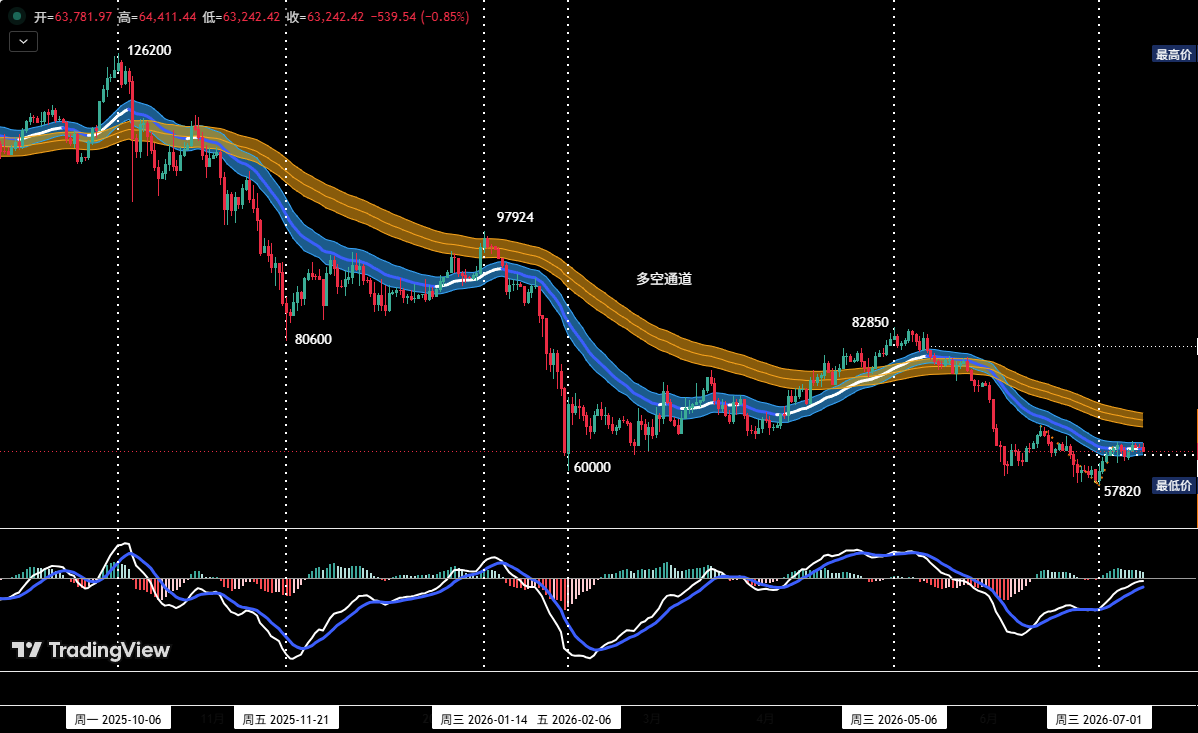
In the medium-term strategy section, Odaily says its position-monitoring model shows BTC has already broken below the bull-bear channel, confirming a market structure led by bears. Based on that reading, the report keeps medium-term short exposure at about 20% for now. If Bitcoin rebounds into the $65,700-$67,300 area, then shows signs of stalling and the quant model prints a top signal, short exposure could be raised to no more than 50%.
For short-term trading, the report suggests using 30% of capital, setting stop-loss orders, and looking for spread-trading opportunities around the named support and resistance levels on 30-minute and 60-minute timeframes. It lays out three scenarios.
- Plan A: If BTC pulls back from around $64,700 and shows signs of stabilization in the $60,950-$62,000 area, with a bottom signal from the quant model, aggressive traders could build a long position of about 15%.
- Plan B: If BTC rebounds into the $65,700-$67,300 zone, then meets resistance while the quant model flashes a top signal, traders could build a short position of about 30%.
- Plan C: If BTC breaks above $65,700 and then pulls back, and later stabilizes above the previous low of $57,820 with a bottom signal from the quant model, traders could build a long position of about 30%.
Each plan calls for an initial stop-loss and gradual profit-taking near major resistance or support levels, depending on model signals.
HYPE rejected at $72.97, with its 4-hour uptrend structure weakened
The HYPE section is built around the 4-hour chart. Odaily says the move from the June 25 low of $58.5, labeled endpoint 54, to the July 7 high of $72.97, labeled endpoint 61, can be divided into a seven-leg advance. Within that structure, the 55-56, 56-57, and 57-58 segments overlap to form what the report calls an upward consolidation zone.
In the prior weekly report, Odaily had warned that the seven-leg rise from endpoint 54 to endpoint 61 had already run its course and that top warning signals had appeared at endpoint 59 and endpoint 61. It said that raised the risk of a short-term correction. The market then turned lower near $72.97 as expected, and the decline during the (61-62) correction reached about 9.39% at its deepest point.
According to the latest update, HYPE remains in the (61-62) correction leg. The report adds that “endpoint 62” has already broken below the previous low at “endpoint 60,” or $68.16, which it sees as an initial break in the rising structure that started from endpoint 54.
HYPE this week: can any rebound clear $72.97?
The report places HYPE resistance at $68-$69.5, near $72.97, and near $76.94. Its support levels are near $65.5 and in the $60.5-$61.5 range.
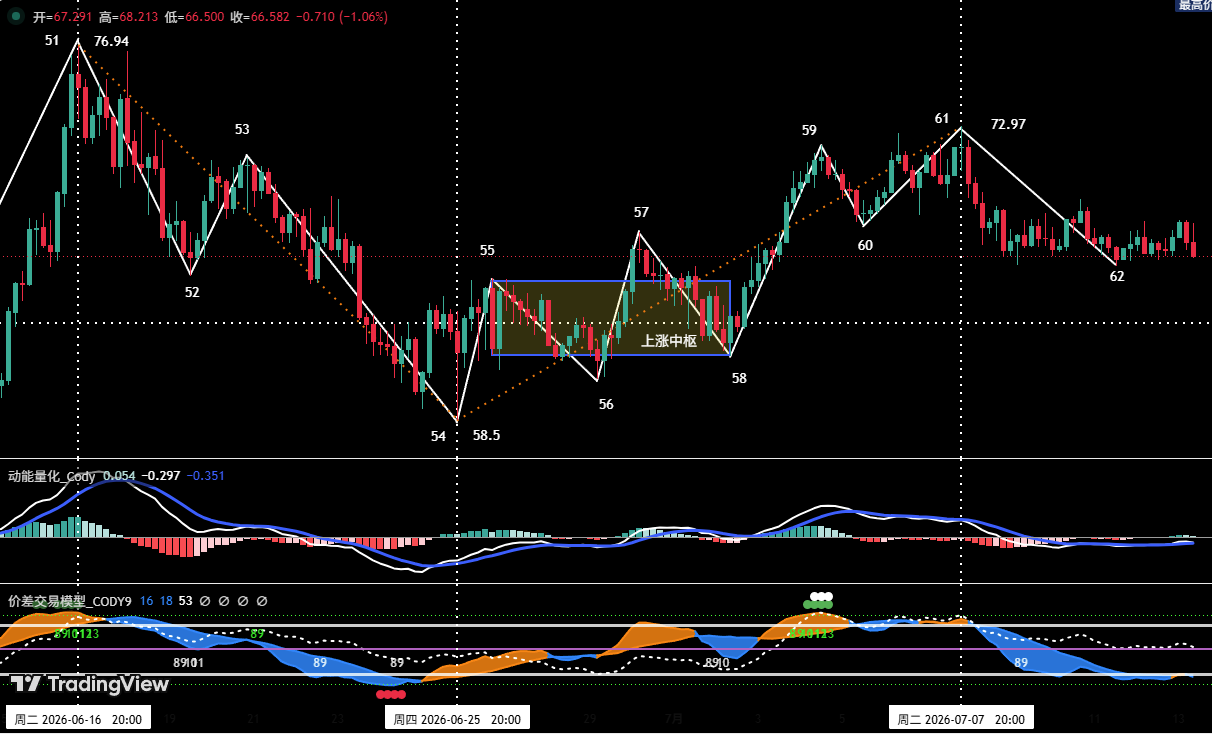
For this week, the report says the main focus is where endpoint 62 finishes and whether the next rebound can break through resistance at $72.97.
It gives two short-term scenarios. If the (61-62) correction ends and price rebounds above $72.97, the report suggests staying flat because HYPE would already be close to the strong resistance area near its all-time high of $76.94. If the correction ends but the rebound cannot reach $72.97, the report recommends building short exposure on strength, keeping position size within 30% and using strict stop-loss rules.
Risk control rules
The report says traders should set an initial stop-loss immediately after opening a position. Once profit reaches 1%, the stop should be moved to entry price. Once profit reaches 2%, the stop should be moved to the 1% profit level. After that, for every additional 1% gain, the stop should be raised by 1% as well.
Odaily adds that all views, model readings, and trading strategies in the report come from personal technical analysis and are intended only as a personal trading log. It says the content does not constitute investment advice or a basis for trading decisions.