

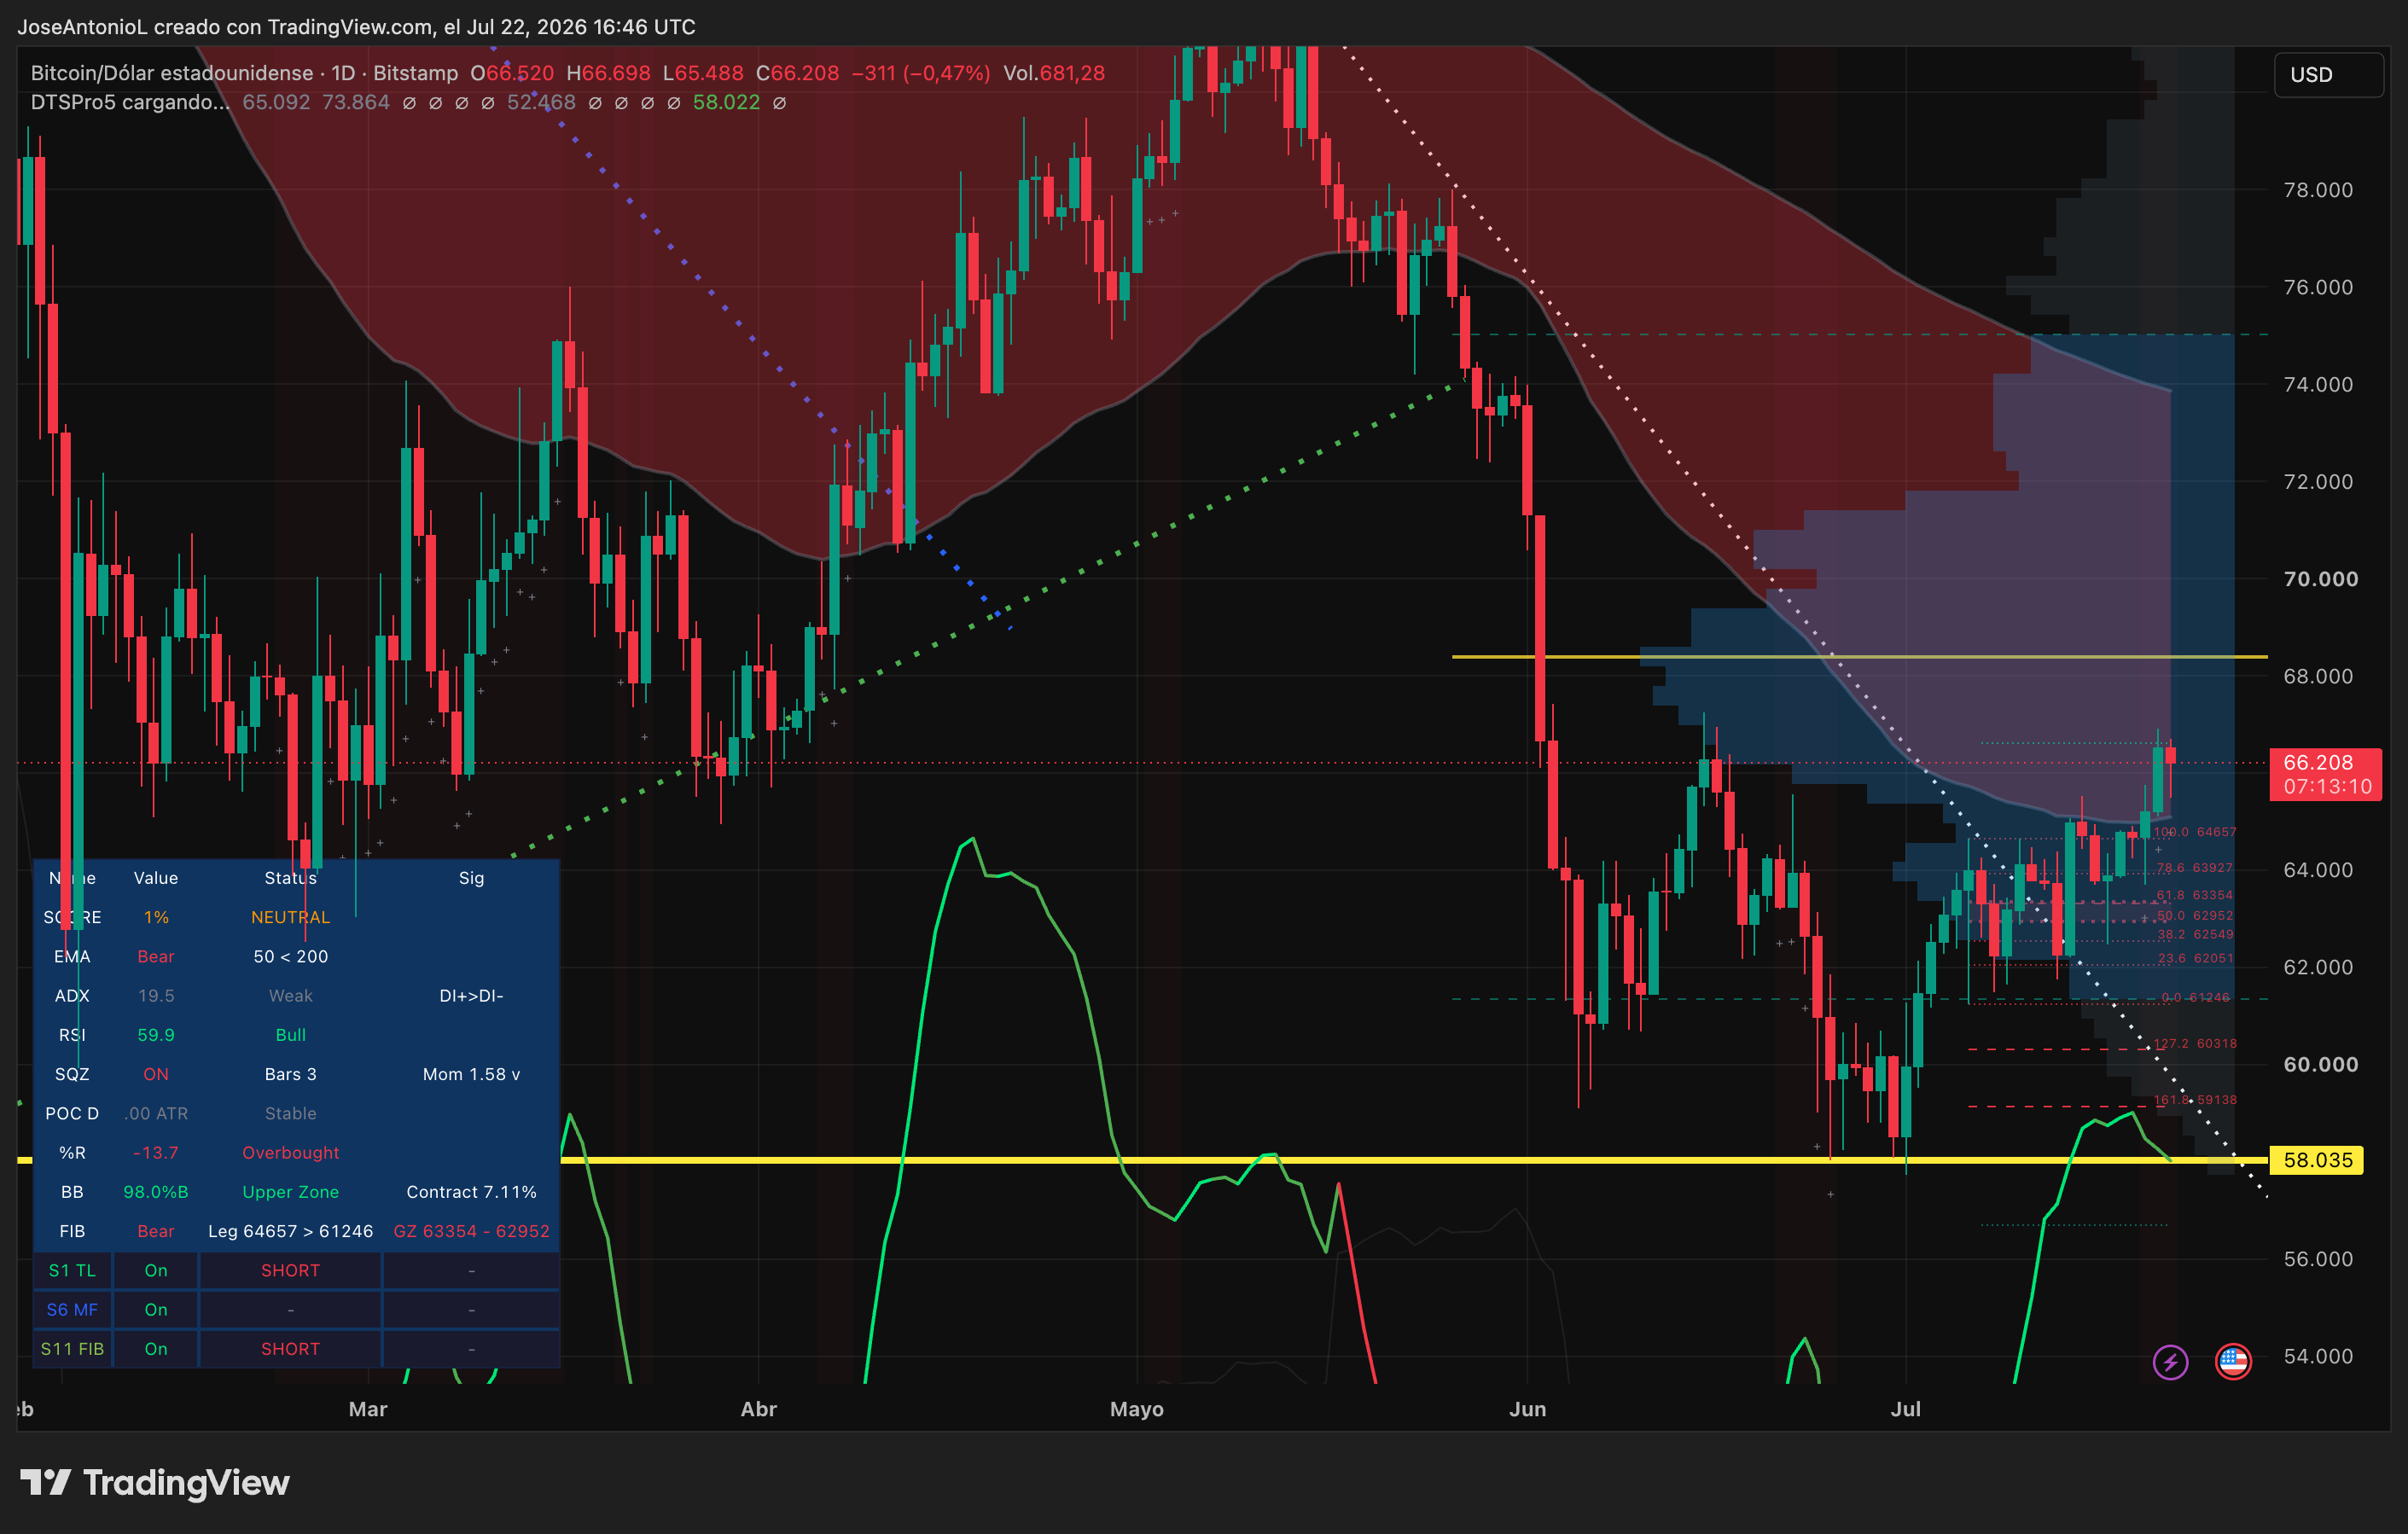
Bitcoin has bounced back into focus this week, trading at $66,347 on Wednesday afternoon after recently testing lows near $58,000. The recovery has given traders at least one encouraging signal: the 200-period exponential moving average has held as support. At the same time, the death cross that had drawn attention on the chart appears to be narrowing slightly, prompting fresh discussion about whether it could eventually give way to a golden cross in the coming months.

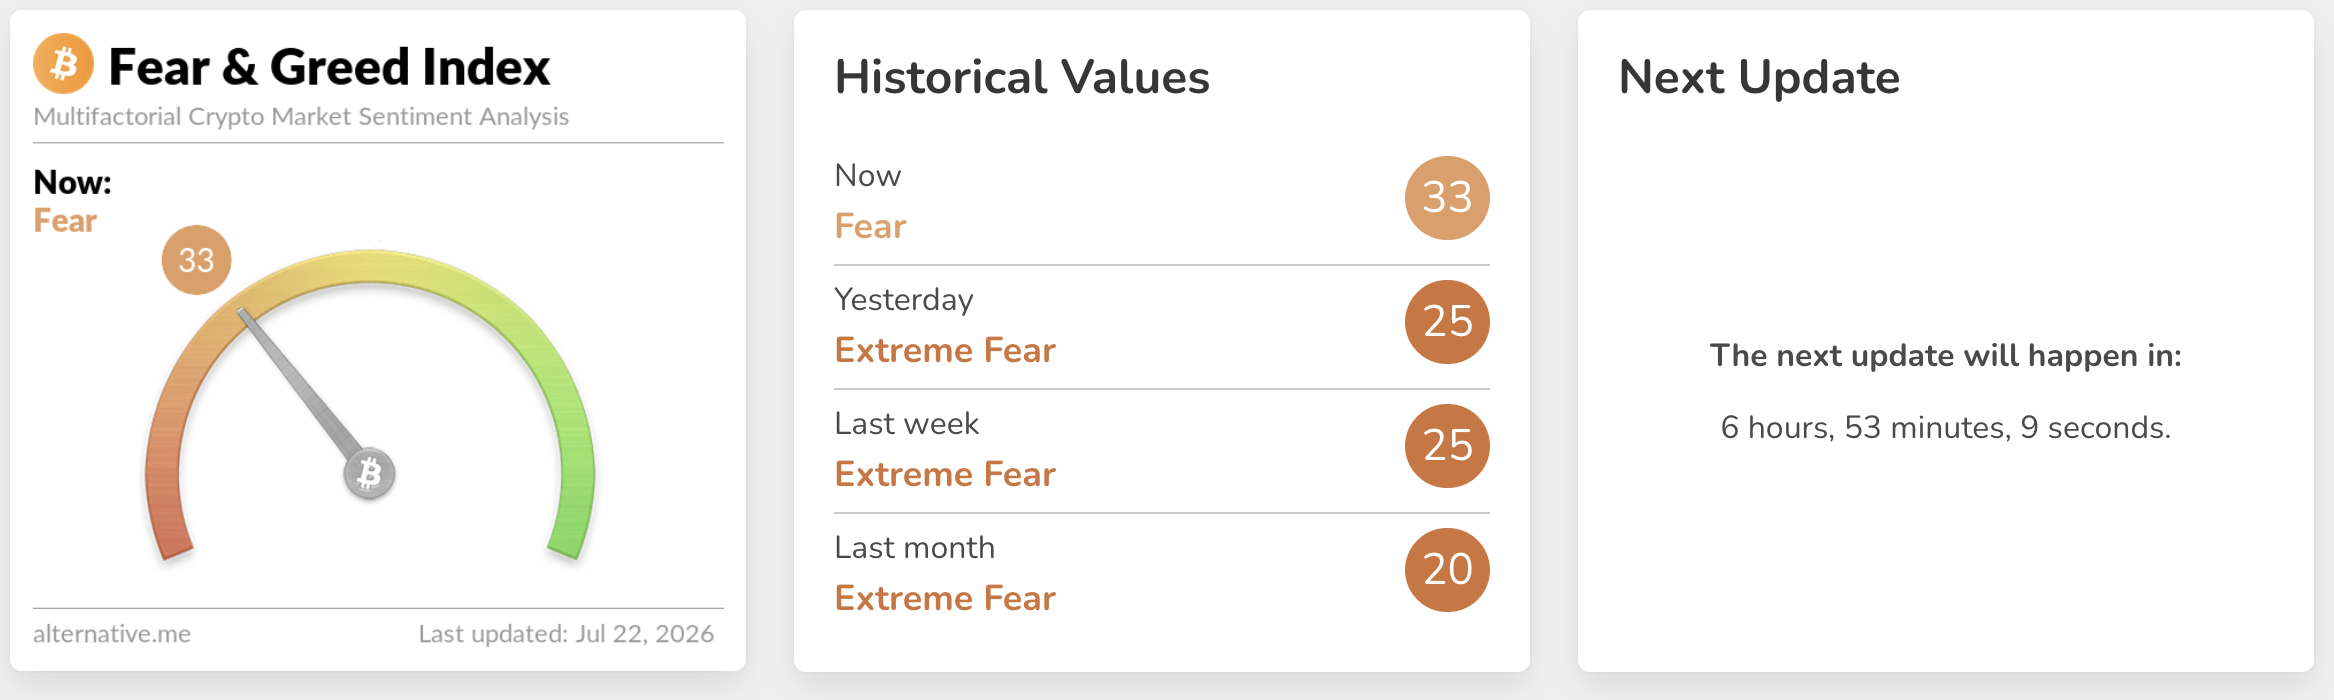
That rebound is landing in a market that still lacks a clean macro direction. U.S. stocks opened mixed on Wednesday as investors waited for major earnings from Alphabet and Tesla. The S&P 500 slipped 0.16% at the open and the Nasdaq fell 0.56%, with Wall Street showing caution ahead of results tied to AI spending. The Crypto Fear & Greed Index stood at 33, a reading that points to caution, not panic.
Bullish and bearish forces are pulling in opposite directions
Two separate forces are shaping Bitcoin’s setup right now.
On the bullish side, Treasury Secretary Scott Bessent told lawmakers that the Clarity Act is at the “1-yard line.” The bill, which has been stalled for an extended period, is designed to resolve the jurisdiction dispute between the Securities and Exchange Commission and the Commodity Futures Trading Commission over crypto market oversight. Bessent urged Congress to pass it before the August 7 recess.
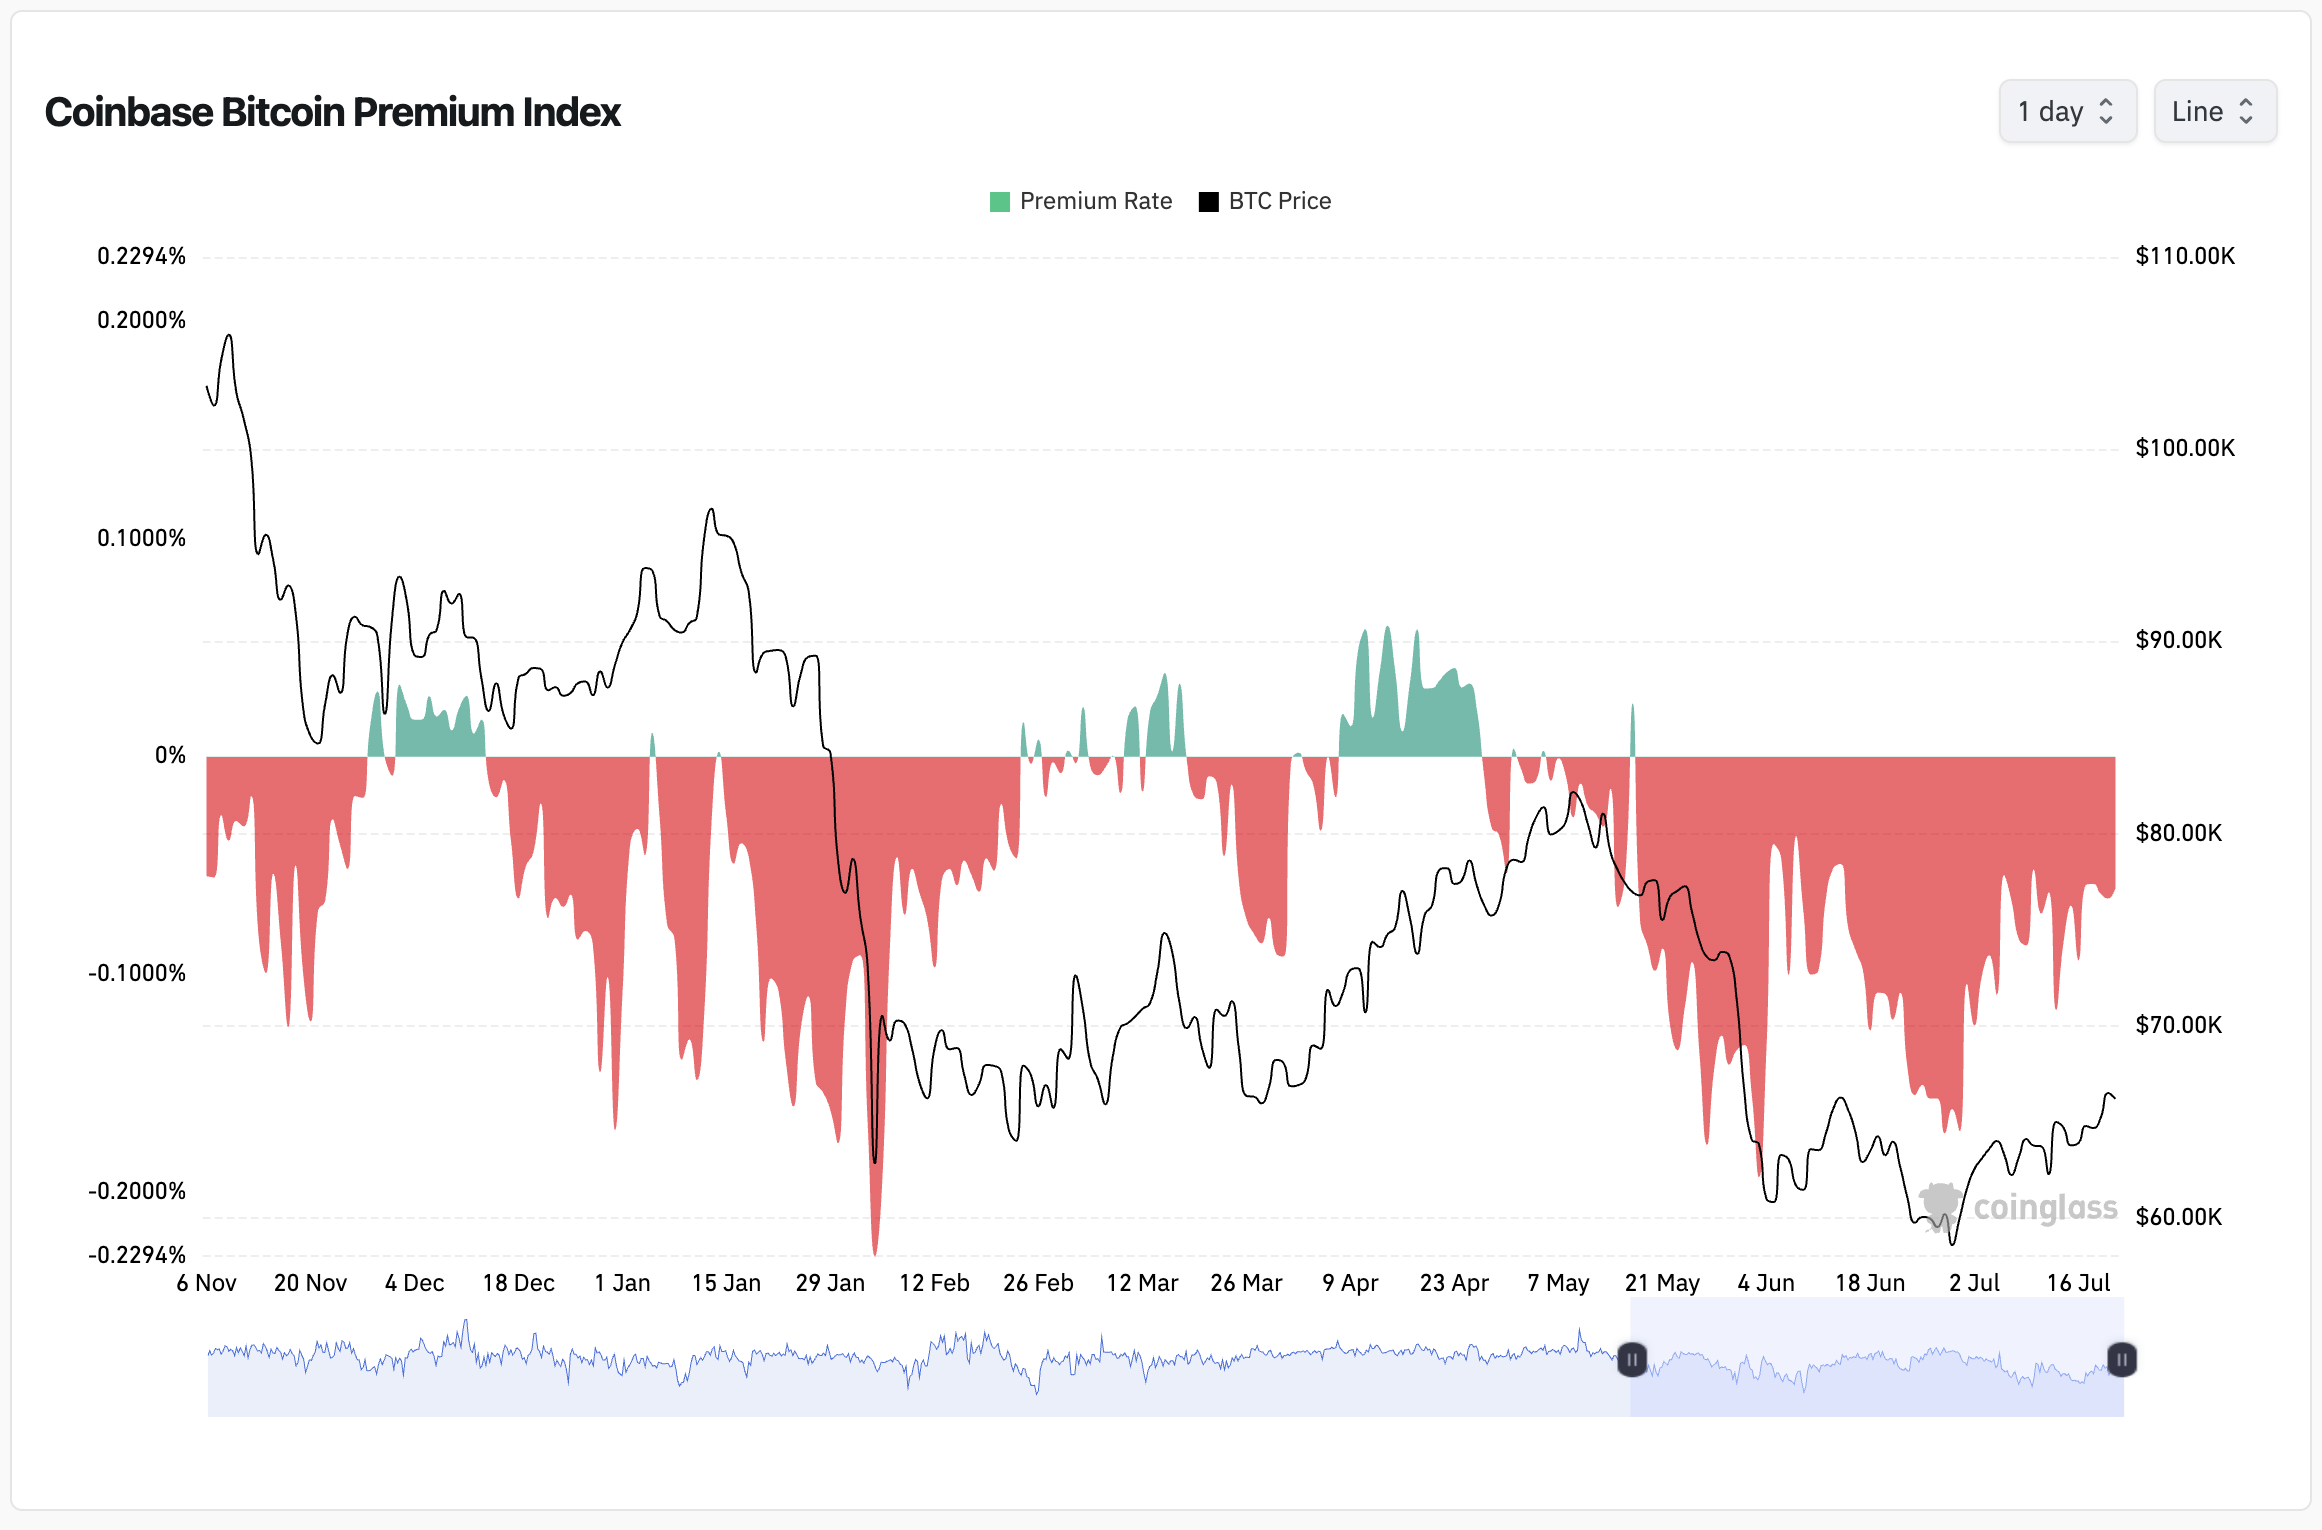
On the bearish side, the Coinbase Premium Index has remained negative since May. The indicator tracks whether U.S. institutional buyers are paying a premium relative to global retail prices. Decrypt reported last week that Capital.com senior market analyst Daniela Hathorn viewed that persistent weakness as “a broader bout of risk aversion rather than a deterioration in crypto-specific fundamentals.” In practical terms, the pressure appears macro-driven. It does not point to panic selling, but it also does not show committed institutional buying.
July 22 price action kept the 200 EMA intact
Bitcoin’s daily candle on July 22 opened at $66,520, reached a high of $66,698, dipped to $65,488, and was trading near $66,208 at the time referenced in the report, down 0.47% on the day. The 24-hour range was relatively tight, but support around $65,000 held.
The coin then bounced from that area back toward current levels.
The exponential moving average gives more weight to recent prices, and the 200-day EMA is commonly used as a long-range trend reference. When Bitcoin drops toward that line and buyers step in, it suggests demand is present at that level. That is what the chart showed here: the 200 EMA held, and Bitcoin recovered.
Still, the broader EMA structure remains bearish. The 50-day EMA is below the 200-day EMA, which is the formation traders call a death cross. In that setup, shorter-term trend strength remains weaker than the longer-term trend. As the article explains it, long-term holders are absorbing larger losses than shorter-term holders because they entered the asset earlier at higher prices.
ADX shows movement, but not strong trend conviction
The Average Directional Index, or ADX, is at 19.5. This indicator measures trend strength on a 0-to-100 scale. It does not indicate direction; it only shows how forceful the trend is. Readings below 25 are generally treated as no-trend territory.
At 19.5, Bitcoin is clearly still in that range. There is price movement, but little momentum behind it. For traders, that is not automatically negative. Since Bitcoin has been in a bearish trend, a low ADX also suggests that the decline itself is losing strength.
RSI at 59.9 is the clearest constructive signal
The Relative Strength Index is at 59.9, making it the strongest positive reading in the current technical picture. RSI also runs on a 0-to-100 scale and is used to measure buying momentum. A reading below 30 is typically considered oversold, while a level above 70 is usually treated as overbought.
At 59.9, Bitcoin is above the neutral 50 mark and sits in bullish territory without being stretched to the point where momentum traders would typically start selling automatically. That leaves room for additional upside before the chart begins to look overheated.
Prediction market pricing points to range trading in the short term
On Myriad, the prediction market built by Decrypt parent company Dastan, traders have drawn a specific line for this Sunday. The market assigns only a 19% probability that Bitcoin will clear $68,000 by July 26 at 4 PM UTC. The $66,000 market is close to even, with a slight bullish lean at 55%.
That suggests traders, at least for now, expect the current range to hold. The view lines up with the low-ADX setup and the squeeze forming on the chart: something may be building, but the market is not yet pricing in a decisive move by this weekend.
Longer term, the Myriad market remains skeptical. Traders are pricing a 64.6% chance that Bitcoin drops to $55,000 before it rallies to $84,000. That is a meaningful majority backing the bearish path first. It matches the still-negative Coinbase Premium, the active death cross on the daily chart, and the weak ADX reading that says this rebound has not yet gained strong conviction.
The case for a breakout versus the case for another drop
The bullish case in the report rests on three points: the 200 EMA held as support, RSI remains above 50 with room to run, and the Clarity Act is closer to becoming law than it has been at any point this year.
A favorable Senate vote, according to the article, could provide the catalyst that pushes Bitcoin hard enough to trigger a short-liquidation cascade toward $70,000. Bernstein analysts are still holding to a $150,000 year-end target, while acknowledging that the current level is “ambitious in context of the market correction.”
The bearish case carries more technical weight for now. The death cross is still active. ADX at 19.5 shows there is no strong trend momentum behind the bounce. More than 900 hours of negative Coinbase Premium signals that institutions are not accumulating. The report also argues that statistically, a squeeze often resolves in the direction of the prior trend, and in this case that prior trend was down.
The article closes with a disclaimer that the views and opinions expressed by the author are for informational purposes only and do not constitute financial, investment, or other advice.