
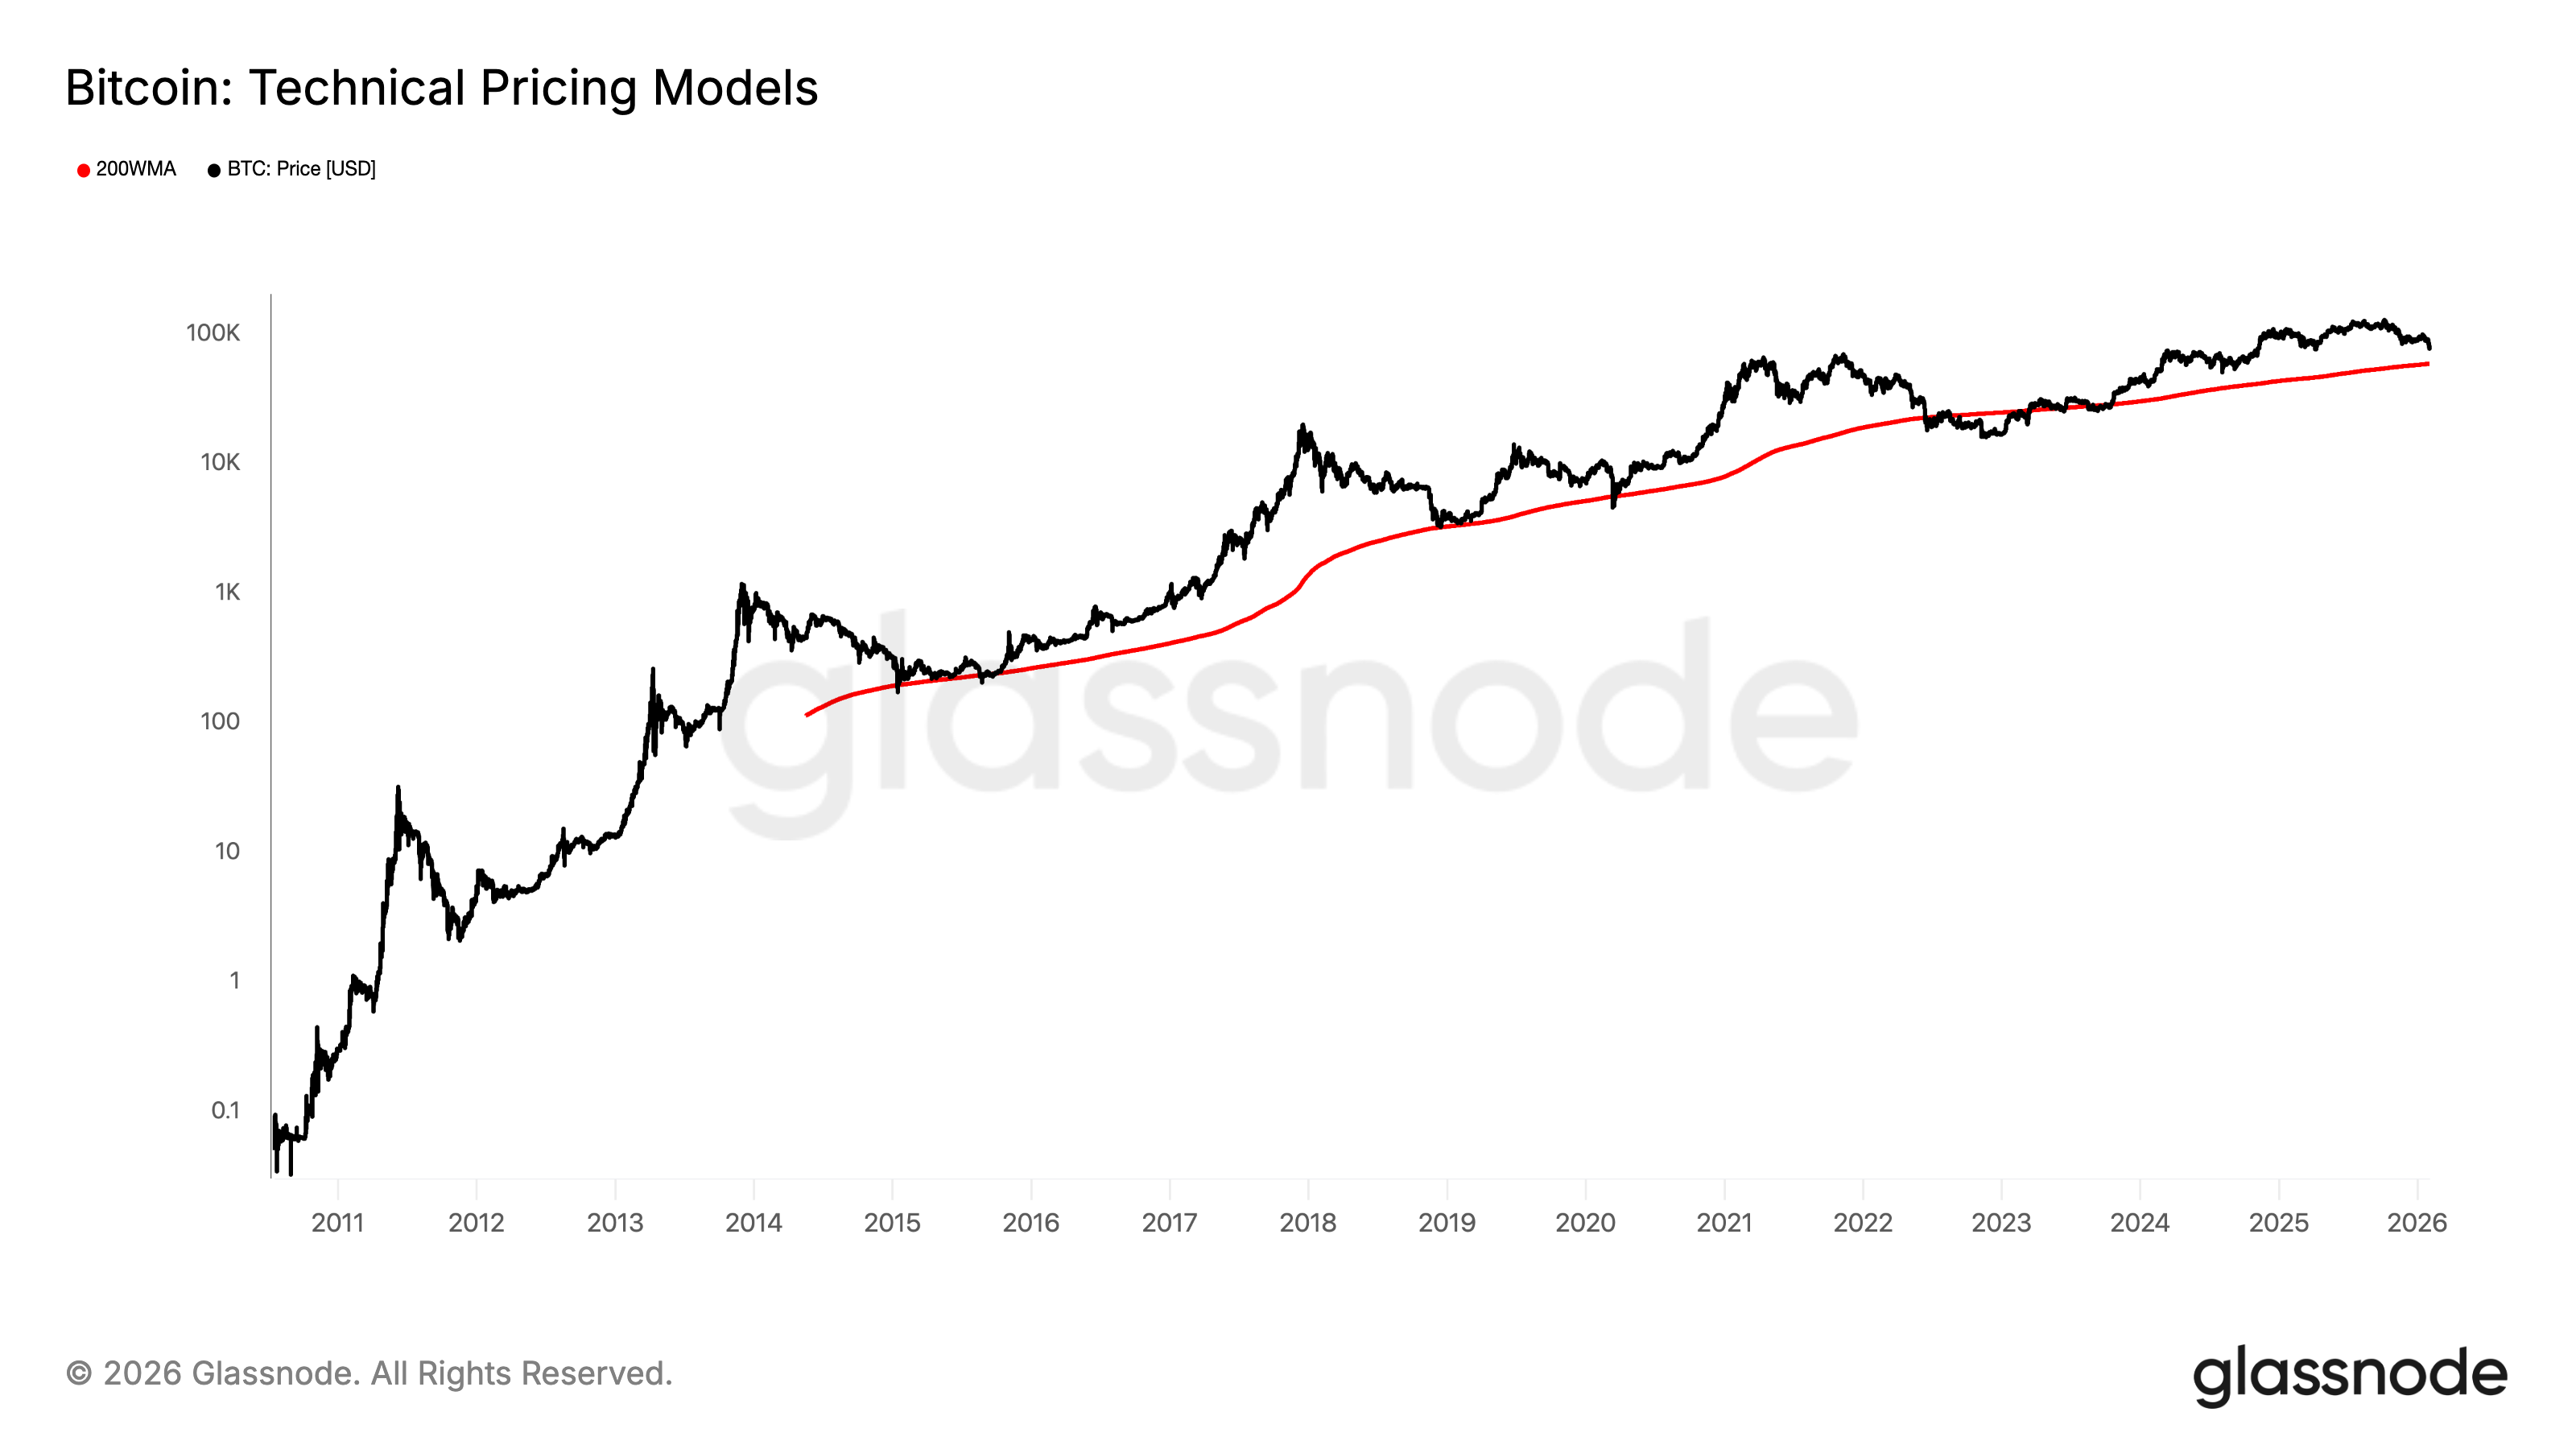
Bitcoin dropped 11% last week, with the price around $64,168.87. The sharper focus now is not only the recent sell-off but the possibility of a move toward $58,000, a level roughly 25% below current prices and close to a widely watched long-term support area.
The article says the slide was Bitcoin’s biggest weekly decline since March 2025. Buyers have yet to show strong follow-through after the drop, which has kept concerns alive over whether the market is still moving through a deeper bearish phase. At the center of that discussion is the 200-week moving average, currently at $57,926.
The 200-week moving average is back in focus
The 200-week moving average has long been used as a key gauge of Bitcoin’s long-term momentum. It also serves as a reference point in the traditional four-year cycle framework. According to the source material, that line marked the market bottom in every previous cycle, which is why the zone around $58,000 is drawing attention now.
Bitcoin reached an all-time high of $126,000 in October. It is now down about 40% from that peak. That pullback is already substantial, but the article argues that past cycle behavior leaves room for more downside before a base is formed.
Weekly break below the Ichimoku Cloud turns the structure weaker
The report also points to the Ichimoku Cloud, a technical indicator used to assess momentum, support, and resistance. When price holds above the cloud, the trend is generally seen as strong. Below the cloud, momentum fades and the market becomes more exposed to an extended weak stretch.
Bitcoin has now moved below the cloud on the weekly chart. In the historical cases referenced by the article, that kind of shift often aligned with the deeper and more painful stages of a bear market. The signal is simple: the weekly setup has deteriorated.
Four-year cycle and halving pattern still frame the move
The article also places the current decline within Bitcoin’s four-year cycle theory. That framework is tied to the halving schedule, which cuts new supply by 50% roughly every four years and is often cited as one driver behind Bitcoin’s alternating bull and bear cycles.
In the 2015 bear market, Bitcoin traded a little above $200 and repeatedly used the 200-week moving average as support. During the 2018-2019 bear market, the same line sat just above $3,000 and again acted as support, with only a brief break during the Covid-driven crash in March 2020. In the previous cycle, Bitcoin fell below the 200-week moving average in June 2022, dropping under $22,000 and staying there for an extended period. It did not reclaim the line until October 2023.