

Bitcoin has dropped from its record high of about $126,000 in October last year to the $60,000 range, a drawdown of more than 54%. After nine months of decline, the debate in crypto has started to shift. The question is no longer only how much lower BTC can go, but whether the bottom may already be in.

On July 19, crypto trader Doctor Profit, who said he had accurately shorted this downtrend, published a long post on X saying he had fully closed all short positions and started buying spot Bitcoin at $64,000. The post drew more than 2.13 million views. On the same day, cycle researcher Jake Pahor reached the opposite conclusion in his CryptoSuperHub Substack report, saying a review of 5,279 days of data since 2012 showed that none of the three signals seen at every bear-market bottom since 2014 has appeared in this cycle.
Doctor Profit closes every short and starts building a long BTC position
Doctor Profit called the post his “report of the century.” He said every short opened since September 2025 had now been closed, including Bitcoin shorts from the $115,000-$125,000 range, shorts from the $79,000-$82,000 range, and more than 100 altcoin short positions, all with profits locked in.
He said he entered spot BTC at $64,000 and is using a structured accumulation plan. As long as Bitcoin remains between $54,000 and $64,000, he plans to deploy 5% of his allocated capital each day into spot purchases. If BTC drops to $58,000, he buys. At $56,000, he buys more. Below $54,000, he plans to increase the pace.
His shift is not based mainly on chart structure. He framed it as a call driven by fundamentals. In his view, the broader market is still waiting for a “four-year cycle bottom” in September or October, but that consensus itself has become a warning sign. “The market won’t reward people who memorize the calendar. When everyone is waiting for the same date, the bottom often comes early,” he wrote.
Doctor Profit listed several developments that he believes are changing Bitcoin’s market structure. He said the CLARITY Act could pass the Senate before Aug. 10. He also pointed to BlackRock, Vanguard, JPMorgan, Goldman Sachs and the New York Stock Exchange joining DTCC’s tokenized securities pilot, with Microsoft shares, SPY, QQQ and U.S. Treasuries being tested as tokenized securities ahead of a formal launch scheduled for October. He also cited Citadel’s recent $400 million investment in Crypto.com at a $20 billion valuation.
Based on that setup, he argued that trillion-dollar institutional capital is waiting off-market to enter, while tokenization and regulatory legislation are moving at the same time. As retail traders on X call for entries at $40,000 to $50,000, he said the largest pools of capital are already moving. “I won’t stand behind the herd and ask the market for coins at the same price as everyone else. I want to be ahead of them.”
He added that he is keeping all of his S&P 500 shorts unchanged. In his framework, the crypto bear market began in October 2025, several months before equities, which means crypto has already gone through a repricing phase. If a stock-market crash pushes capital out of overvalued assets and into crypto after that repricing, he sees that as a possible catalyst rather than a threat.
gumsays points to a 147-day weekly bullish divergence
On-chain analyst gumsays posted a separate argument on the same day, this time from the technical side.
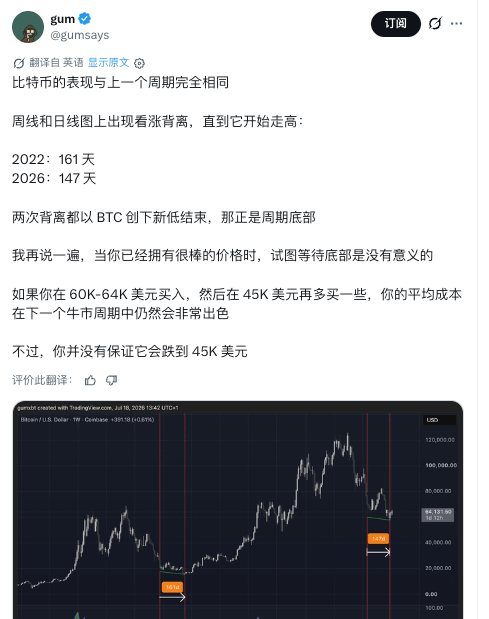
He said Bitcoin’s weekly chart now looks highly similar to the setup seen around the 2022 cycle low. In that earlier cycle, weekly bullish divergence lasted 161 days before Bitcoin made a fresh low and confirmed the bottom. In the current 2026 cycle, he said the divergence has already lasted 147 days, leaving a gap of only about two weeks compared with 2022.
His conclusion was measured but clearly constructive. “When you already have a good price, trying to wait for the absolute bottom makes little sense. If you buy in the $60,000 to $64,000 range and add again at $45,000, your average entry is still excellent for the next bull market.” He added one clear caveat: “There is no guarantee it drops to $45,000.”
Jake Pahor says none of the three historical bottom signals is in place
Jake Pahor laid out the clearest counterargument in CryptoSuperHub’s July 19 weekly report.
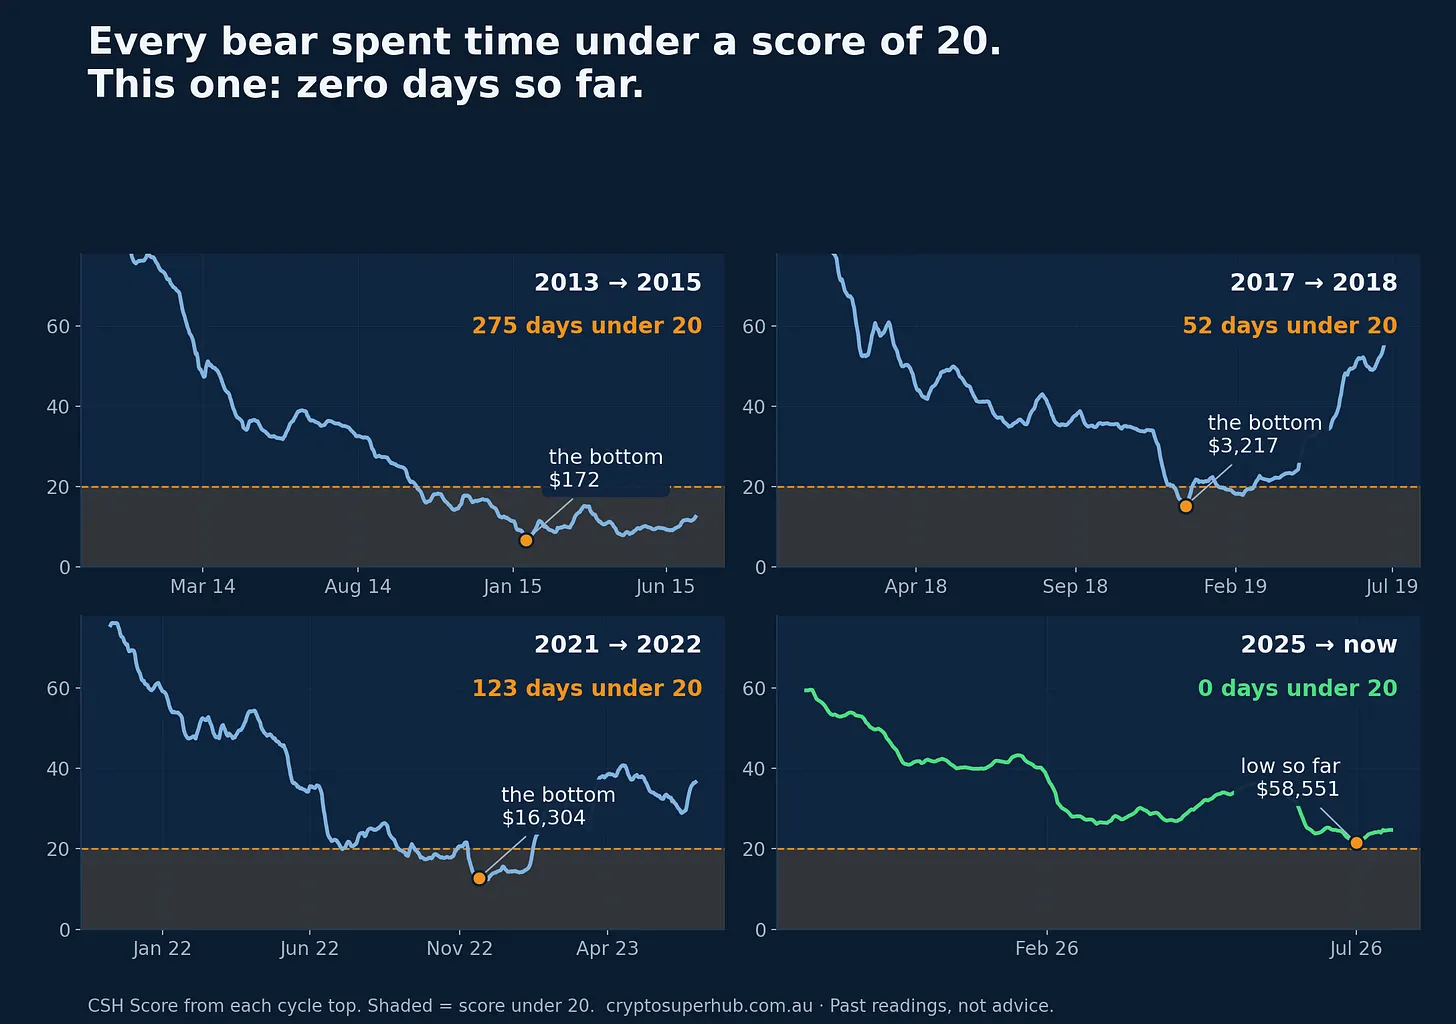
Using 5,279 days of CSH risk score data going back to February 2012, he said every bear-market bottom since 2014 has shared three traits.
1. Time
Since 2014, each bear cycle has taken about 12 months from top to bottom, he wrote. This cycle’s peak came in October 2025, which would place the 12-month window in the fourth quarter of this year. So far, only nine months have passed.
2. Extreme fear
Pahor said the CSH risk score has dropped below 20 ahead of every prior bear-market low and then stayed there for a meaningful stretch. In 2014-2015, the score remained below 20 for 275 days. In 2018, it did so for 52 days. In 2022, it stayed under 20 for 123 days. In the current cycle, the score has not spent a single day below 20. The low so far was 21.5 on July 1.
3. Price below realized price
He also pointed to realized price, the weighted average price at which all Bitcoin last moved on-chain, which he described as the market’s aggregate cost basis. That level is now around $53,000. In every earlier bear-market bottom, spot price broke below it. This cycle’s June low of $57,000 came close, but did not touch it.
For Pahor, the score is simple: three conditions, zero satisfied. That is why he has not joined the camp calling the bottom already in.
Not outright bearish: keep DCA running, leave larger orders lower
Pahor did not frame himself as a pure bear. In the same report, he acknowledged that the bullish side has valid points.
He said this cycle’s drawdown is shallower than in prior periods at the same stage. He also noted that ETFs, a buyer base that did not exist in 2018 or 2022, may provide stronger support for a higher bottom this time. At the June low, more than half of all Bitcoin was already underwater, a condition that has historically overlapped strongly with bottoming zones.
His positioning reflects that balance. Weekly dollar-cost averaging continues as normal while the CSH score sits in the 20-30 range. His larger buy orders remain parked below a score of 20 and have not been triggered yet. “If the bottom is already in, my DCA buys in the low 20s will perform well. If the bottom is not in, my bigger orders are waiting below 20, fully funded. A plan can cover two outcomes. A prediction can only cover one,” he wrote.
He also included historical backtest data. Buying Bitcoin when the CSH score was between 20 and 30, roughly where the market is now, produced a median 12-month return of +132%, with losses on only 6% of trading days. Buying when the score was above 60 produced a negative median return.
Two structural variables are at the center of the split
Across these views, the disagreement comes down to one issue: whether ETF demand and regulatory legislation are enough to break this cycle away from the historical template.
Doctor Profit says yes and is positioning for an earlier bottom with a full shift to the long side. Jake Pahor says the evidence is not yet strong enough to overturn the historical pattern, so he is building exposure systematically while reserving larger capital for a more extreme signal.
As of July 19, Bitcoin was trading around $64,800. The 200-week moving average was near $63,000, leaving price just above that long-term support line. The Fear and Greed Index stood at 25, in extreme fear territory.