
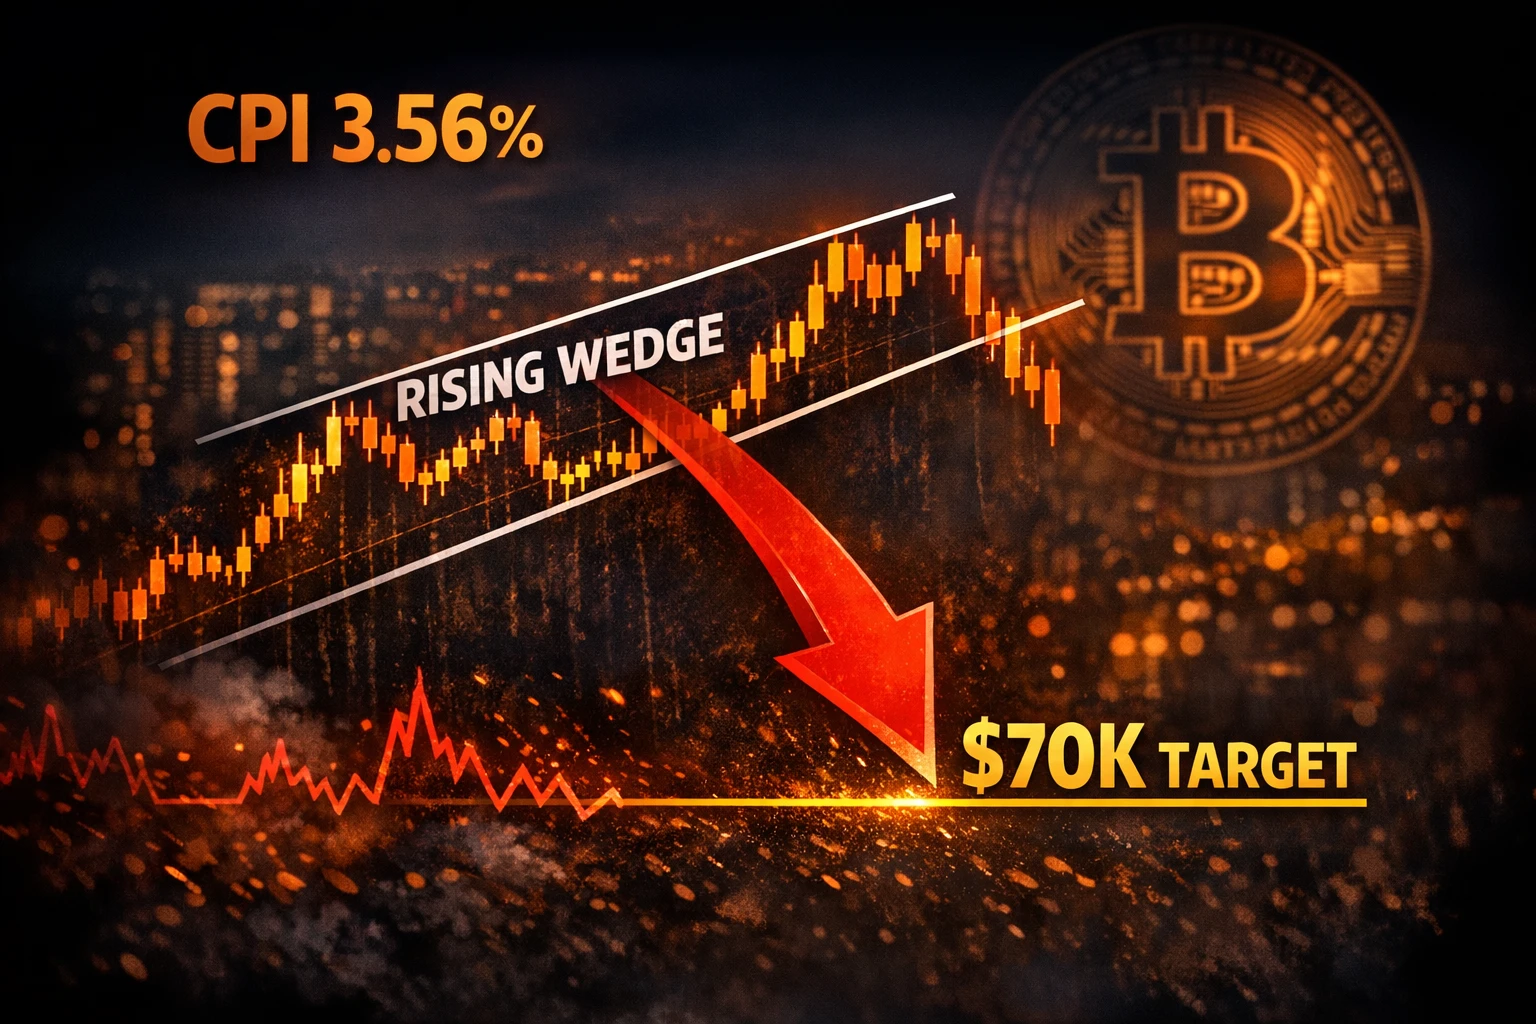
A Cleveland Fed nowcast has put April U.S. CPI at 3.56% year over year, up from 3.3% in March. At the same time, Strategy has paused bitcoin purchases, weakening one of the institutional demand pillars that helped absorb supply in prior inflation releases. Analysts are now watching a simple trigger: if BTC fails to regain the 200-day EMA, the chart setup points to a possible move toward $70,000.
Inflation estimate rises as traders reassess rate-cut expectations
According to the Cleveland Fed inflation nowcast, headline CPI for April is projected to increase 0.45% month over month, below the previous 0.9%, while the annual rate is seen at 3.56%. Core CPI is estimated at 2.56% year over year and 0.21% month over month, close to the prior readings of 2.6% and 0.2%.
The signal is mixed. Monthly inflation appears to be cooling and core prices look relatively steady, but the higher annual reading could still reinforce the view that the Federal Reserve may not move quickly on rate cuts. That keeps pressure on risk assets, including bitcoin. The official April CPI report is due on May 12.
Bitcoin rose on hotter CPI before, but institutional support has changed
The source notes that bitcoin had climbed after earlier CPI releases even when inflation came in hot. In the March CPI case, headline inflation jumped from 2.4% in February to 3.3%, yet BTC still gained more than 15% after the report.
One reason was institutional buying. At the time, buyers absorbed more than 500% of newly mined bitcoin supply, with Strategy accounting for a meaningful share. That backdrop has weakened. Strategy has recently stopped adding bitcoin, and its preferred stock STRC continues to trade below its $100 par value. That reduces the efficiency of raising fresh capital through new issuance and limits funding capacity for additional BTC purchases.
Rising wedge puts the focus on $84,000 and the 200-day EMA
On the daily chart, bitcoin is forming a rising wedge, a pattern often associated with bearish reversals. If price breaks below the lower trendline, the setup usually opens the way for a move roughly equal to the height of the wedge.
As of Sunday, BTC was approaching the convergence area near $84,000, which also lines up with the 200-day EMA. If price is rejected there and breaks lower, analysts see a downside target around $70,000. If bitcoin reclaims that area and clears the 200-day EMA, the move could trigger short covering with upside targets in the $90,000 to $95,000 range.
$78,600 identified as the key line for bulls
Analyst Killa said larger traders may start reducing risk ahead of the CPI release. He identified $78,600, the weekly open, as the key support level. If that level fails, the next downside zone would be $74,000 to $75,000.
He added that he would watch for liquidity sweeps around that pivot area as a signal for the next directional move. At the time of writing, bitcoin was trading at $80,694, nearly flat over the past 24 hours, with the market waiting for Tuesday’s inflation data.