
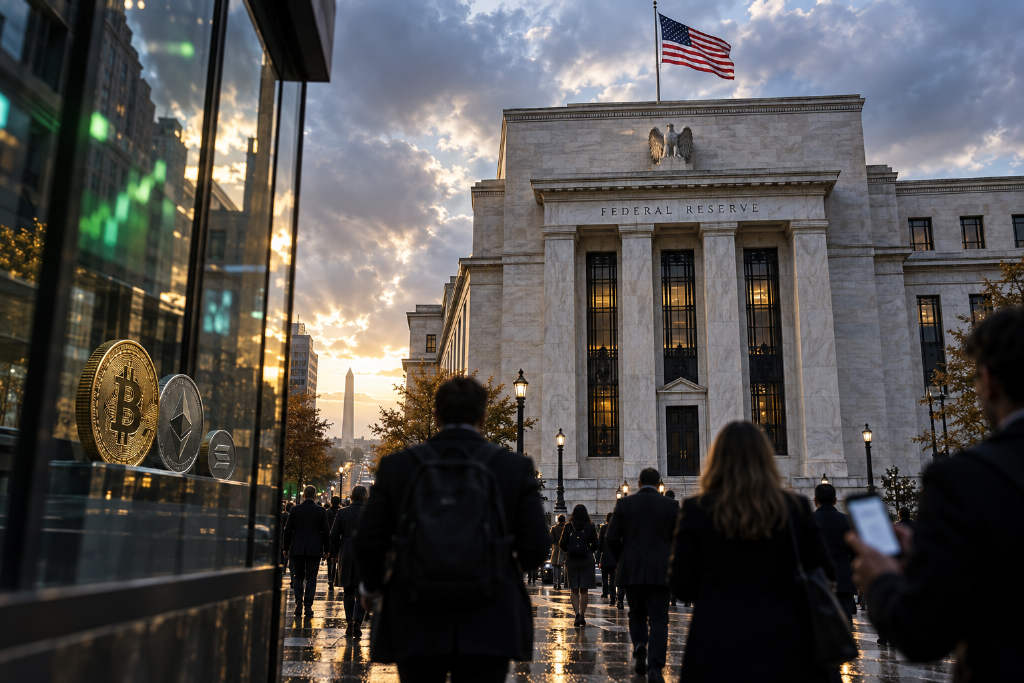
Bitcoin traded near $76,000 as risk assets stabilized after the Federal Reserve delivered its first rate hike since 2023. U.S. stocks bounced back on Thursday, led by technology shares, and crypto prices followed. Ether moved up toward $2,450, while Solana posted the strongest gain among major tokens.
According to the source, the Fed raised rates by 25 basis points on Wednesday, taking the benchmark range to 3.75%-4%. The move triggered a sharp market reaction at first, with the Dow falling about 600 points during the session. By Thursday, sentiment had shifted. The Nasdaq jumped 1.7% to 26,418, up 439.87 points. The S&P 500 rose 1.1% to 7,637, gaining 85.95 points, and the Dow Jones Industrial Average rebounded 316 points, or 0.6%, to 51,778.
Brent crude fell 1%, while the 10-year U.S. Treasury yield slipped to 4.93%. The report said that pullback in yields gave risk assets room to recover. Fed Chair Kevin Warsh said inflation remains 「too high and has lasted too long」.
Crypto steadies as Ether and Solana outperform
Crypto markets moved in the same direction as equities. Bitcoin stayed in a narrow range around $76,000, showing less momentum than some large-cap altcoins. Ether rose 1.36% over 24 hours to $2,449, with an intraday high of $2,483 and a low of $2,413. Over the past 14 days, the report placed Ether’s high at $2,626 on Sept. 11 and its low at $2,387 on Sept. 16.
Solana led the group, gaining 2.89% to $101.46. Its intraday range was $98.47 to $102.05. Over 14 days, the token’s high was listed at $107.07 on Sept. 6 and its low at $96.42 on Sept. 16. XRP added 0.67% to $1.3017. Its 14-day high was $1.477 on Sept. 15, and its low was $1.263 on Sept. 17.
$203 million in liquidations, with shorts taking most of the hit
CoinGlass data cited in the report showed total liquidations across the crypto derivatives market reached $203 million over the past 24 hours. Short liquidations accounted for $147 million, while long liquidations came to $56.23 million, making short positions the main source of losses.
The number of liquidated traders reached 68,483. The largest single liquidation was a $5.75 million SP500 contract on Hyperliquid.
Bitcoin technical setup: closes at $76,417 below the Bollinger mid-band
Bitcoin closed its daily candle on Sept. 17 UTC at $76,417. Its RSI14 stood at 51, placing it in neutral territory. On moving averages, the close sat below the 20-day simple moving average at $78,031, but above the 50-day SMA at $72,181 and the 200-day SMA at $70,373. The source described that setup as short-term weak and long-term strong.
MACD remained in a bearish arrangement, with DIF below DEA, though the histogram narrowed from the previous day, pointing to weaker downside momentum. On the 20,2 Bollinger Bands, the middle band was $78,031, the upper band was $80,890, and the lower band was $75,172. Bitcoin closed below the middle band. Its 30-day high was $82,300, and the 30-day low was $64,166.
The report listed resistance levels at the 20-day SMA of $78,031, the upper Bollinger Band at $80,890, and the 30-day high at $82,300. Support levels were the lower Bollinger Band at $75,172, the 50-day SMA at $72,181, and the 200-day SMA at $70,373.
Ether technical setup: closes at $2,447 with RSI14 at 54.2
Ether closed its daily candle at $2,447, with RSI14 at 54.2, also in neutral territory. The close was below the 20-day SMA of $2,465, but above the 50-day SMA of $2,229 and the 200-day SMA of $2,068. The source used the same short-term weak, long-term strong description for that structure.
Ether’s MACD was also in a bearish arrangement, though the histogram narrowed. Its Bollinger middle band was $2,465, with the upper band at $2,545 and the lower band at $2,384. The close remained below the middle band. Ether’s 30-day high was $2,666, and the 30-day low was $1,906.
Resistance levels were listed at the 20-day SMA of $2,465, the upper Bollinger Band at $2,545, and the 30-day high of $2,666. Support levels were the lower Bollinger Band at $2,384, the 50-day SMA at $2,229, and the 200-day SMA at $2,068.
Fear and Greed Index rises back to 56
Alternative.me’s Fear and Greed Index came in at 56 on Sept. 18, which put the market in greed territory. That was 6 points higher than the previous day’s reading of 50. Over the last eight days, the index ranged from 50 to 69, with the high at 69 on Sept. 15 and the low at 50 on Sept. 17.
The source said crypto and traditional markets rebounded together after the rate-hike shock was absorbed, though Bitcoin’s gains remained relatively modest and capital appeared to lean more toward U.S. technology stocks than crypto assets. It also said investors are watching the Fed’s rate path and the effect of Middle East geopolitical developments on oil prices.
The article was compiled by BlockTempo, citing data from Binance, CoinGecko, Alternative.me, and CoinGlass.