Bitcoin Structure: 5-Wave Correction Approaching Endpoint 44
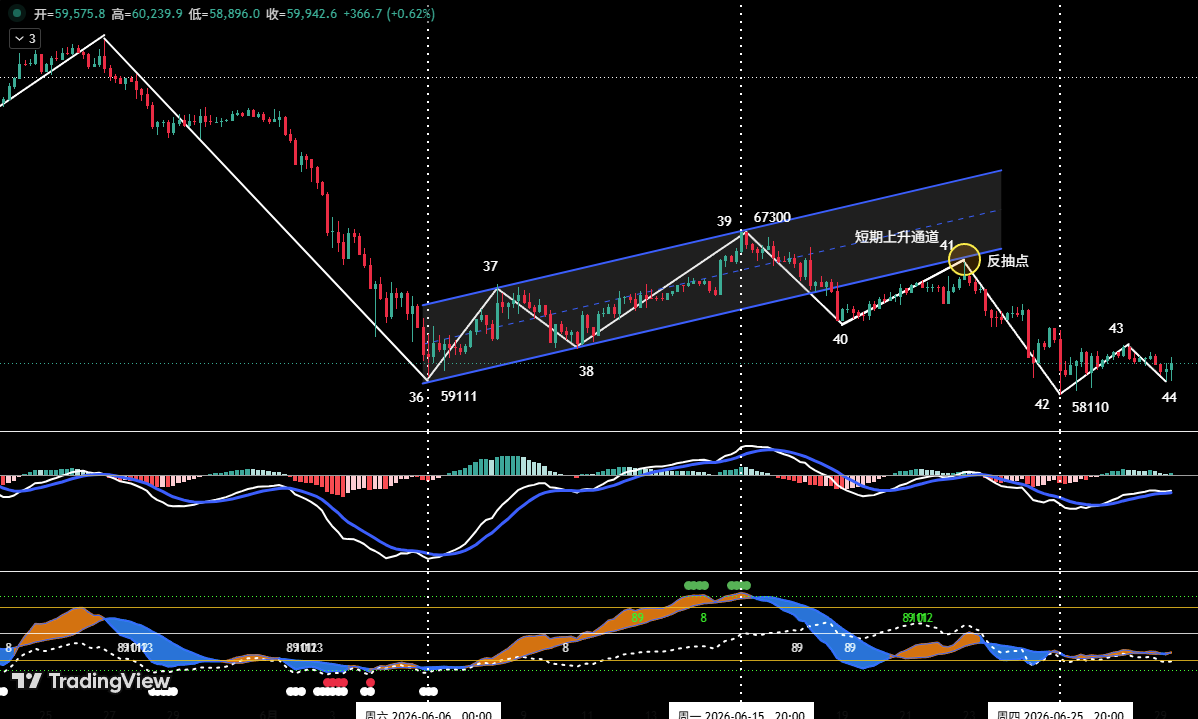
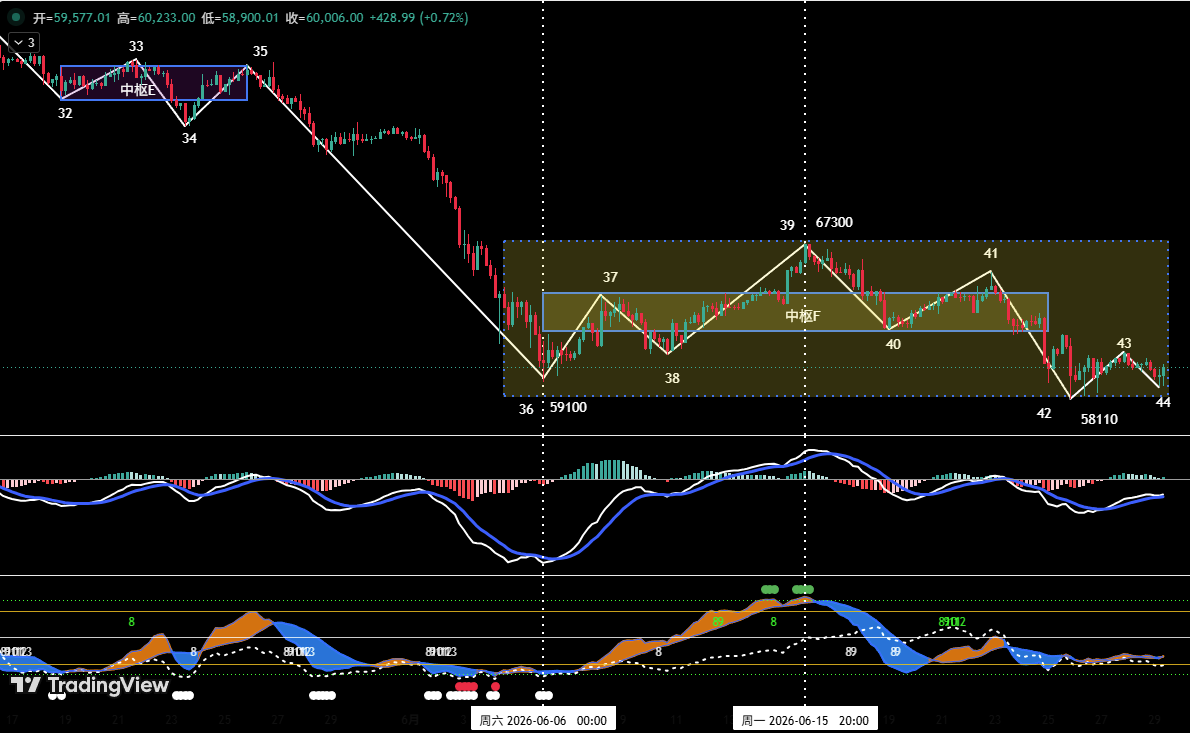
Bitcoin is currently in the tail end of a five-wave corrective structure (endpoint 39 to endpoint 44) that began from the June 6 low of $59,100. The market is now executing the final wave (43-44). As shown in Figure 1, last week's price hit a low of $58,110 before finding temporary support. The eventual position of endpoint 44 will be pivotal: if it finishes above $58,110, a meaningful technical rebound is expected, followed by a wide range consolidation; if it closes below $58,110 but with bullish momentum divergence (hidden or regular), a rebound remains possible but with reduced strength; if it closes below without divergence, caution is warranted for a further breakdown. Our proprietary quantitative model assigns higher probability to the first two scenarios.
Trading Strategy: 20% Medium-Term Short, 30% Short-Term Scalping
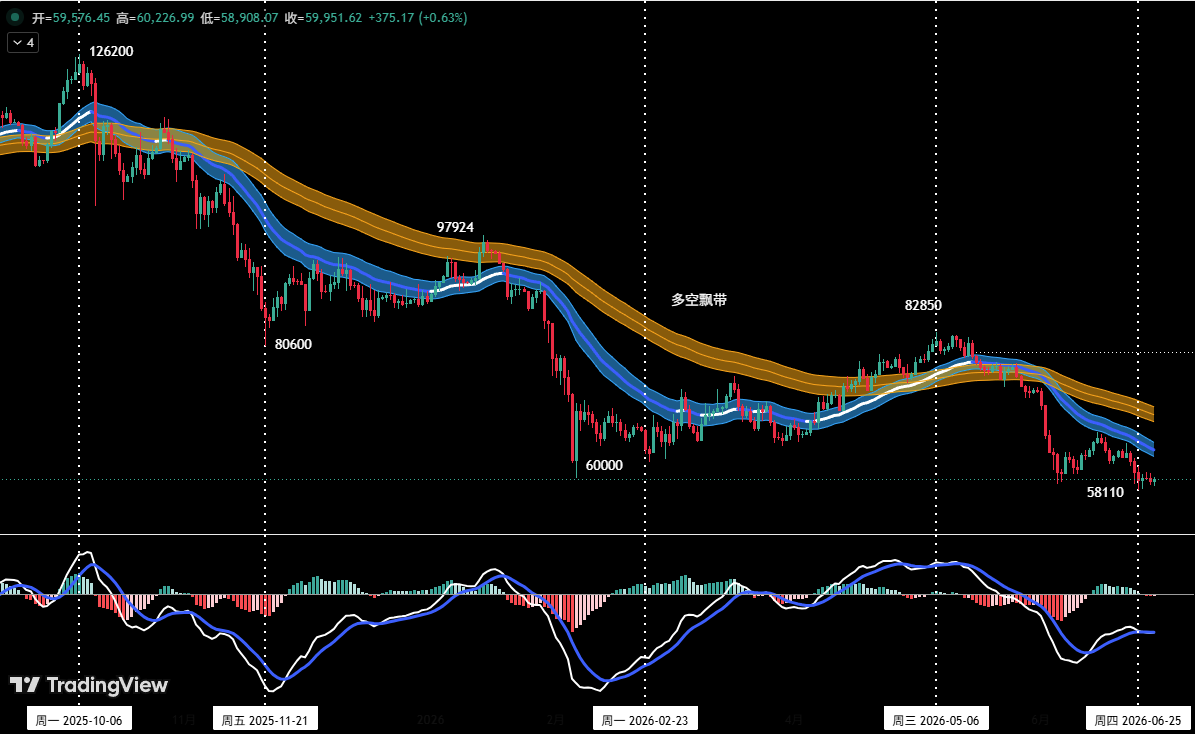
Key Resistance Zones: First resistance $60,900-$62,300, second $65,500, third $67,300-$69,500. As shown in Figure 3, price has effectively broken below the bull-bear channel, confirming a bearish market structure. Maintain approximately 20% medium-term short position. For short-term trading, allocate 30% of capital with strict stop-losses, using the 30-minute/60-minute timeframe to trade the range between support and resistance. Additionally, prepare three contingency plans (Plan A/B/C) to dynamically adapt to evolving market complexity.
HYPE Analysis: Support Zone Long Setup
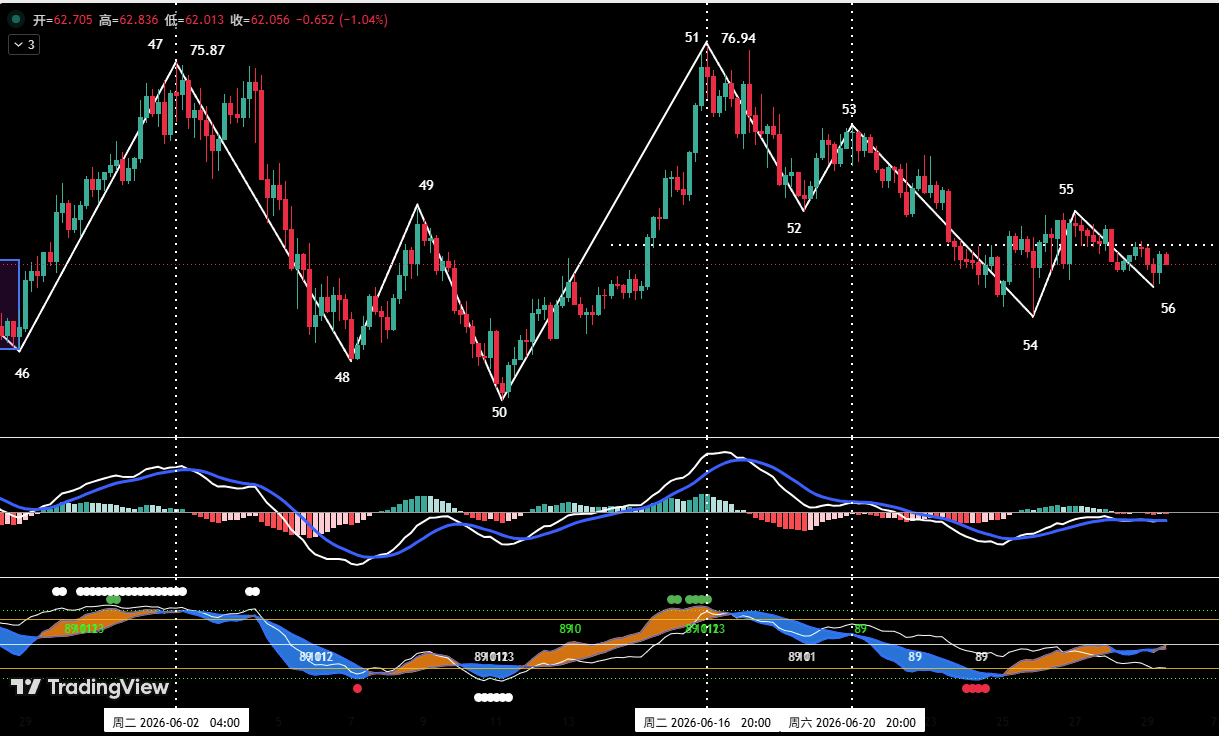
As illustrated in Figure 4, HYPE has been undergoing a five-wave corrective decline from its June 16 high of $76.94 (endpoint 51). The structure comprises waves 51-52, 52-53, 53-54, 54-55, and the ongoing 55-56. The formation of endpoint 56 is critical: if it makes a higher low (double bottom) relative to the previous low (endpoint 55), a rebound is likely. Quantitative analysis indicates higher probability for the double-bottom scenario. Key resistance levels: $65.5 and $71.5. Key support areas: above $58.8, and a deeper zone $52-$54. Short-term strategy: "buy the dip, avoid chasing". When price stabilizes in the support zone with bottom signals from our dual models, consider a light long position (position size strictly below 30%) and enforce strict stop-loss discipline.
Last Week's Trade Review: Two Short Trades Profit 6.21%
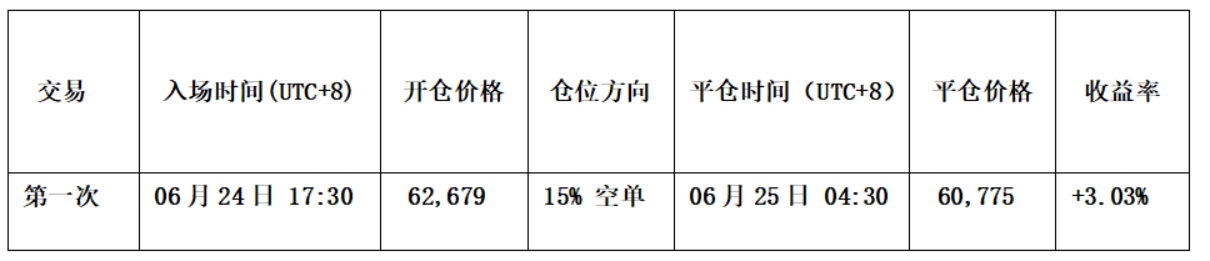
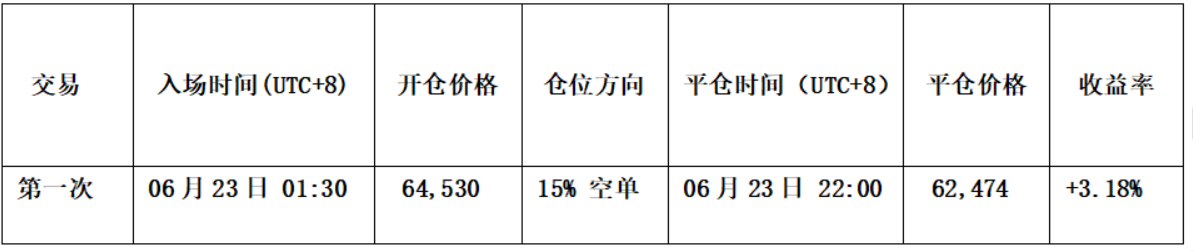
Following the trading plan, we executed two short trades last week using our proprietary Spread Trading Model and Momentum Quantitative Model. Trade 1: Opened a 15% short position at $64,530, closed at $62,474, realizing a profit of ~3.18% (1x leverage). Trade 2: Opened a 15% short position at $62,679, closed at $60,775, profit ~3.03%. Total combined profit: ~6.21%.
Risk Disclaimer: Financial markets are highly dynamic; all analysis and strategies require real-time adjustment. The views, models, and operational plans presented here are based on personal technical analysis and serve solely as personal trading logs. They do not constitute investment advice or a recommendation to trade. Market risk is significant; invest with caution and never rely solely on this content for decision-making.