

Bitcoin briefly flashed a confirmed daily golden cross on Friday, but the setup did not hold through the afternoon session.

BTC was trading around $77,438 at the time cited in the report, up 1.19% on the day but far below its earlier high near $79,837. The pullback lined up with a rates market that turned more hawkish after fresh inflation data was released.
Friday’s Consumer Price Index report showed core CPI at 0.3% for the month, above the 0.2% level analysts had expected. CME FedWatch, which tracks probabilities implied by 30-day Fed funds futures, showed the odds of a 25-basis-point rate increase at roughly 69% shortly after the inflation release. Within the next few hours, those odds rose to 86.5%.
If the Federal Reserve delivers a rate hike at next week’s meeting, the report said that outcome would generally come before a risk-off move from investors, putting assets such as Bitcoin and tech stocks under pressure.
Price swing erased the day’s crossover
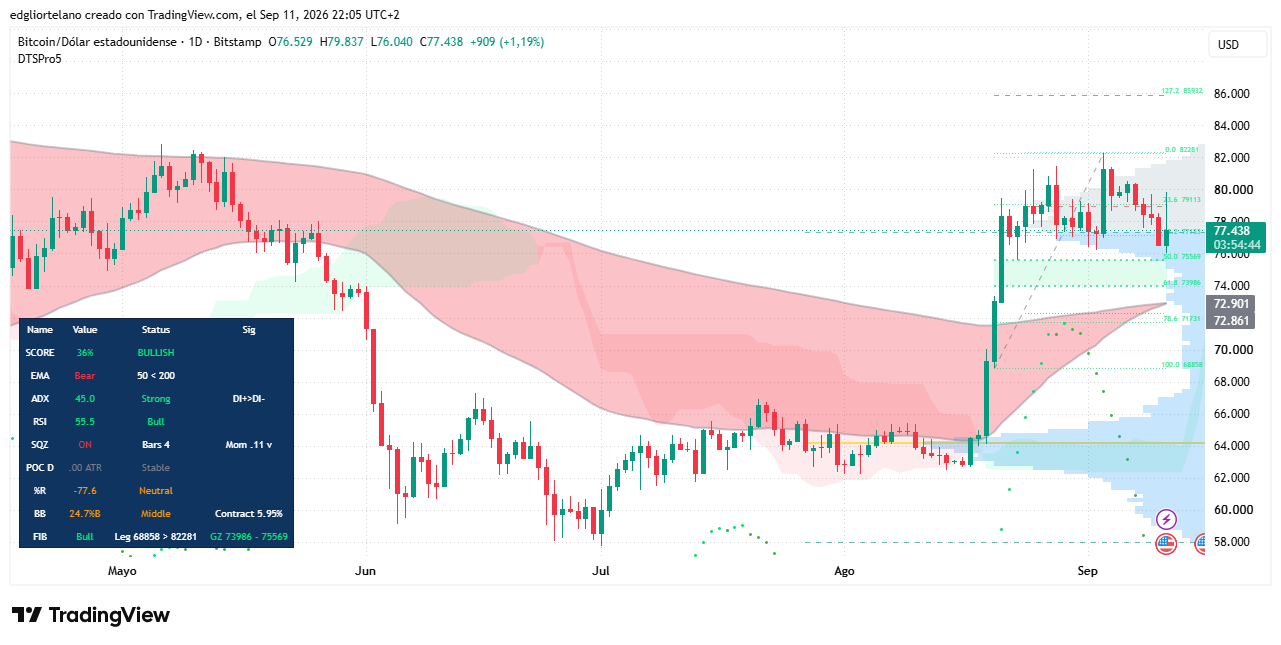
Bitcoin opened the day at $76,529, rallied to an intraday high of $79,837, then fell back to a low of $76,040 before settling near $77,438. That still left the asset up 1.19% on the session, but well below the day’s peak.
That round trip was enough to shift the daily exponential moving average reading back to a bearish configuration. Bitcoin’s 50-day EMA had briefly moved above its 200-day EMA earlier Friday, creating what traders call a golden cross. The article described that pattern as one of the strongest bullish chart signals and noted that Bitcoin had not seen one since last November. It did not last.
The 50-day average has since slipped back under the 200-day line, leaving Bitcoin just short of a confirmed golden cross. The crossover could still happen, but the report said Friday no longer looked like the day it would stick.
Why a flickering golden cross can happen
A golden cross forms when a shorter-term moving average, in this case the 50-day line based on the last 50 daily closes, rises above a longer-term average such as the 200-day line.
It is one of the most closely watched trend signals in financial markets because it has historically come ahead of some of Bitcoin’s larger rallies. At the same time, it is a lagging indicator built entirely on past price action. When the two averages trade close together, as they are doing now, intraday swings can flip the signal on and off within a single session.
That is what happened on Friday. The move to $79,837 nudged the 50-day EMA above the 200-day EMA, while the retreat to $77,438 pulled it back below.
For traders watching the daily chart, the episode served as a reminder that some golden crosses are thin and unstable. When moving averages are tightly clustered, one volatile session can push the crossover back and forth before the close settles it. The report also noted that the daily candle was still open at the time, so the reading could still change again before the session ended.
Daily trend strength remains intact
The broader trend reading, however, remained firm regardless of which side of the crossover Bitcoin was trading on.
The Average Directional Index, or ADX, measures trend strength without regard to direction. Friday’s reading stood at 45, well above the 25 threshold often used to separate a meaningful trend from market noise. Positive directional movement was still ahead of negative directional movement.
The Relative Strength Index, or RSI, tracks momentum on a 0-to-100 scale. Readings above 70 are commonly treated as overbought, while levels below 30 point to oversold conditions. Bitcoin’s RSI was 55.5, keeping it on the bullish side of neutral.
4-hour chart stays bullish, but momentum cools
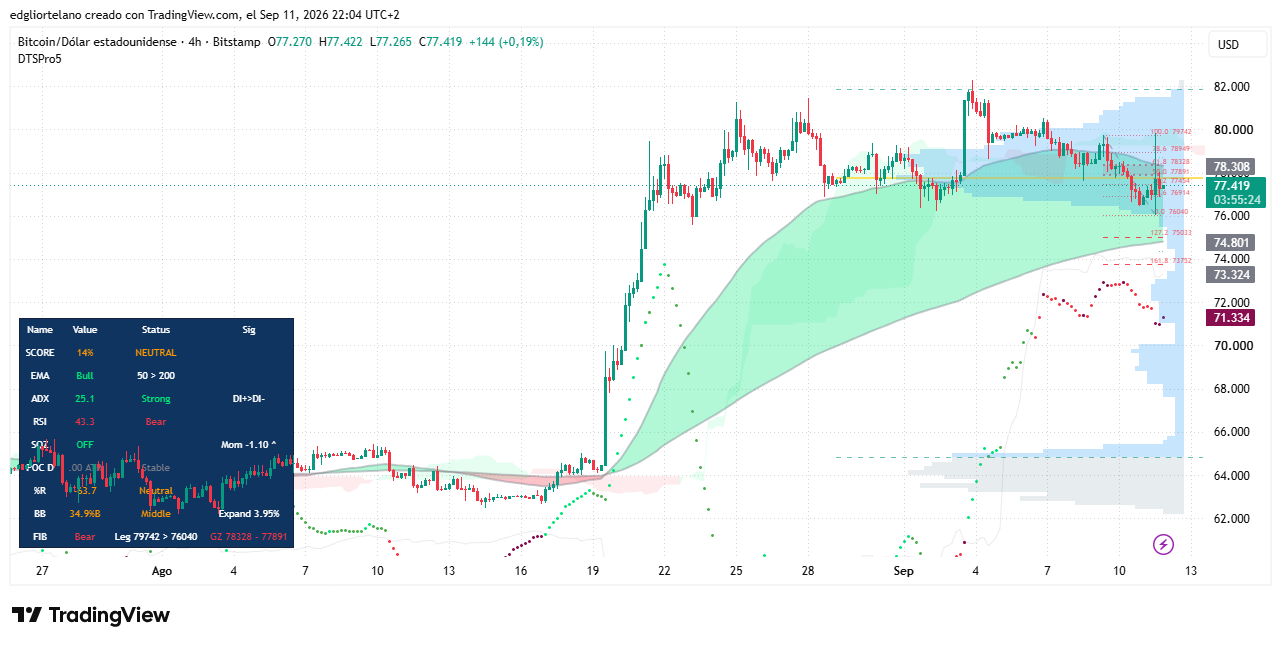
The 4-hour chart told a different story from the daily one. It never lost its golden cross. The 50-period EMA remained above the 200-period EMA, preserving the broader bullish structure that first formed in late August. Even so, most of the other signals on that timeframe had weakened.
RSI on the 4-hour chart had dropped to 43.3, moving into bearish territory. The Squeeze Momentum indicator, after being compressed for several days, had just triggered, with volatility expanding by 3.95%. The report said that kind of move typically shows up at the start of a sharp swing, and in this instance the direction was lower.
ADX on the 4-hour chart stood at 25.1, only slightly above the 25 threshold. That suggested the intraday trend was much weaker than the one visible on the daily chart.
The larger structure still leaned bullish in the report’s assessment. The 4-hour chart had held its shape since late August, and the daily ADX reading of 45 pointed to a real trend even as the moving-average label shifted back and forth during a volatile trading session.
The author’s views and opinions are for informational purposes only and do not constitute financial, investment, or other advice.