

OdailyDepth’s latest invited market analysis describes this week’s trading environment as unusually complex. According to the article, the unexpected implementation of the U.S.-Iran agreement and the reopening of the Strait of Hormuz triggered a sharp repricing across global assets. Against that backdrop, the piece focuses on structural analysis for Bitcoin and HYPE, laying out short-term and medium-term views, key price areas, position plans, and the results of a HYPE short-term trade completed last week.
The article says that its previous Bitcoin view has been validated by the market. In last week’s analysis, it stated that after Bitcoin briefly broke below the 60,000-dollar mark, the price found support and would begin a short-term rebound to confirm the validity of the breakdown at an important level. The current price action is described as consistent with that earlier view. For HYPE, last week’s view was that if price pulled back into the 55 to 57-dollar support zone and showed signs of stabilizing, while two internal models also triggered bottom signals, a small long position could be considered. The new article says the market movement has been highly aligned with that plan.
Bitcoin: 65,000 Dollars Becomes the Main Battleground
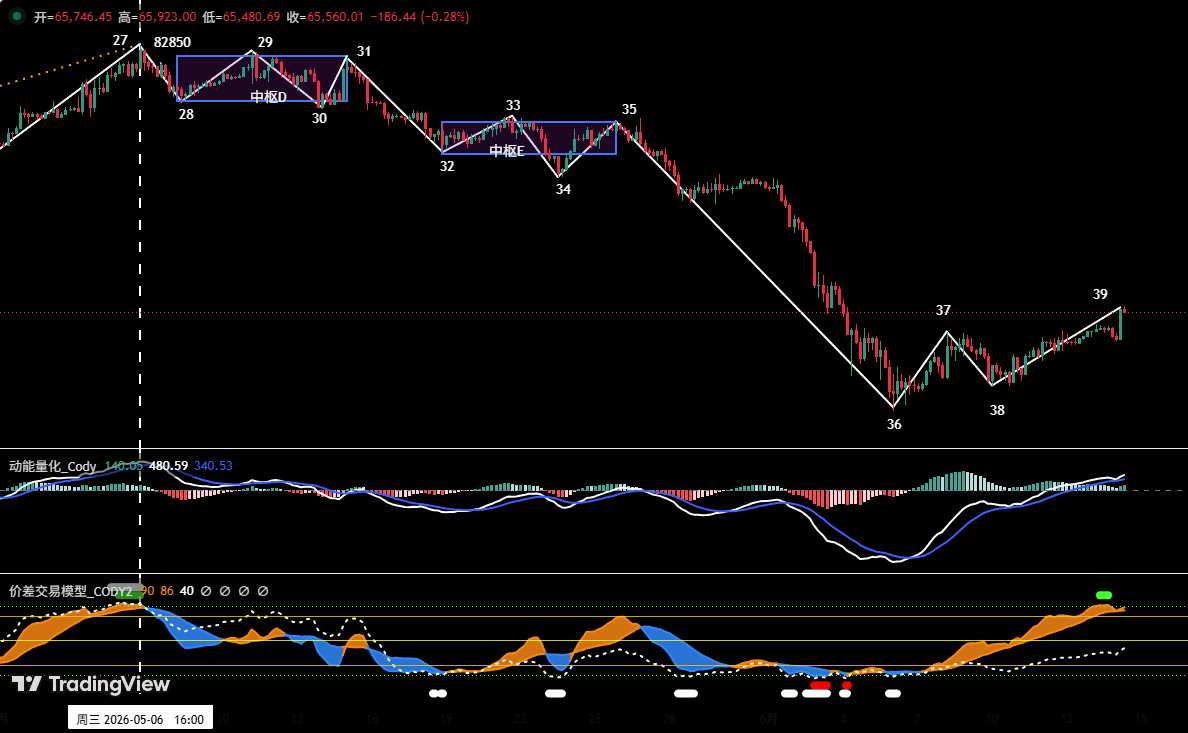
On the Bitcoin four-hour chart, the analysis breaks down the decline from the May 6 high of 82,850 dollars into a 12-leg corrective structure. The structure includes two descending consolidation centers, labeled Center D and Center E. The article characterizes the overall pattern as a clear and complex correction. At the current stage, it says Bitcoin is moving through the 38-39 rebound leg, and the price has already moved above 65,000 dollars.
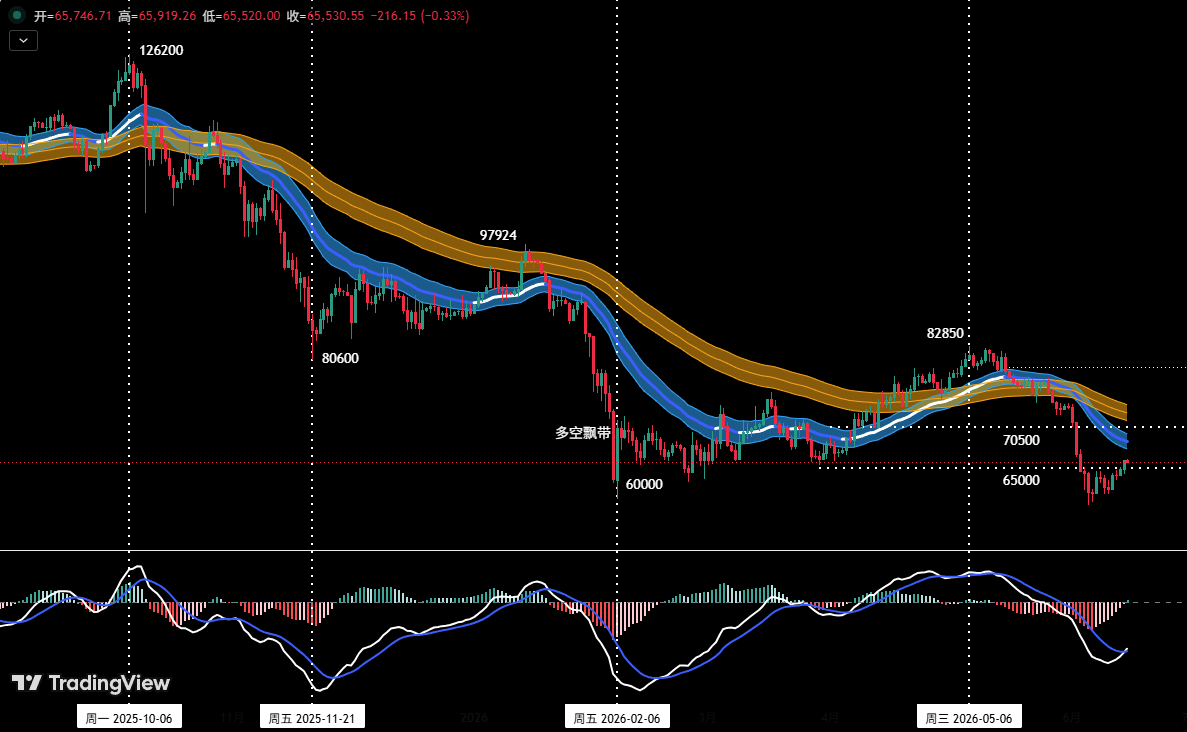
If the breakout above 65,000 dollars is confirmed as effective, the next important resistance area for the rebound is identified at 69,500 to 70,500 dollars. If the price pulls back and loses that level, the analysis says the market will again test the core support range at 60,000 to 62,000 dollars. If the price holds firmly above 65,000 dollars, it will challenge the 69,500 to 70,500-dollar resistance zone, which the article marks as an important area for planning a medium-term short position.
The key Bitcoin resistance levels listed in the article are divided into two zones. The first resistance zone is 69,500 to 70,500 dollars, described as a previous area of concentrated trading. The second resistance zone is 72,500 to 74,500 dollars, also described as a previous concentrated trading area. On the support side, the first support is near 65,000 dollars, the second support is the 59,000 to 60,000-dollar region, and the third support is near 55,000 dollars, with the latter two referred to as earlier important support levels.
Bitcoin Position Model: Three Short-Side Plans
The position monitoring model cited in the article shows that Bitcoin has effectively broken below the “long-short channel,” and the technical structure has shifted into a bearish-dominated pattern. Last week’s market did not meet the conditions required by the author’s medium-term short setup, so the medium-term account remains out of the market for now. This week’s plan is built around the result of the battle at 65,000 dollars.
The first plan is to add at a strong resistance area. If Bitcoin successfully holds the 65,000-dollar region and then rebounds into 69,500 to 70,500 dollars with clear signs of resistance, a medium-term short setup can be considered, with total position size controlled below 60%. The second plan is to short a breakdown in line with the trend. If Bitcoin loses 65,000-dollar support and shows an effective breakdown signal, an initial medium-term short position of 30% can be established. The third plan is to add after a further breakdown. If Bitcoin loses 65,000 dollars and also effectively breaks below the 59,000 to 60,000-dollar support range, additional short exposure can be added, while total position size remains below 60%.
The article then details two execution templates. Under the first template, if Bitcoin holds 65,000 dollars and later rises toward 69,500 to 70,500 dollars while showing signs of stalling, and if that is combined with a quantitative model top signal, a short position below 30% can be opened. An initial stop-loss should be set after entry, and when the price falls toward an important support level with model confirmation, the position can be gradually closed to take profit. Under the second template, if Bitcoin loses 65,000 dollars and shows an effective breakdown signal, a short position below 30% can be opened in the direction of the move. The same stop-loss requirement applies, and positions can be reduced or closed gradually when the decline reaches important support levels with model signals.
HYPE: Resistance at 62.5 to 64.57 Dollars
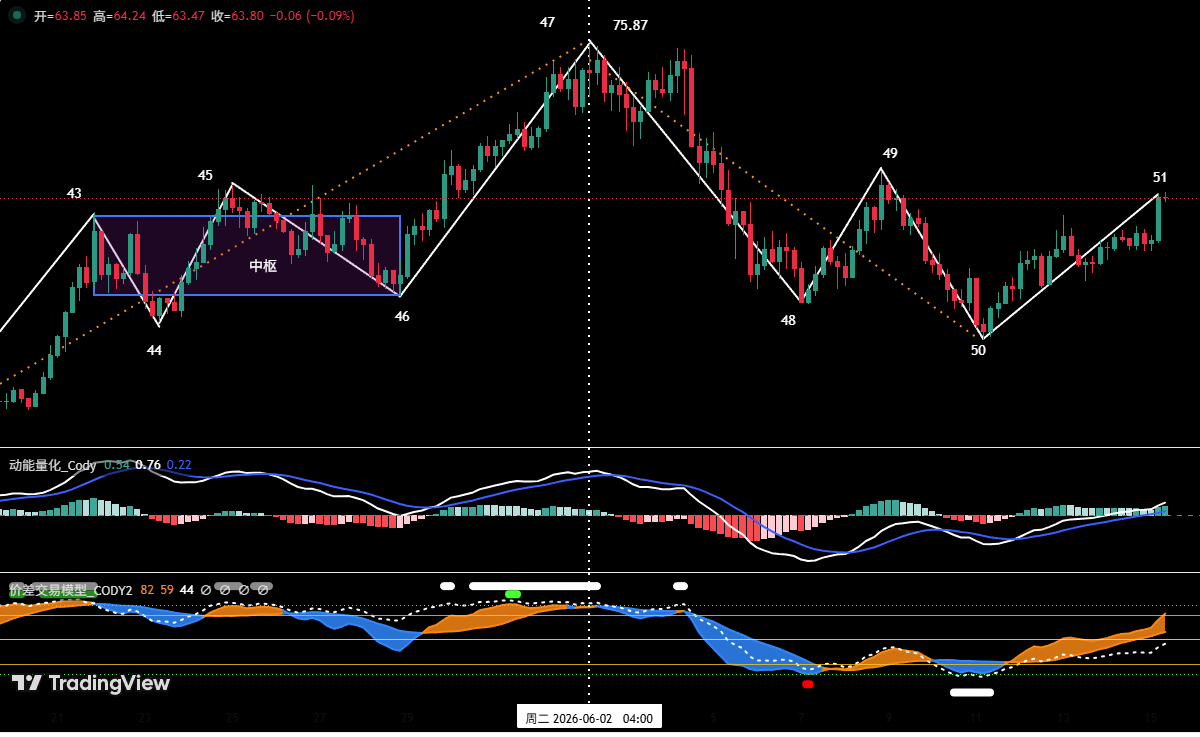
For HYPE, the article uses the four-hour chart to break down the decline from the June 2 high of 75.87 dollars into four corrective legs: 47-48, 48-49, 49-50, and 50-51. The token is currently described as having stabilized and rebounded from the 52-dollar support area, and it is moving through the 50-51 rebound segment. The upper resistance for this rebound is identified at 62.5 to 64.57 dollars.
If endpoint 51 forms a high in the 62.5 to 64.57-dollar area, the analysis says the overall move has a relatively high probability of building a “descending consolidation center” at that location, after which price would continue to search for stronger support below. The first resistance level for HYPE is listed at 62.5 to 64.57 dollars, and the second resistance level is 68 to 70 dollars. The first support level is 52 to 55.5 dollars, while the second support level is 47 to 49 dollars.
The core HYPE view for this week is to observe whether the 62.5 to 64.57-dollar area creates resistance and where the price is located when endpoint 51 forms a high. If HYPE pulls back to 52 to 54.5 dollars, or deeper into the 47 to 49-dollar key support area, and if the price shows signs of stopping its decline and stabilizing, while the two internal models also trigger bottom signals, the article says a small test long can be considered. The position must be kept below 30%, and stop-loss discipline must be followed strictly.

HYPE Short-Term Long Trade Closed With 11.88% Profit
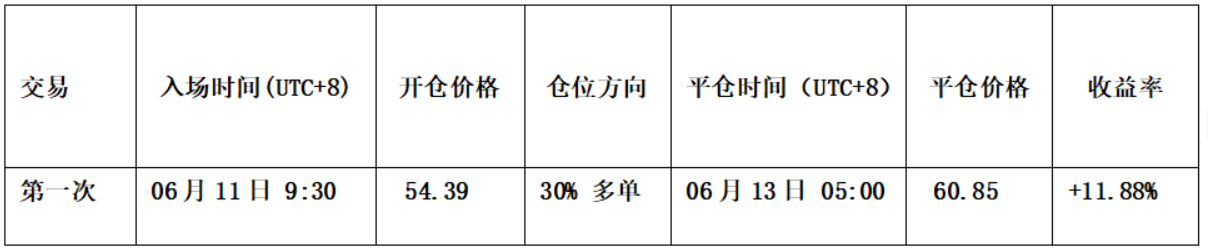
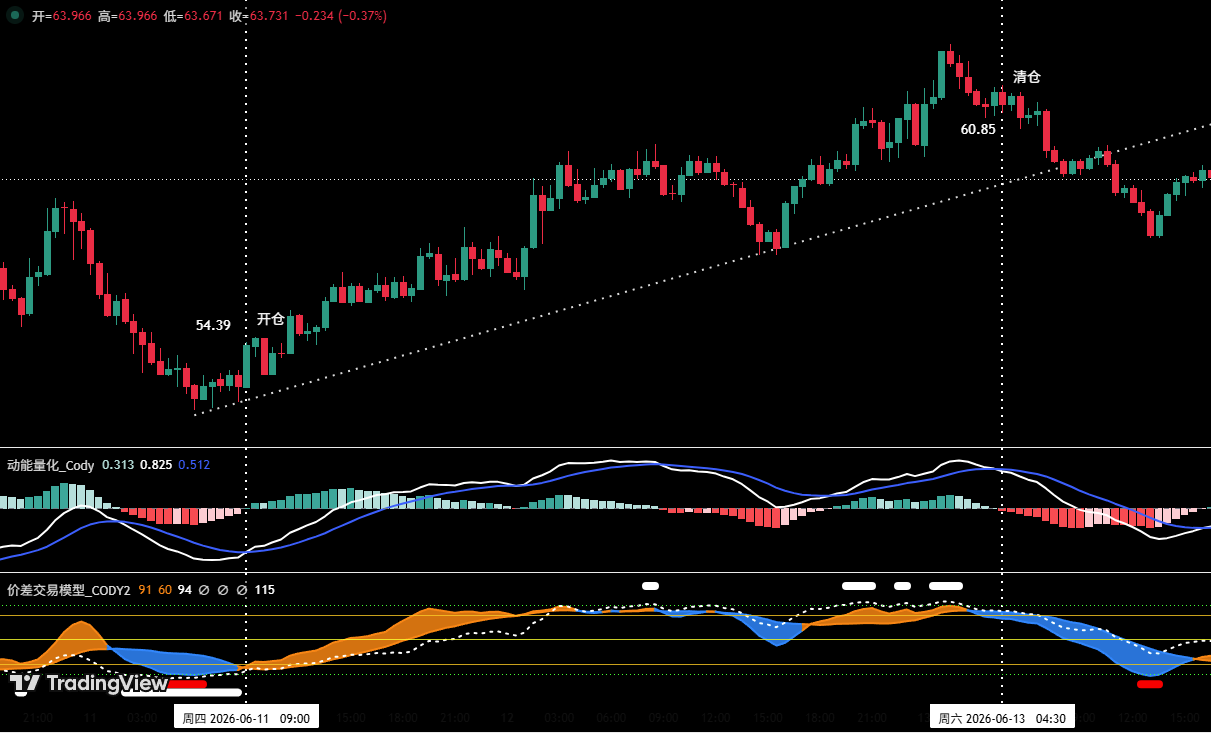
The article also reviews a completed HYPE short-term long trade from last week. Following the pre-set trading plan and using self-built “spread trading model” and “momentum quantitative model” signals, the author completed one short-term long trade with 1x leverage, achieving a profit of about 11.88%. The reasons given for the trade were that HYPE had already completed a relatively full downward corrective structure, the spread trading model had issued strong bottom warning signals in advance, shown by red and white dots on the chart, and the momentum quantitative model had generated a bullish momentum divergence signal.
The exit was also based on model and price behavior. When the HYPE price rose to around 62.5 dollars, it showed a resistance signal. The self-built spread trading model had issued a top warning signal in advance, marked by a white dot on the chart, and the momentum quantitative model had generated a bearish momentum divergence signal. As a result, the article says the position was fully closed near 60.85 dollars. The trade summary states that this operation generated an approximate profit of 11.88%.

The article ends with a specific short-term risk-control checklist. At the time of opening a position, an initial stop-loss should be set immediately. When profit reaches 1%, the stop-loss should be moved to the entry cost, or the break-even point, to protect principal. When profit reaches 2%, the stop-loss should be moved to a level that locks in 1% profit. After that, for every additional 1% gain in the token price, the stop-loss should move up by another 1%, creating a dynamic protection mechanism. The original article states that financial markets change rapidly, and all market analysis and trading strategies must be adjusted dynamically. It also states that all views, analytical models, and operating strategies in the article come from personal technical analysis, are only for use as a personal trading log, and do not constitute investment advice or an operating basis. Market risk remains, and investors should act cautiously and not make decisions based on the article alone.