

This week’s market setting was described as unusually complex, with the U.S.-Iran agreement landing beyond expectations and the reopening of the Strait of Hormuz triggering a sharp repricing across global assets. Against that backdrop, the original analysis argues that strong sentiment swings are exactly the type of environment in which structural analysis, position models and predefined trading plans carry greater practical value. The article focuses on Bitcoin’s hourly and four-hour structure, BTC medium- and short-term trading plans, HYPE’s hourly structure, HYPE’s short-term trading plan, and a review of last week’s HYPE long trade.
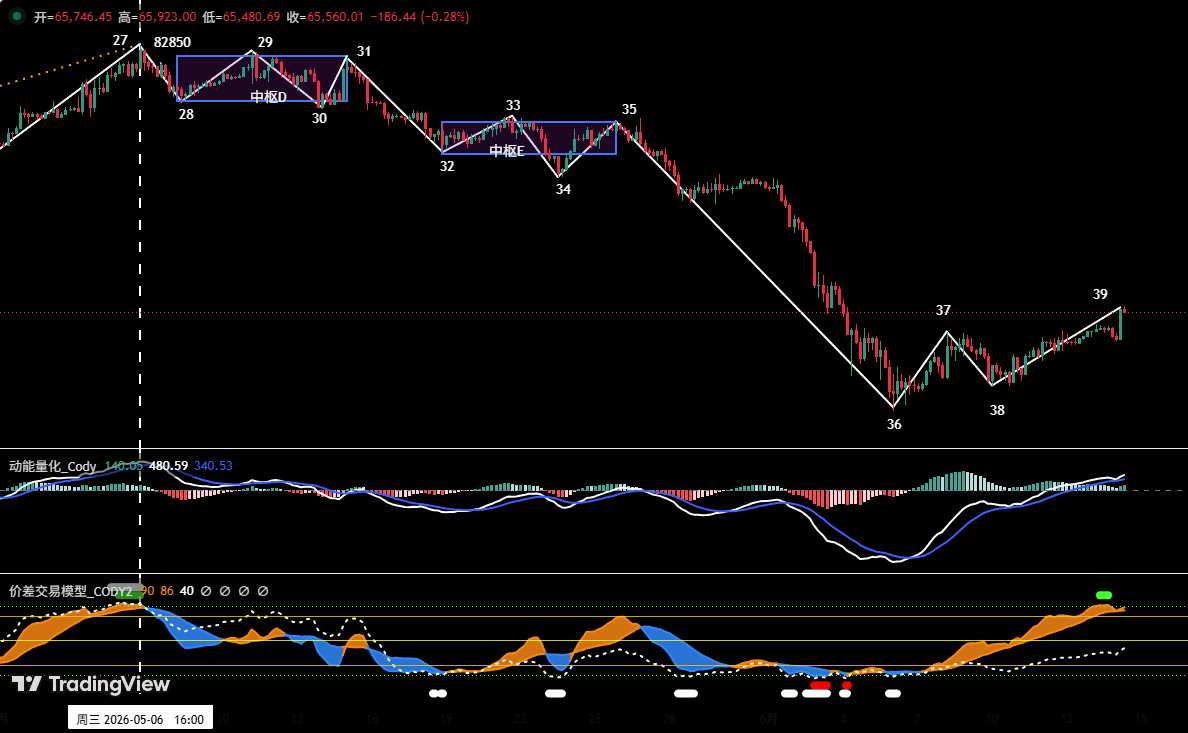
For Bitcoin, the article notes that last week’s view was validated by the latest price action. The previous analysis stated that after BTC briefly broke below the $60,000 level, it would find support and start a short-term rebound in order to confirm the effectiveness of the breakdown around an important level. According to the latest review, the current market action has moved in line with that prior assessment.
On the four-hour chart, Bitcoin’s decline from the May 6 high of $82,850 can be divided into a 12-leg corrective structure. The structure includes two downward consolidation zones, referred to as center D and center E. The overall pattern is described as clear and consistent with a complex correction. At present, BTC is said to be running the 38-39 rebound leg, and the price has already moved back above $65,000.
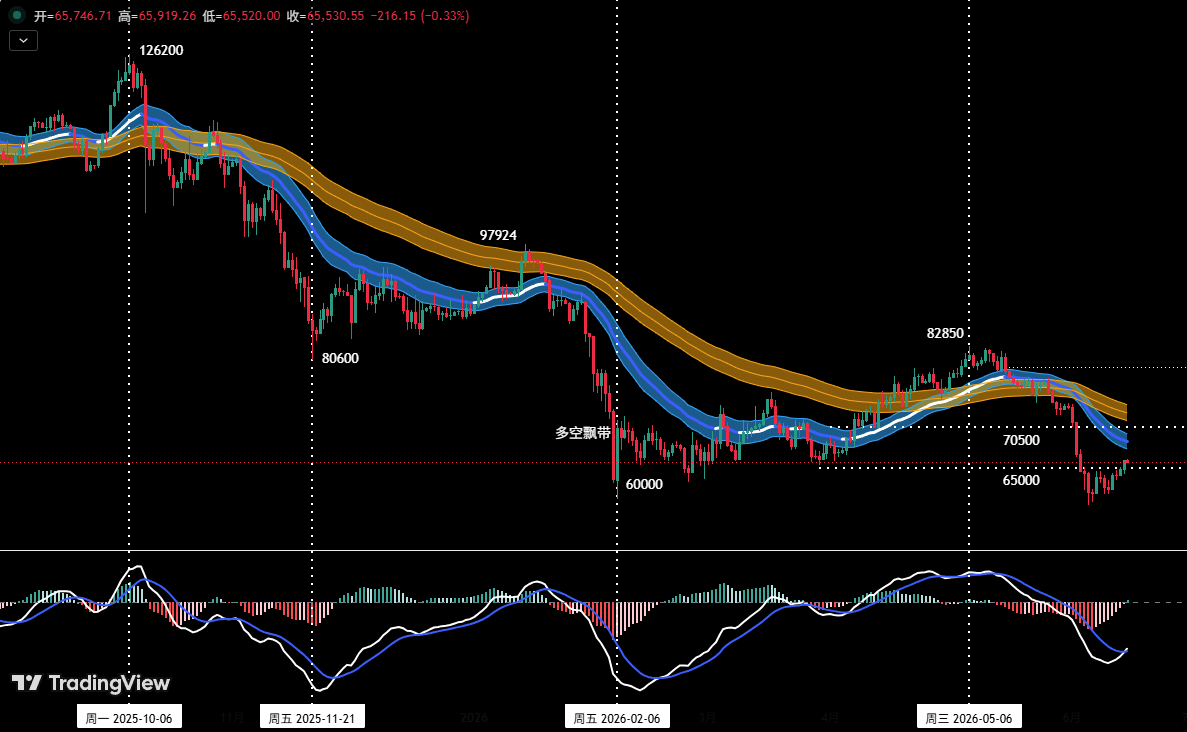
If the move above $65,000 is confirmed as effective, the next important resistance zone for the rebound is identified at $69,500 to $70,500. If BTC pulls back and loses that level, the analysis says the market would return to the $60,000 to $62,000 core support range. The key resistance zones listed in the article are $69,500 to $70,500 as the first resistance area and $72,500 to $74,500 as the second resistance area, both of which correspond to earlier dense transaction regions. The key support levels are around $65,000, then $59,000 to $60,000, and finally around $55,000.
The position monitoring model shows that Bitcoin has effectively broken below the “long-short channel,” and the technical structure has shifted into a short-dominated setup. Because last week’s market conditions did not meet the predefined medium-term short-entry plan, the article states that the medium-term position remains empty for now. This week’s BTC strategy is built around the battle at $65,000 and is divided into several execution paths.
The first path is to add shorts at strong resistance. If BTC successfully holds above the $65,000 area and later rebounds into the $69,500 to $70,500 range with clear signs of pressure, the plan allows for a medium-term short setup, with total position size kept below 60%. The second path is to short in the direction of a breakdown: if BTC loses $65,000 support and shows an effective breakdown signal, an initial medium-term short position of up to 30% can be established. The third path is to add to shorts after a deeper breakdown: if BTC loses $65,000 and then effectively breaks below the $59,000 to $60,000 support range, short exposure can be increased, while total position size remains below 60%.
In the more detailed execution plan, if BTC holds the $65,000 region and then rebounds toward $69,500 to $70,500, a short position below 30% can be opened when price stagnation appears and the quantitative model also gives a top signal. An initial stop-loss should be set. When the market declines toward important support and model signals appear, the position can be gradually closed to lock in profit. Under the alternative plan, if BTC loses $65,000 support and gives an effective breakdown signal, a short position below 30% can be opened in the direction of the move, again with an initial stop-loss and a staged exit near important support levels when model signals support the exit.
For HYPE, the article says last week’s forecast was also aligned with current market action. The earlier view was that when HYPE retested the $55 to $57 key support area and showed signs of stopping its decline and stabilizing, while two models also triggered bottom signals, a light long position could be considered. The current trend is described as highly consistent with that view.
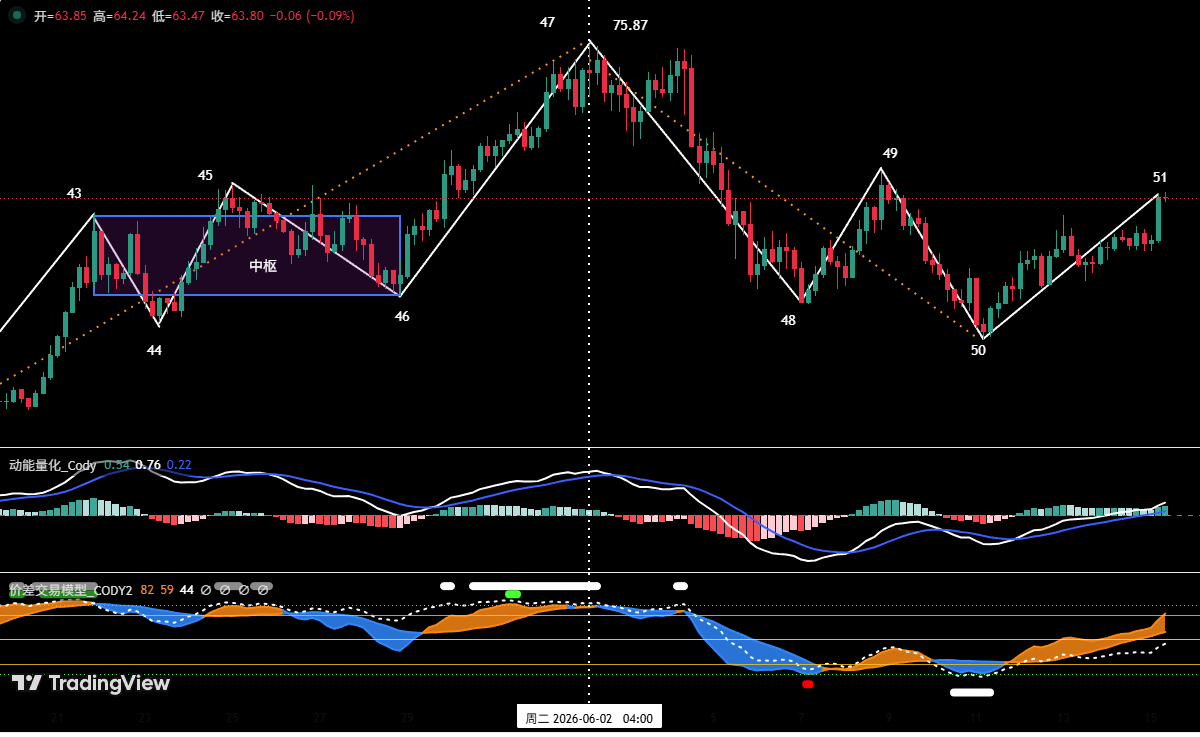
On the four-hour chart, HYPE’s correction from the June 2 high of $75.87 can be divided into four corrective segments: 47-48, 48-49, 49-50 and 50-51. HYPE has now stabilized and rebounded from the $52 support region, and is in the 50-51 rebound segment. The resistance above is located at $62.5 to $64.57. If endpoint 51 forms a high in that region, the article says the broader structure has a relatively high probability of building a downward consolidation zone there, after which the price will continue to search for stronger support.
The HYPE resistance and support levels are clearly listed. The first resistance zone is $62.5 to $64.57, while the second resistance zone is $68 to $70. The first support zone is $52 to $55.5, and the second support zone is $47 to $49. For this week, the main HYPE focus is the degree of pressure at $62.5 to $64.57 and the exact location where endpoint 51 forms its price high.
The short-term HYPE plan states that if the price retests $52 to $54.5, or the deeper key support region of $47 to $49, and then shows signs of stabilizing, a light test long can be considered when both the self-built “spread trading model” and the “momentum quantitative model” trigger bottom signals. The position must be controlled below 30%, and stop-loss discipline must be strictly observed.

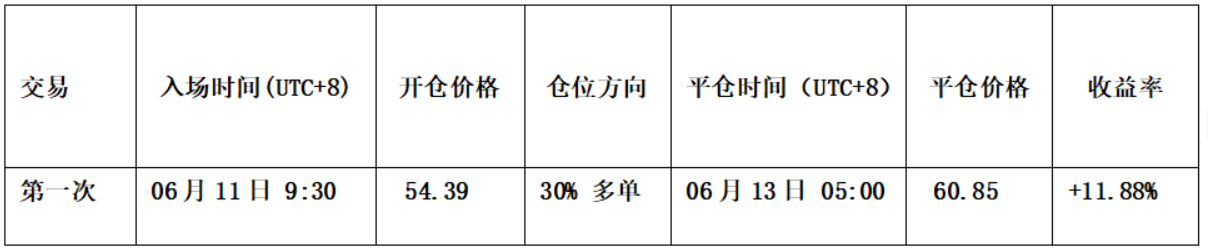
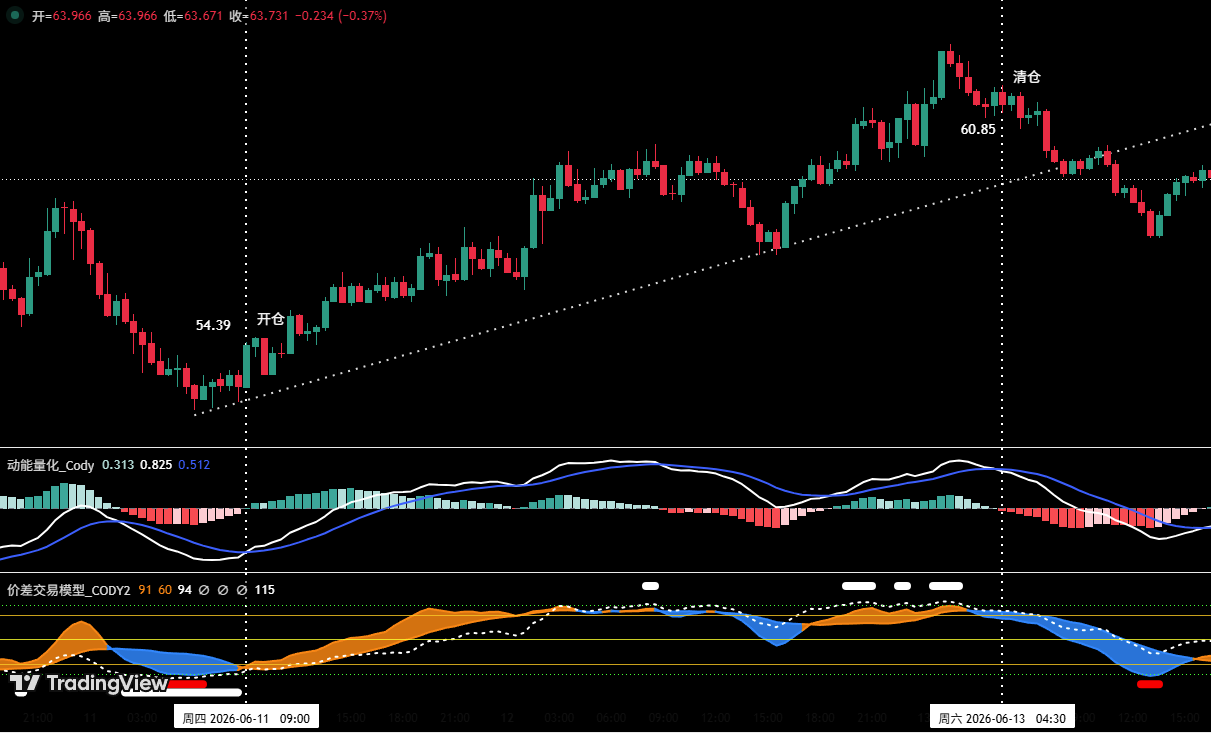
The article also reviews the most recent HYPE short-term trade. Following the preset plan and the signals from the self-built spread trading model and momentum quantitative model, the team completed one short-term long trade last week with a profit of 11.88%. The basis for entering the trade included a relatively complete prior downward corrective structure, an early strong bottom warning from the spread trading model, marked by red and white dots on the chart, and a bullish momentum divergence signal from the momentum quantitative model.
The exit was also model-based. When the price rose toward $62.5, resistance signals appeared. The spread trading model issued an early top warning signal, marked by a white dot on the chart, while the momentum quantitative model showed a bearish momentum divergence signal. As a result, the position was fully closed near $60.85. The article summarizes that this trade generated a profit of about 11.88%.

The final risk reminder in the original analysis emphasizes immediate stop-loss placement after opening a position. When profit reaches 1%, the stop-loss should be moved to the entry price to protect principal. When profit reaches 2%, the stop-loss should be moved to the level that secures a 1% gain. After that, for each additional 1% gain in price, the stop-loss should be moved by another 1% to dynamically protect the position. The article states that financial markets change rapidly, all analysis and strategies must be adjusted dynamically, and all views, models and trading plans are personal technical analysis for trading-log purposes only. They do not constitute investment advice or an operational basis, and readers are reminded that markets involve risk and investment decisions require caution.