

This week’s market setting was described as unusually complex. The U.S.-Iran agreement landed beyond expectations, and the reopening of the Strait of Hormuz triggered a sharp repricing across global assets. Against that backdrop, the original analysis argued that intense swings in sentiment are exactly the kind of environment in which a structured technical framework becomes more useful. The article focuses on Bitcoin and HYPE, covering BTC’s hourly structure, this week’s expected path and medium- to short-term trading plans, HYPE’s hourly structure, HYPE’s short-term trading strategy, and the result of a short-term HYPE long trade completed last week.
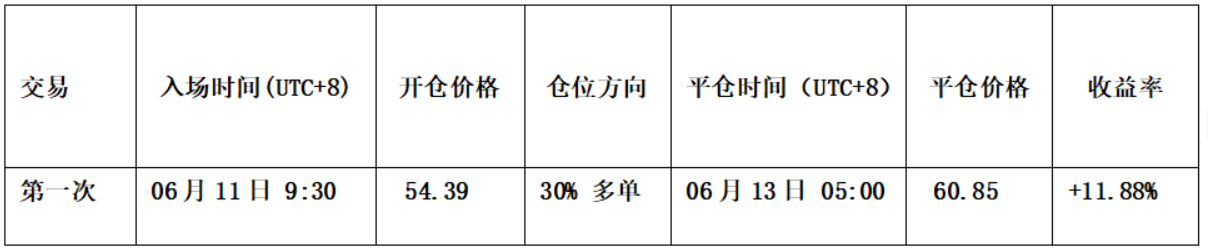
The core review begins with two market validations from the prior week. For Bitcoin, the previous article stated that after the price briefly fell below the $60,000 mark and found support, it would stage a short-term rebound to confirm the validity of the breakdown below an important level. The current move has verified that earlier view. For HYPE, the previous article stated that when price retested the key $55 to $57 support area and showed signs of stopping the decline and stabilizing, and when two models also triggered bottom signals, a light long position could be considered. The current HYPE path has closely matched that plan. The analysis also records that a short-term HYPE long trade with 1x leverage was completed last week, generating a gain of about 11.88%.
Bitcoin: 12-leg correction and the $65,000 decision area
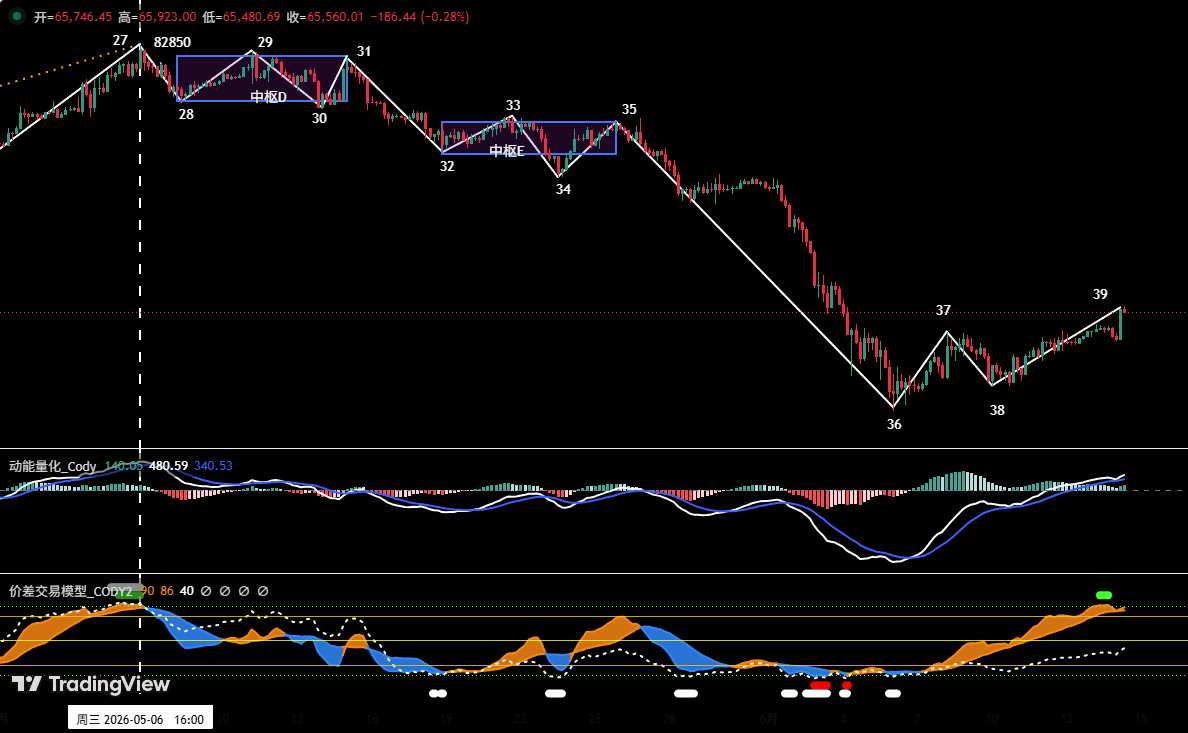
In the four-hour Bitcoin chart shown as Figure 1 in the source material, the decline from the May 6 high of $82,850 can be subdivided into a 12-leg corrective structure. That structure contains two downward centers, labeled center D and center E. The overall pattern is presented as a clear and complex correction. From the four-hour structure, Bitcoin is currently running the 38-39 rebound leg, and the price has already moved above $65,000. If the later breakout is confirmed as effective, the next major resistance for the rebound sits in the $69,500 to $70,500 area. If a pullback loses that level, the market would return to test the core support zone of $60,000 to $62,000.
The article sets out two major BTC resistance zones and three major support zones. The first resistance zone is $69,500 to $70,500, described as a prior high-volume transaction area. The second resistance zone is $72,500 to $74,500, also linked to a prior high-volume transaction area. On the support side, the first support level is near $65,000. The second support zone is $59,000 to $60,000, identified as an important prior support area. The third support level is near $55,000, also described as an important former support level.
BTC position model and three short-position plans
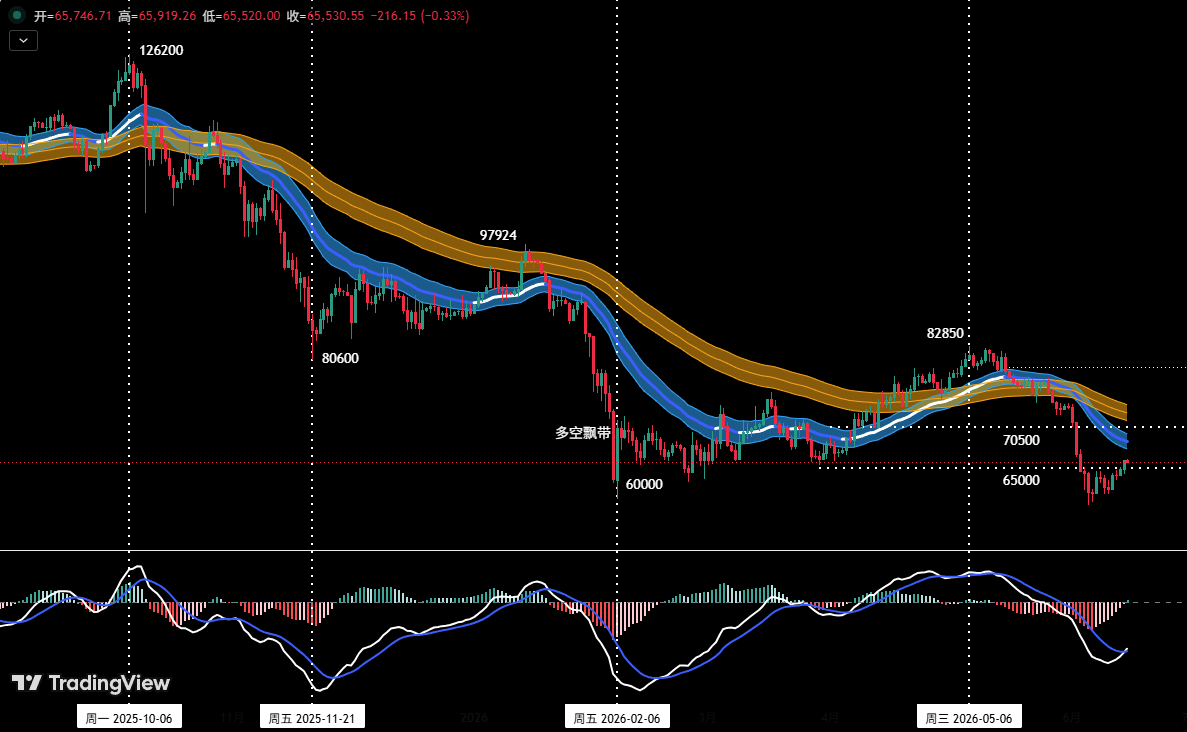
The position monitoring model, shown as Figure 2 in the source material, indicates that the current Bitcoin price has effectively fallen below the “long-short channel,” and the technical structure has shifted into a short-dominated setup. Last week’s market did not meet the predefined short-position plan, so the medium-term position remains temporarily empty. For this week, the article proposes building short exposure step by step based on the result of the contest around $65,000.
The first plan is to add in a strong resistance zone. If Bitcoin successfully holds the $65,000 area and then rebounds to the $69,500 to $70,500 area, and if clear signs of pressure appear there, a medium-term short position can be considered, with total position size kept below 60%. The second plan is trend-following shorting after a breakdown. If price loses the $65,000 support and shows an effective breakdown signal, an initial medium-term short position of 30% can be opened. The third plan is shorting further after another breakdown. If Bitcoin loses $65,000 and then effectively breaks below the $59,000 to $60,000 support zone, additional short exposure can be added with the total position still controlled below 60%.
The operational details are repeated more specifically. If the price stands firmly above $65,000 and later rebounds toward $69,500 to $70,500 while showing stagnation signals, and if that is combined with a top signal from the quantitative model, a short position of less than 30% can be arranged. Risk control requires setting an initial stop-loss level immediately. For closing the position, when the market adjusts to an important support level and the model also gives a signal, positions can be reduced step by step to realize profit. In the alternative execution path, if Bitcoin loses $65,000 and gives an effective breakdown signal, a short position below 30% can be opened with the same initial stop-loss requirement. When the decline reaches an important support level and is combined with a model signal, the position can be gradually closed.
HYPE: the 51 endpoint and the $62.5-$64.57 resistance band
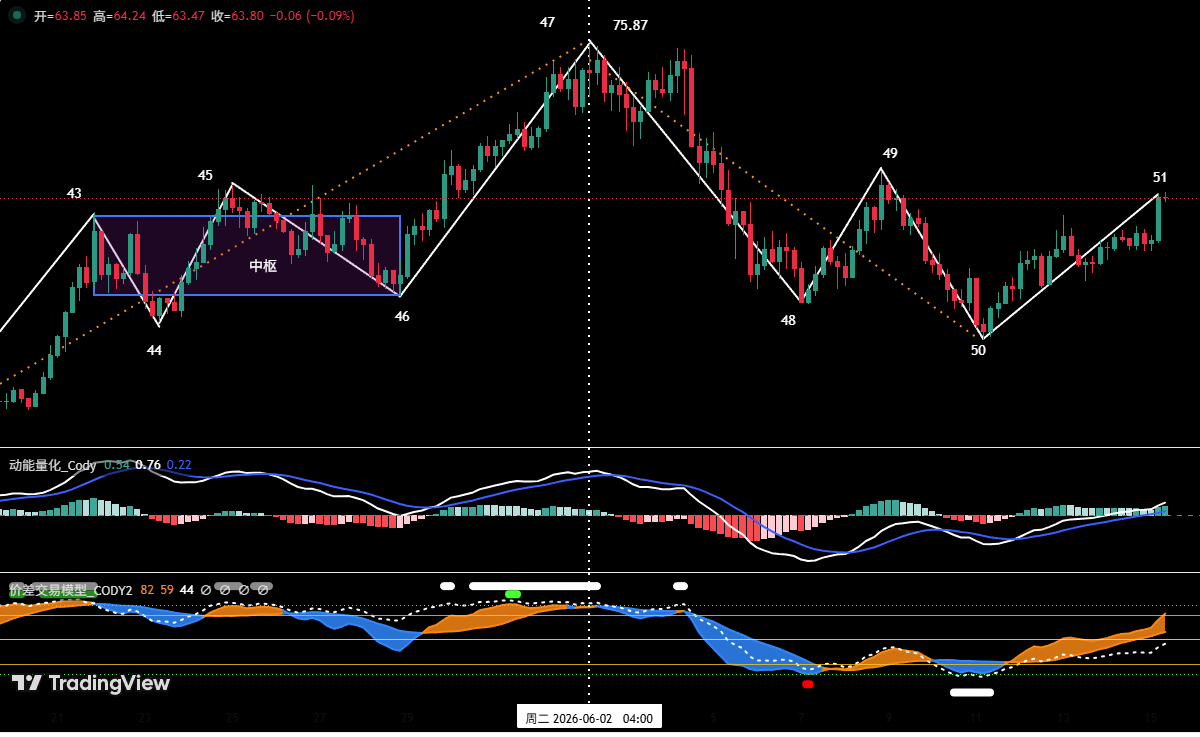
For HYPE, Figure 3 in the source material looks at the four-hour cycle. Since the June 2 high of $75.87, HYPE’s decline can be subdivided into four corrective legs labeled 47-48, 48-49, 49-50, and 50-51. At present, HYPE has stabilized and rebounded from the $52 support area, and it is in the 50-51 rebound leg. The resistance above is located in the $62.5 to $64.57 area. If endpoint 51 forms a price high in that area, the original analysis states that the broader move has a relatively high probability of building a “downward center” there, after which price would continue to look for strong support lower down.

The HYPE levels are defined as follows. The first resistance zone is $62.5 to $64.57, while the second resistance zone is $68 to $70. The first support zone is $52 to $55.5, and the second support zone is $47 to $49. The core HYPE view for the week is to observe the pressure effect in the $62.5 to $64.57 area and to track the location at which endpoint 51 forms a price high. When HYPE retests $52 to $54.5, or the deeper key support zone of $47 to $49, and when it shows signs of stopping the decline and stabilizing, a light test long can be considered if the two models also trigger bottom signals. The position must be kept below 30%, and the stop-loss discipline must be strictly followed.
Completed HYPE long trade and stop-loss movement rules
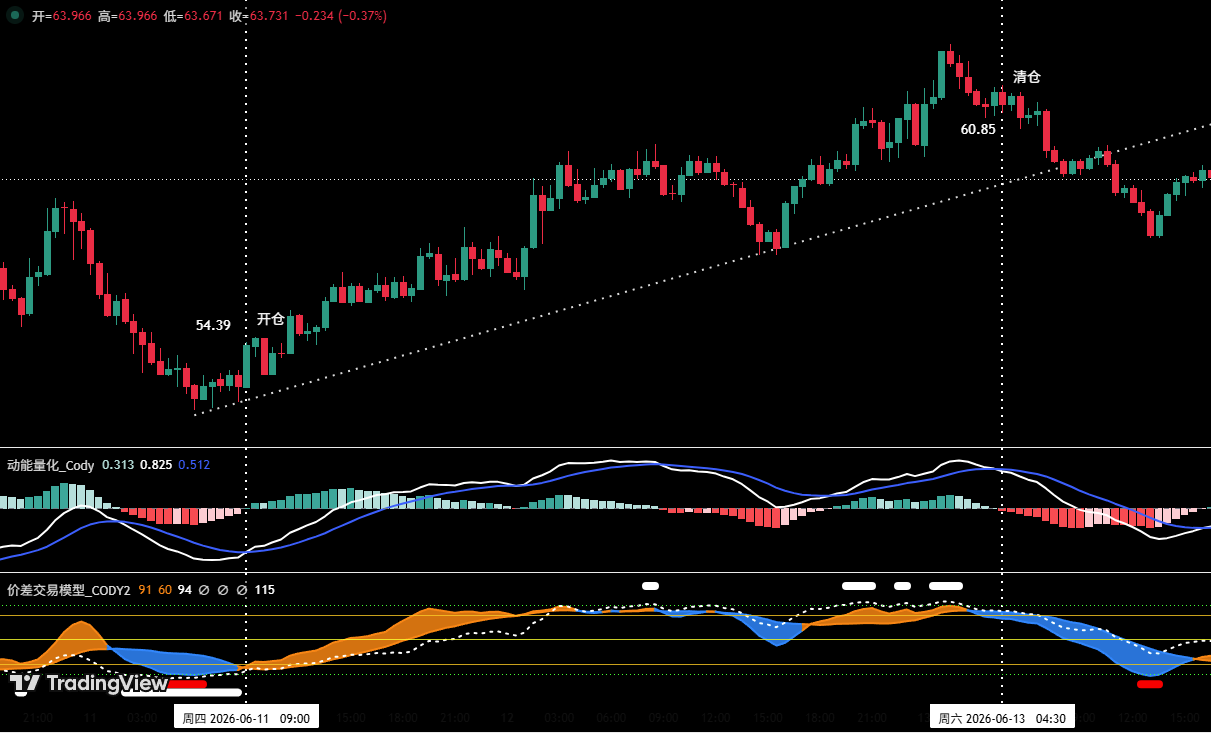
The article states that the trading plan was followed strictly, using signals from the self-built “spread trading model” and “momentum quantitative model.” Based on those signals, one short-term HYPE long trade was completed last week, with a trading profit of 11.88%. The trade setup was supported by several conditions: an earlier relatively complete downward correction structure had already run; the self-built spread trading model had given strong bottom warning signals in advance, marked by red and white dots in the chart; and the self-built momentum quantitative model had given a bullish momentum divergence signal. When the price rose to near $62.5, it showed signs of resistance. At that point, the spread trading model had already issued a top warning signal, shown by a white dot, and the momentum quantitative model had given a bearish momentum divergence signal. Therefore, the position was fully closed near $60.85. The HYPE 30-minute K-line chart in the source material is used to display the short-term trade with the momentum quantitative model and the spread trading model.

The final section gives specific stop-loss management rules. When opening a position, an initial stop-loss should be set immediately. When profit reaches 1%, the stop-loss should be moved to the opening cost price, or breakeven, to protect principal. When profit reaches 2%, the stop-loss should be moved to the level that locks in 1% profit. After that, for every additional 1% gain in price, the stop-loss should also be moved by 1%, dynamically protecting and locking in gains. The article closes with a risk reminder: financial markets change rapidly, and all market analysis and trading strategies must be adjusted dynamically. All views, analytical models, and operating strategies in the article come from personal technical analysis and are used only as a personal trading log. They do not constitute investment advice or an operational basis. Markets involve risk, and investors should act cautiously and not make decisions based on the article alone.