

Two short-term trades delivered a combined 6.93% gain last week
MarsBit featured analyst Conaldo used his latest weekly note to review Bitcoin trading from Dec. 1 to Dec. 7, saying his quantitative trading framework completed two short-term trades last week with a combined return of 6.93%. His core view for the period was that $89,000 should be treated as the main bull-bear dividing line. If that level held, BTC could stage a rebound. If it broke decisively, the market would likely move into another leg lower.
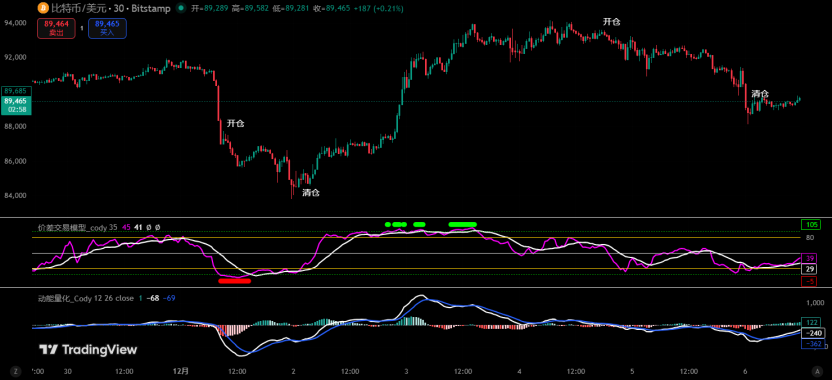
Based on that framework, Conaldo’s key resistance zones last week were $94,000-$96,500 and $98,500-$100,000. On the downside, he focused on support near $89,000, then the $85,500-$88,000 area, followed by a more important support level near $80,500. In positioning terms, he kept roughly 65% of his medium-term exposure in short positions, while using the behavior around $89,000 to guide his short-term execution.
The first trade came after BTC broke below the key $89,000 threshold. Conaldo said he opened a 20% short position at $87,103 and later took profit near $84,989, generating a 2.14% gain. The second trade followed a rebound after support held around $89,000. Once the market moved into the first resistance area, he opened a 10% short at $93,321 and exited near $89,355, locking in a 4.44% gain.
According to the report, both trades were executed strictly within pre-defined entry, stop-loss and take-profit rules. Conaldo argued that the result supported the effectiveness of his strategy framework, especially the discipline of following a breakdown and fading a rebound into resistance rather than reacting emotionally to volatility.
Bitcoin swung sharply but ended the week almost flat
On a weekly basis, Bitcoin opened at $90,369, dropped as low as $83,814, rose to a weekly high of $94,172 and closed at $90,405. That left BTC up just 0.03% for the week, despite a maximum swing of 12.36% and reported turnover of $13.429 billion. The weekly candle was described as a doji with upper and lower shadows, reflecting a violent but indecisive range.
The path of the week was highly uneven. After the Monday open, BTC fell quickly and broke below $89,000, reaching $83,814 before stabilizing. It then staged a sharp rebound over the next two trading days, fully recovering the earlier losses and pushing to a weekly high of $94,172. Midweek, however, momentum faded again and the market slipped back, eventually entering a narrower consolidation into the weekend.

Conaldo emphasized that the weekly high of $94,172 came very close to the lower boundary of his previously identified first resistance zone at $94,000-$96,500, missing it by only $172. In his view, that alignment reinforced the usefulness of the resistance map laid out in advance.
Weekly and daily models both point to fading rebound strength
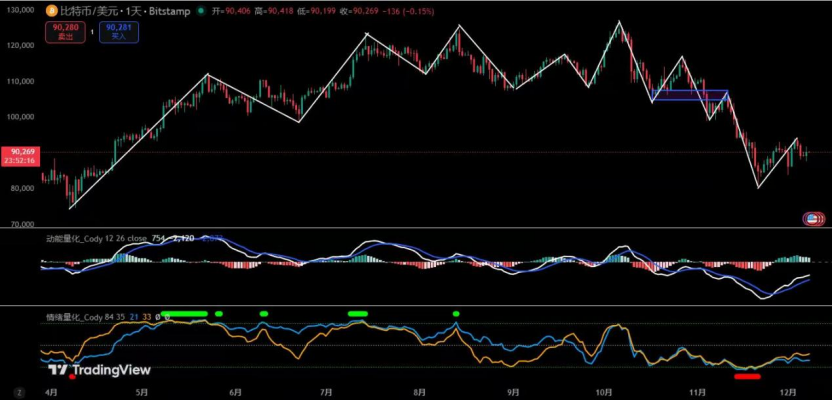
On the weekly chart, Conaldo’s momentum quant model showed that both momentum lines continued to trend lower. The white momentum line has stayed below the zero axis for three weeks, while the blue line is close to crossing below it as well. Although the negative energy bars have shortened after two weeks of oversold rebound activity, he argued that bulls now need a much stronger recovery to pull momentum back above zero. Otherwise, sellers may regain control and release more downside pressure.
His weekly sentiment quant model showed the blue sentiment line at 52.08 and the yellow sentiment line at 33.53, with both intensity readings at zero. The digital monitoring model showed no active numerical signal. Taken together, he interpreted the data as broadly neutral in terms of support and resistance pressure, but still bearish in trend terms. His conclusion was that Bitcoin remains in a declining structure and that the weekly timeframe is close to entering a bear-market phase.
On the daily chart, the momentum model showed both lines continuing to rise from below the zero axis after the rebound, but the energy bars have gradually shortened. That, in his interpretation, means the recent rebound is losing strength. The daily sentiment model printed a blue line reading of 21 and a yellow line reading of 32, again with zero intensity. Conaldo therefore maintained that the daily timeframe is still in a bearish market structure and that the recent move should be treated more as an oversold bounce than a confirmed reversal.
Key range for this week centers on $91,000 and $87,500
For the period from Dec. 8 to Dec. 14, Conaldo expects Bitcoin to remain mostly range-bound. He divided the near-term structure into four major levels: $94,200, $91,000, $87,500 and $83,500. In his view, BTC is currently oscillating in a relatively narrow band between $91,000 and $87,000, and the next directional move will likely emerge from that compression.
His stated resistance levels for the week are $91,000 as the first cap, then the $94,000-$96,500 area, followed by the more important $98,500-$100,000 zone. On the downside, he identifies support in the $85,500-$87,500 area, then at $83,500, with a stronger support zone near $80,000. The broader message remains cautious: if rebounds fail to break overhead resistance decisively, BTC could still retest lower support areas.

Strategy remains centered on medium-term shorts and short-term spread trades
In terms of positioning, Conaldo said he is keeping roughly 65% of his medium-term exposure in short positions. For short-term trades, he plans to use 30% of capital with explicit stop-loss settings, focusing on “price spread” opportunities based on support and resistance on the 60-minute and 240-minute timeframes.
Under scenario A, if Bitcoin starts the week by grinding higher, his preferred setup is to fade the rebound. He would open a 15% short if price rebounds into the $91,000-$94,200 zone and shows signs of rejection. If BTC extends higher toward $98,500 and meets resistance again, he would add another 15% short. All shorts in this setup would share a stop above $100,000. If the market then rolls over and finds support near the first support zone, he would take profit on half the position. If price continues lower into the second support area, he would close the remainder.
Under scenario B, if BTC breaks effectively below $87,500 early in the week and moves lower, he would switch to a “deep drop, rebound trade” approach. In that case, if price falls into the $83,500-$80,000 area and a reversal signal appears, he would open a 15% long position with a stop below $80,000. If BTC then rebounds into the $87,500-$88,000 area and runs into resistance, he would close the full long position to realize gains.
Risk management rules rely on dynamic stop-loss adjustments
Conaldo also laid out a clear trailing stop framework. He said an initial stop should be placed immediately after entry. Once the trade reaches a 1% gain, the stop should be moved to breakeven. When profit reaches 2%, the stop should be raised to lock in a 1% gain. After that, for every additional 1% of profit, the stop should move up by another 1% as well. He added that the exact threshold can be adjusted depending on an investor’s own risk tolerance and the volatility of the traded asset, but the core objective is to protect open profits from turning into losses.
Fed decision, dot plot and Powell remarks are the main external catalysts
Beyond chart structure, Conaldo argued that macro conditions will be critical this week. Global markets are entering what he described as a year-end “super central bank week,” with the main focus on the Federal Reserve’s December rate decision, the updated dot plot and remarks from Chair Jerome Powell. The market is widely expecting a rate cut at this meeting, but Conaldo said the real driver for risk assets, including Bitcoin, will not be the cut itself. Instead, it will be the Fed’s guidance on the 2025 rate path.
He noted that other macro data points will also be watched, including U.S. JOLTS job openings, China’s CPI and social financing data, and U.K. GDP and euro area CPI. Still, he sees those releases as secondary compared with the Fed meeting, because markets are effectively waiting for the Fed to clarify whether easing expectations for next year are justified.
If the dot plot comes in hawkish and implies only zero to one rate cuts in 2025, Conaldo believes markets could quickly reprice away from current easing assumptions. That could push Treasury yields and the U.S. dollar higher, pressure risk assets in the short term and potentially send BTC back toward the $85,000 area. If the dot plot is dovish and points to at least two cuts in 2025, he expects the easing cycle narrative to strengthen, which could trigger a fast rebound in risk assets and allow Bitcoin to challenge levels back above $90,000.
He added that Powell’s wording will matter as much as the headline decision. Any emphasis on sticky inflation or the need to keep policy restrictive for longer could amplify near-term volatility across crypto and broader risk markets.
Capital flows remain cautious ahead of the policy meeting
From a flow perspective, Conaldo described the market as compressed and directionless for now. Bitcoin failed to reclaim $90,000 convincingly over the weekend, but trading volume also fell sharply. In his reading, that suggests turnover has slowed and retail sentiment remains relatively stable rather than panicked. At the same time, institutional capital appears to be reducing exposure ahead of the Fed event, with no sign last week of aggressive accumulation or broad liquidation.
His broader conclusion is that BTC’s immediate path this week will be determined less by sentiment alone and more by whether the Fed’s guidance matches or diverges from market expectations. A dovish signal could support a year-end rebound, while a hawkish message may trigger another short-term pullback. For now, he continues to favor a cautious stance and warns traders not to mistake a temporary rebound for a completed trend reversal, as Bitcoin may still need to retest key lower support zones.