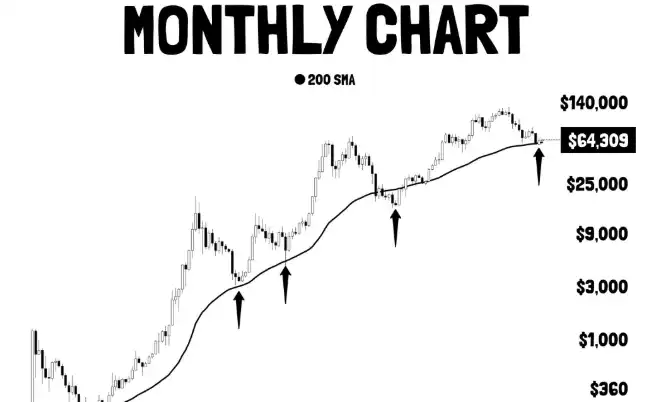
Bitcoin may already be carving out a macro bottom, according to crypto analyst Alicharts, who pointed to three long-term signals in a post cited by BlockBeats on Aug. 7. The first is a TD Sequential buy signal on Bitcoin’s monthly chart, a relatively rare setup that previously marked the 2022 market bottom. The second is Bitcoin trading near its 50-month simple moving average, a level Alicharts said has repeatedly lined up with major bottoms since 2014. The third is the Chande Momentum Oscillator, or CMO, falling to -71. Alicharts noted that the last time the indicator reached that level was in June, when Bitcoin dropped toward $57,000. Historically, such depressed readings have often appeared near major bottoms. The report also explained that the CMO measures the relative strength of upward and downward price momentum over a given period and is commonly used to assess whether a market is overbought or oversold, as well as the strength of the prevailing trend.
Bitcoin may have already formed a macro bottom, crypto analyst Alicharts said in a post cited by BlockBeats on Aug. 7, pointing to three long-term indicators.
Three long-term signals cited
First, a TD Sequential buy signal has appeared on Bitcoin’s monthly chart. Alicharts said the signal is relatively rare and previously marked the 2022 market bottom, adding that it may now be pointing to a similar bottom again.
Second, Bitcoin is hovering near its 50-month simple moving average. According to Alicharts, that multi-year support level has coincided with major market bottoms several times since 2014.
Third, the Chande Momentum Oscillator, or CMO, has dropped to -71. Alicharts said the last time the indicator reached that level was in June, when Bitcoin fell toward $57,000. Historically, readings this low have often lined up with major bottoms.
What the CMO measures
The report added that the Chande Momentum Oscillator measures the relative strength of upward and downward price momentum over a given period. It is used to help judge whether the market is in overbought or oversold territory, as well as the strength of the trend.
This article was originally published by Bit.Fan. For more cryptocurrency news and market insights, visit www.bit.fan. Disclaimer:
The market information, project data, and third-party content displayed on this platform are for industry information sharing only and do not constitute any form of investment advice or return commitment.
Cryptocurrency trading carries high risks. Users should fully assess their risk tolerance and make independent decisions. All profits, losses, and legal responsibilities are borne by the users themselves.