
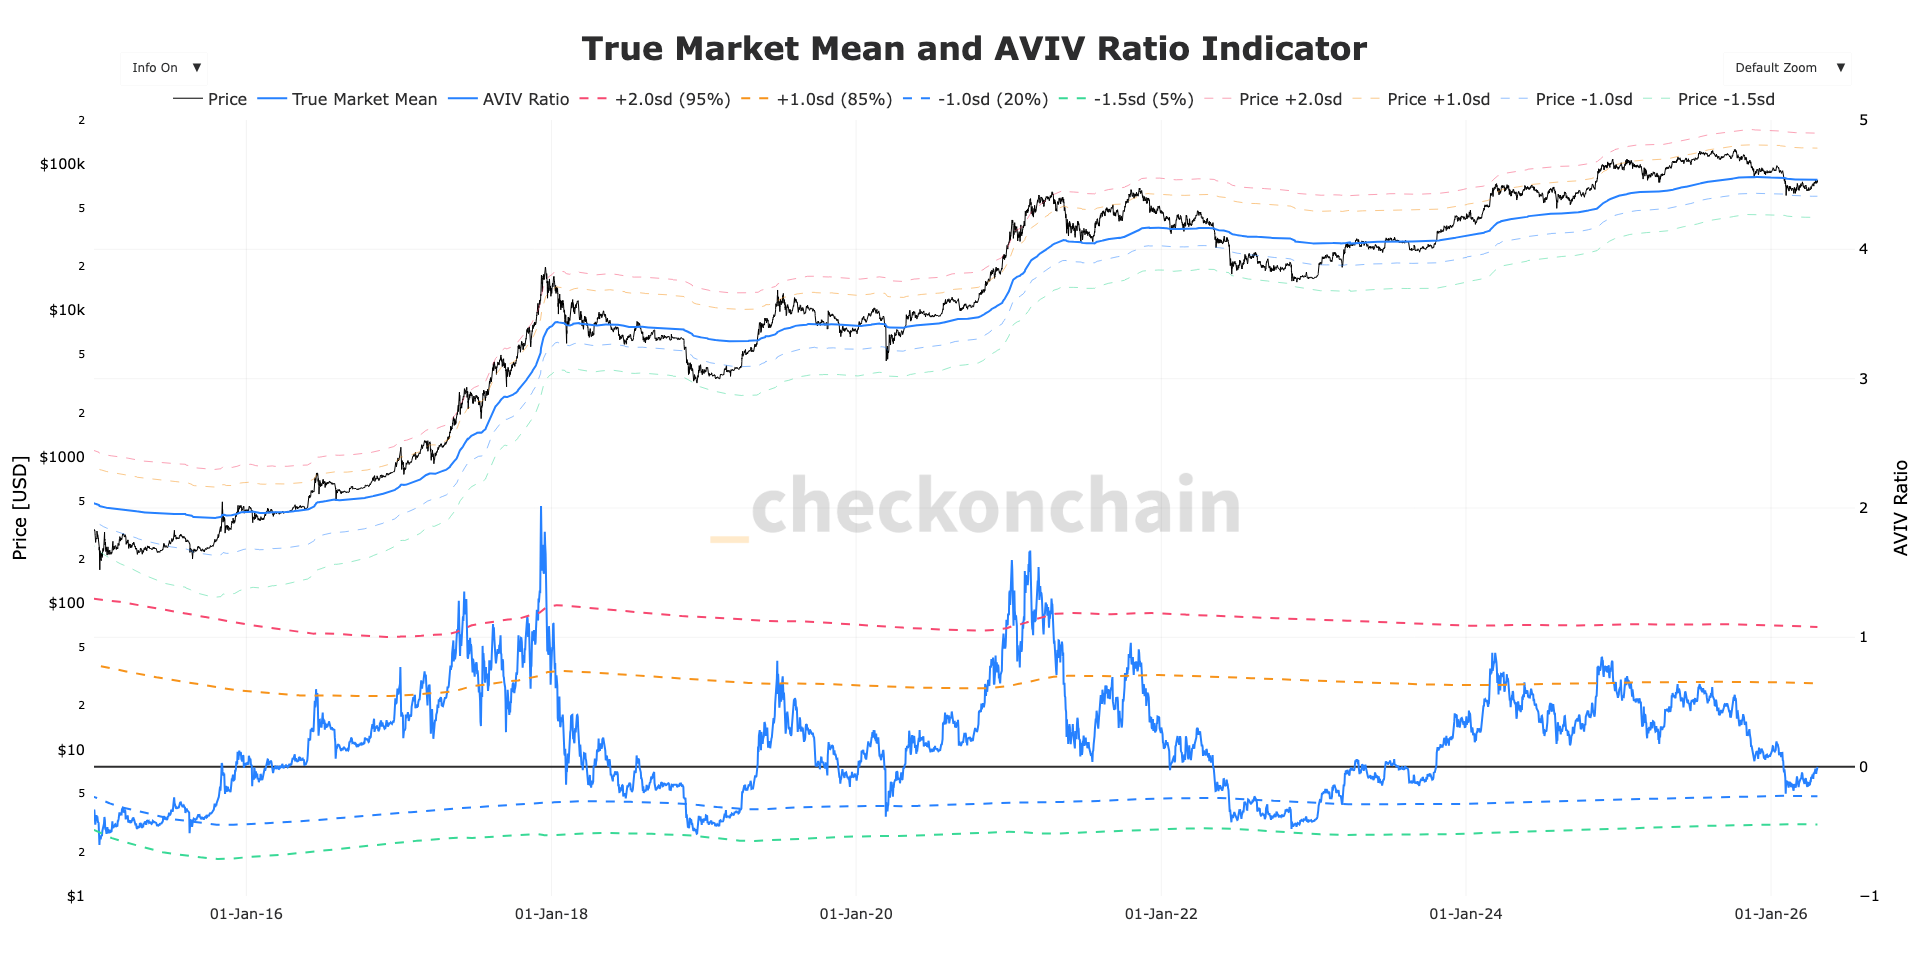
Bitcoin has moved back above $78,000 and is now pressing into a tightly packed on-chain resistance zone that may define its next short-term direction. Since its local low of $60,000 on February 6, BTC has spent about 75 days in sideways consolidation, and that range is now being tested against two closely aligned cost-basis levels.
$78,200 Marks the Cost Basis of Active Market Supply
The first level is the True Market Mean at $78,200. According to Checkonchain, this metric tracks the average acquisition price of actively circulating supply while excluding coins that are lost, dormant, or economically inactive. That makes it a narrower and more practical read on where active market participants actually hold their positions.
Because inactive coins are filtered out, the indicator is designed to show a cleaner estimate of where real selling pressure may sit. Instead of treating the full historical supply as equally relevant, it isolates the cost basis of participants still present in the market. That is why this area is being watched closely as BTC pushes higher.
$79,200 Is the Short-Term Holder Realized Price
Just above that level sits the short-term holder realized price at $79,200. Checkonchain defines this cohort as investors who have held their coins for less than 155 days. These holders tend to react more quickly to price changes, and with spot still below their average entry, the group remains at a slight unrealized loss.
The report notes that Bitcoin tested the short-term holder realized price in mid-January at around $98,000 and was rejected there. With BTC approaching another cost-sensitive area tied to short-term holders, traders are watching whether this attempt can produce a stronger hold above the level.
Breakout Could Flip the Zone Into Support
A sustained move above this band could turn both $78,200 and $79,200 into support, reinforcing bullish momentum. If Bitcoin fails to reclaim the zone, the current consolidation phase may continue for longer, with the possibility of a pullback still in play.