

Bitcoin slipped 0.72% to $78,524 on Tuesday after a 20% rally, as a fresh oil shock pushed stocks lower and revived bets that the Federal Reserve could raise interest rates at its next meeting. Bitcoin opened at $79,090, fell as low as $77,603 and later settled at $78,524.
The move came as oil prices pushed toward $100 a barrel after renewed U.S.-Iran hostilities in the Strait of Hormuz, the narrow waterway through which roughly one-fifth of the world’s oil is shipped. Higher energy costs tend to feed into inflation through transportation and manufacturing, making the Fed’s upcoming rate decision harder to predict.
Markets price a 57% chance of a September hike
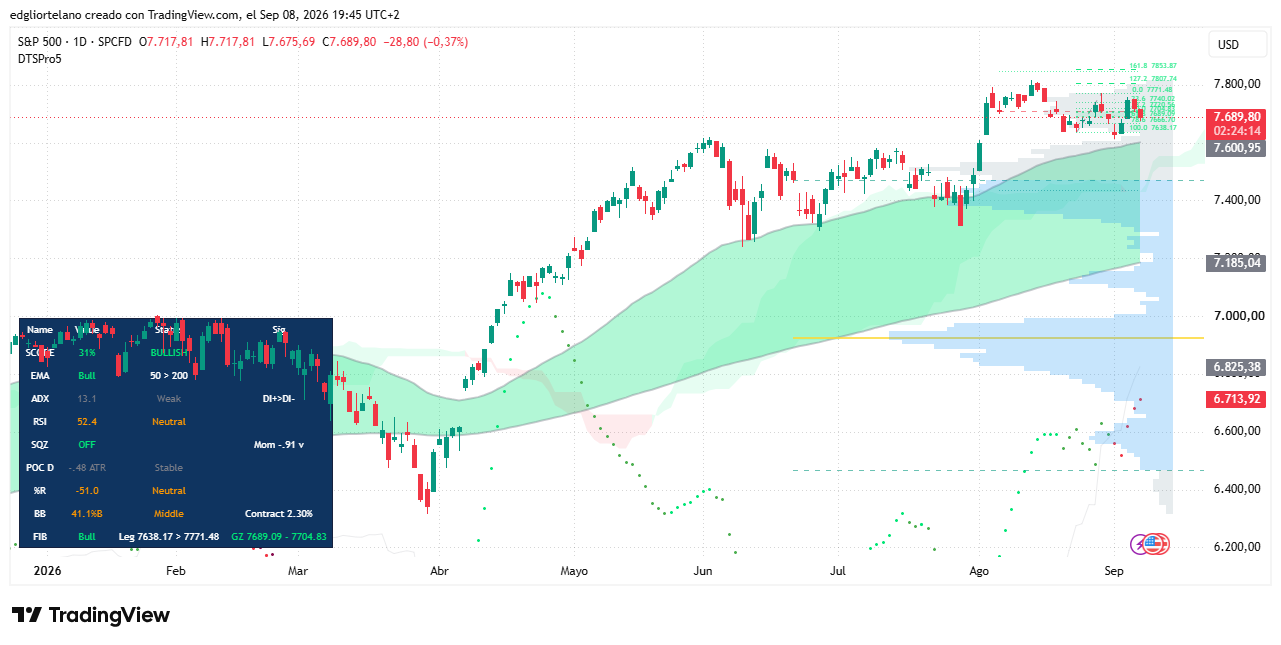
The Dow Jones Industrial Average dropped 614.88 points, or 1.15%, to 52,799.37. The Nasdaq Composite held up better, falling 0.19% to 26,457.73, according to Tuesday’s session. The S&P 500 was trading at about 7,689.80, down 0.37%.
Markets are now pricing roughly a 57% chance that the Federal Reserve will raise rates by a quarter of a percentage point at its September 15-16 meeting. A rate hike would put pressure on risk assets such as crypto because more expensive borrowing can make safer assets more attractive to traders.
The S&P 500 opened Tuesday at 7,717.81 and briefly dipped to 7,689.80, a much narrower range than Bitcoin’s session. The index remains close to its record close of 7,798.99, set on August 13. HSBC has raised its year-end S&P 500 target to 8,100 even as the index absorbs this week’s headwinds.
Jobs data shifts traders toward a hawkish Fed view
The change in rate expectations traces back to Friday’s jobs report. U.S. employers added 162,000 positions in August, nearly triple the 53,000 economists had forecast. The unemployment rate held steady at 4.1%.
A labor market this strong gives the Fed less room to argue that the economy needs cheaper money. Traders consequently took a more hawkish view, meaning they saw a greater chance of a rate increase than a cut.
Bitcoin remains above its main retracement zone
Bitcoin’s pullback follows a move from a $68,858 swing low to an $82,281 high. The coin has not maintained its earlier bullish momentum, but it has also avoided giving up much of the advance.
The key golden zone watched by traders sits between $73,986 and $75,569. Bitcoin is currently trading comfortably above that band.
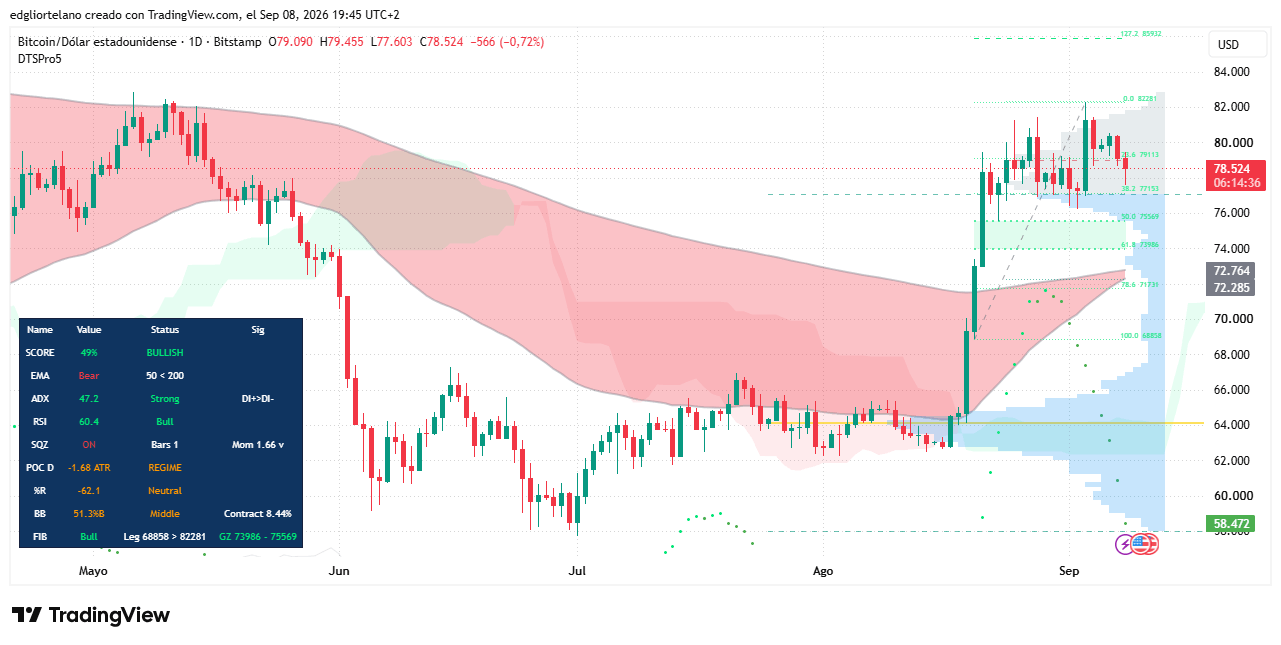
The Relative Strength Index, or RSI, is at 60.4. The indicator measures overbought and oversold momentum on a 0-to-100 scale. It remains bullish, although it has fallen from 66.1 a week earlier.
The Average Directional Index, or ADX, which measures trend strength regardless of direction, is at 47.2. That is well above the 25 level used to separate a meaningful trend from market noise. The directional lines within the indicator still favor buyers.
Bitcoin’s 50-day exponential moving average, or EMA50, remains below its 200-day counterpart, the EMA200. The bearish crossover has been in place since before August’s rally began. Bitcoin nevertheless closed August back above its 50-month moving average for the first time since last year’s crypto winter began.
If Bitcoin maintains its momentum, the EMA50 could cross above the EMA200 in the near term. Traders who follow charts commonly call that formation a golden cross and treat it as a bullish indicator.
Myriad traders continue to favor an upside move
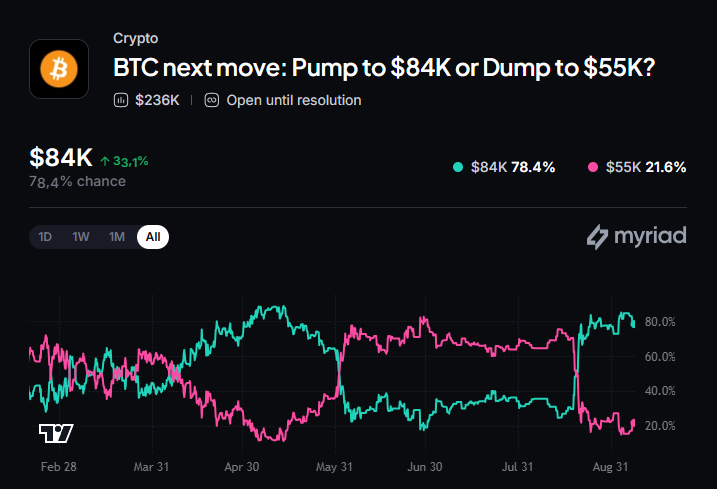
On Myriad, a prediction market built by Decrypt parent company Dastan, traders are pricing a 78.4% chance that Bitcoin reaches $84,000 before falling to $55,000. The reading is little changed from the 77% recorded a week earlier.
Over that period, Bitcoin moved between roughly $76,877 and a four-month high of $82,240. Myriad’s pricing shows that traders still see room for Bitcoin to rise, while the next move could be determined by the Fed’s decision next week.
The views and opinions expressed by the author are for informational purposes only and do not constitute financial, investment or other advice.