

Bitcoin has absorbed a difficult macro backdrop better than many other risk assets, but its rebound is now running into a clearly defined decision zone, according to Glassnode. The report places the market’s main overhead barrier near $69,000, the short-term holder cost basis, while the most important demand support sits around $63,000. Until that ceiling is reclaimed, the move still looks more like a rebound that needs confirmation than a fully established trend reversal.
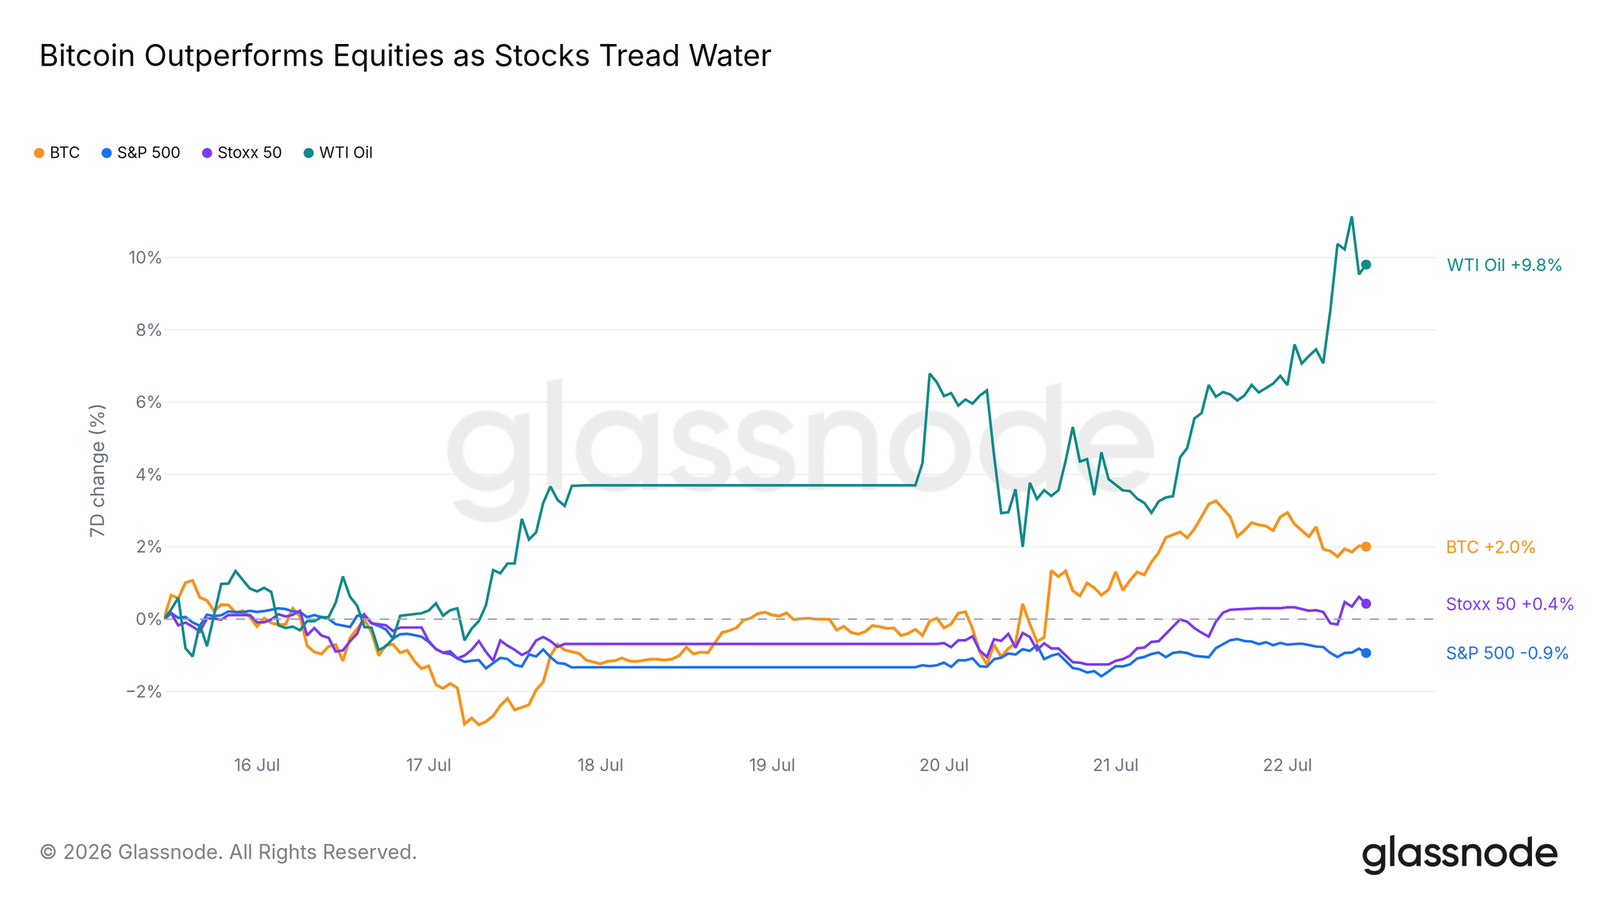
Bitcoin outperformed equities for a second straight week
Glassnode said this week’s macro test came from oil. WTI crude rose sharply as tensions involving Iran escalated, a kind of external shock that often weighs on risk assets more broadly. Equity markets did not offer much resilience: the S&P 500 finished the week lower, while European stocks moved sideways.
Bitcoin moved the other way and outperformed two major equity indexes for a second consecutive week. In the firm’s reading, a market that continues to rise in the face of negative news is often one where marginal selling pressure has largely been exhausted. That resilience, by itself, is a signal.
Cooling core inflation helps, but yields still cap risk assets
The report notes that core inflation declined for the first time in five months, reaching its closest reading to target levels since the 2022 peak. One data point does not make a trend, but the timing matters because the Federal Open Market Committee meeting is next week and the federal funds rate still sits more than 100 basis points above core inflation.
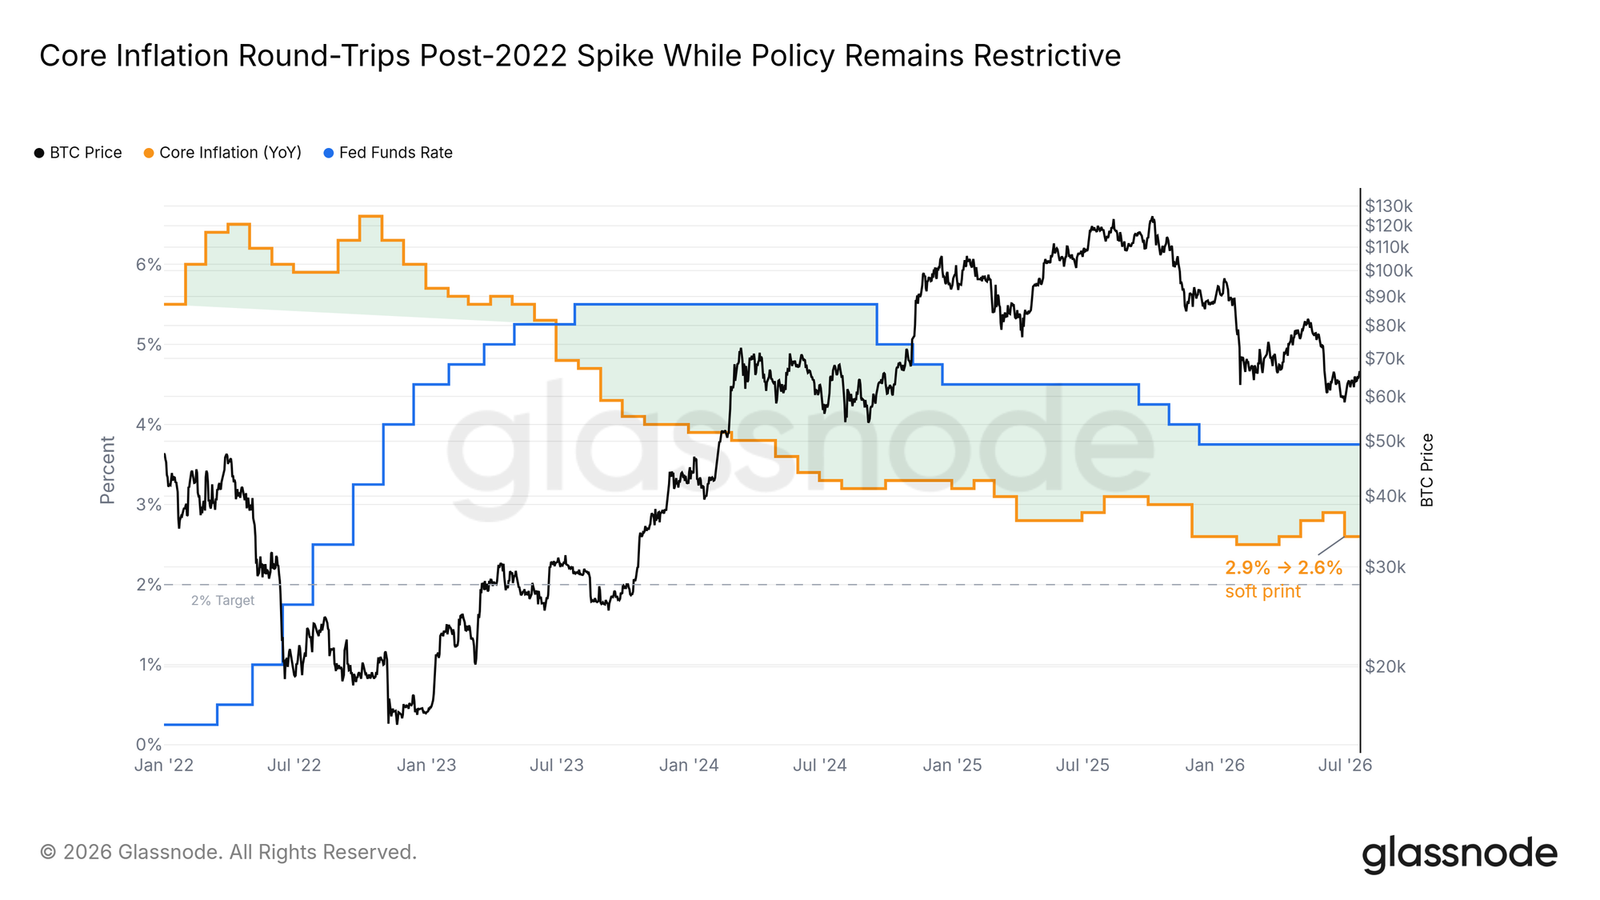
Glassnode argues that this gap reflects a still-restrictive policy stance and leaves room for the Federal Reserve to act. If policymakers signal rate cuts, one of the macro brakes the report has tracked throughout the year would ease. If they stay quiet, crypto will need to keep leaning on its own internal drivers.
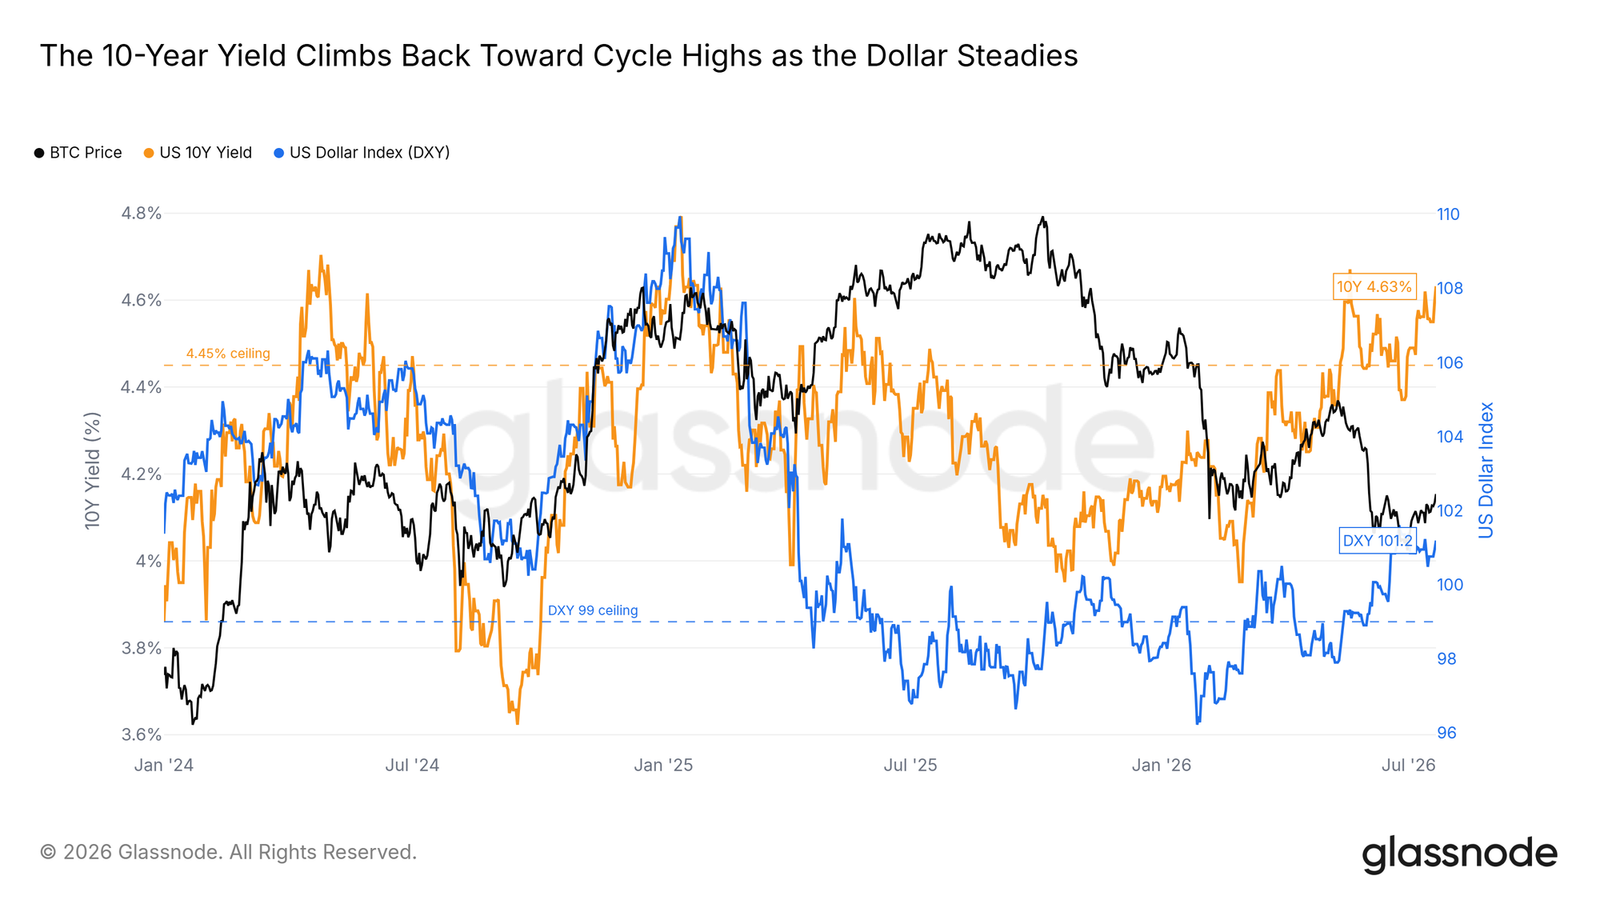
Bond markets, however, have not confirmed the improvement. The 10-year U.S. Treasury yield has climbed back near its recent highs and continues to pressure risk assets, while the dollar has stayed relatively calm and remains well below winter highs. Glassnode frames the cycle’s upside ceiling around two thresholds: a 10-year yield above 4.45% and a U.S. dollar index above 99. The dollar side is close to a breakout, while the yield side has not relaxed. The report says a simultaneous break lower in both would be the key macro release valve.
$69,000 overhead, $63,000 below: the market’s key decision zone
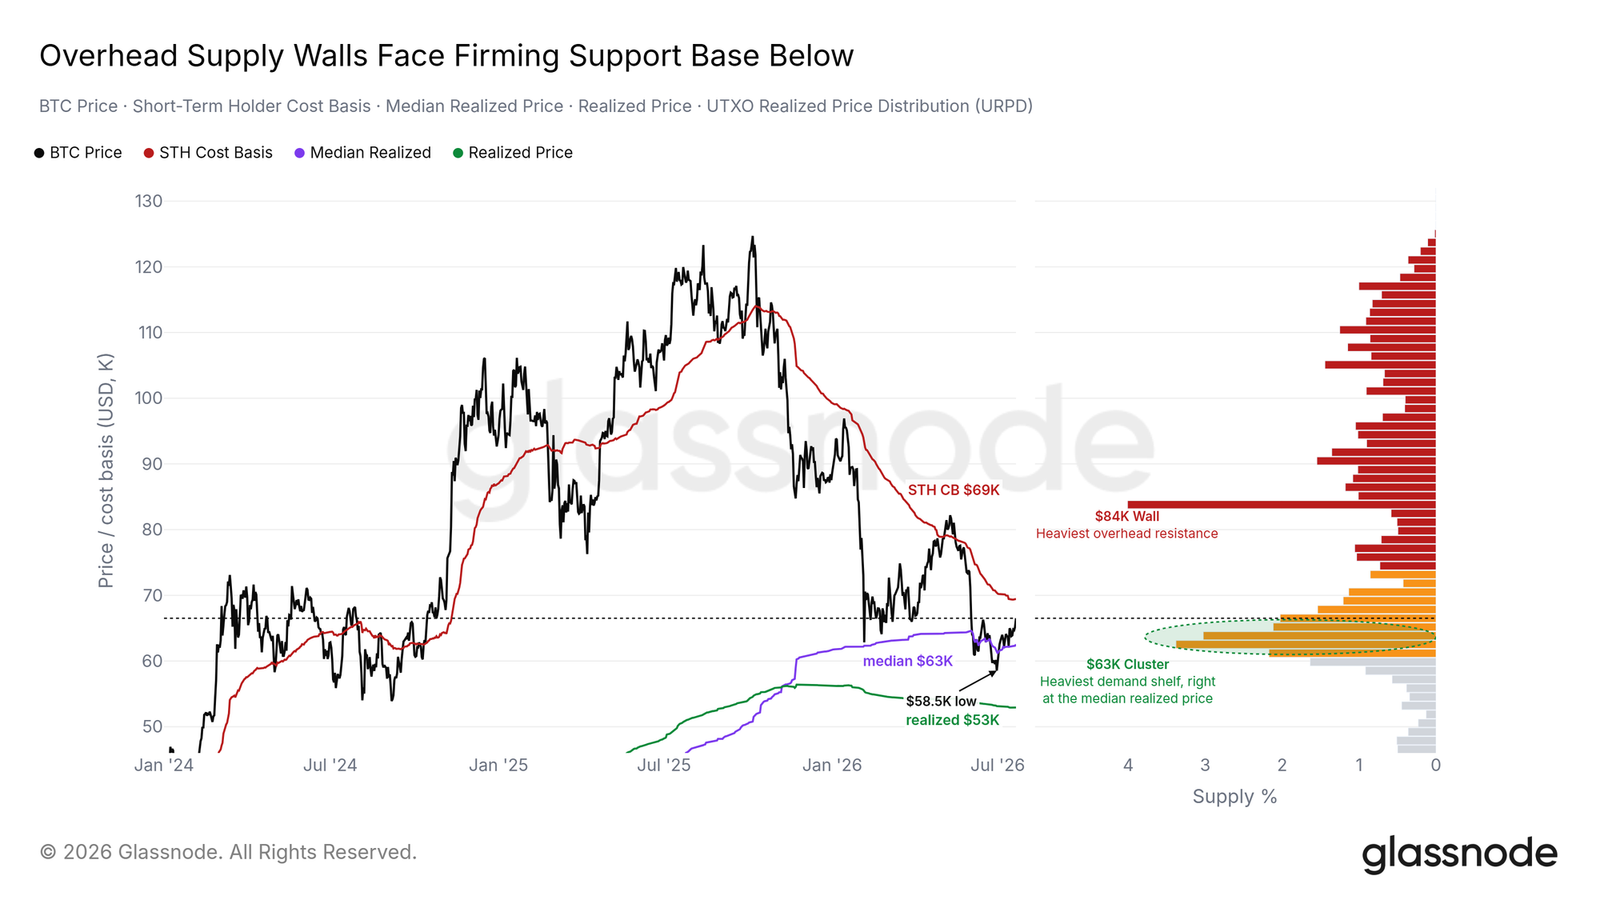
From an on-chain perspective, the distribution of supply around spot has become the core narrative since Bitcoin rebounded from its late-June low. Glassnode identifies roughly $69,000 as the short-term holder cost basis, effectively the aggregate break-even level for buyers from the past five months. Below price sits the heaviest demand support zone on the chart, concentrated near $63,000. That area accounts for roughly one-tenth of total supply and marks the median coin’s last transacted price. The realized-price floor lies much lower.
The asymmetry around that first overhead wall is familiar. In downtrends, when price approaches the recent buyer break-even level from below, the zone often turns into selling pressure because the holders most eager to sell are suddenly close to getting out flat. If Bitcoin can reclaim it, Glassnode says the market faces an “air pocket” up to the major $84,000 level, where resistance becomes relatively thin and repricing can happen more quickly. If it fails, the support band below becomes the next test.
Nearby supply is starting to lean toward support
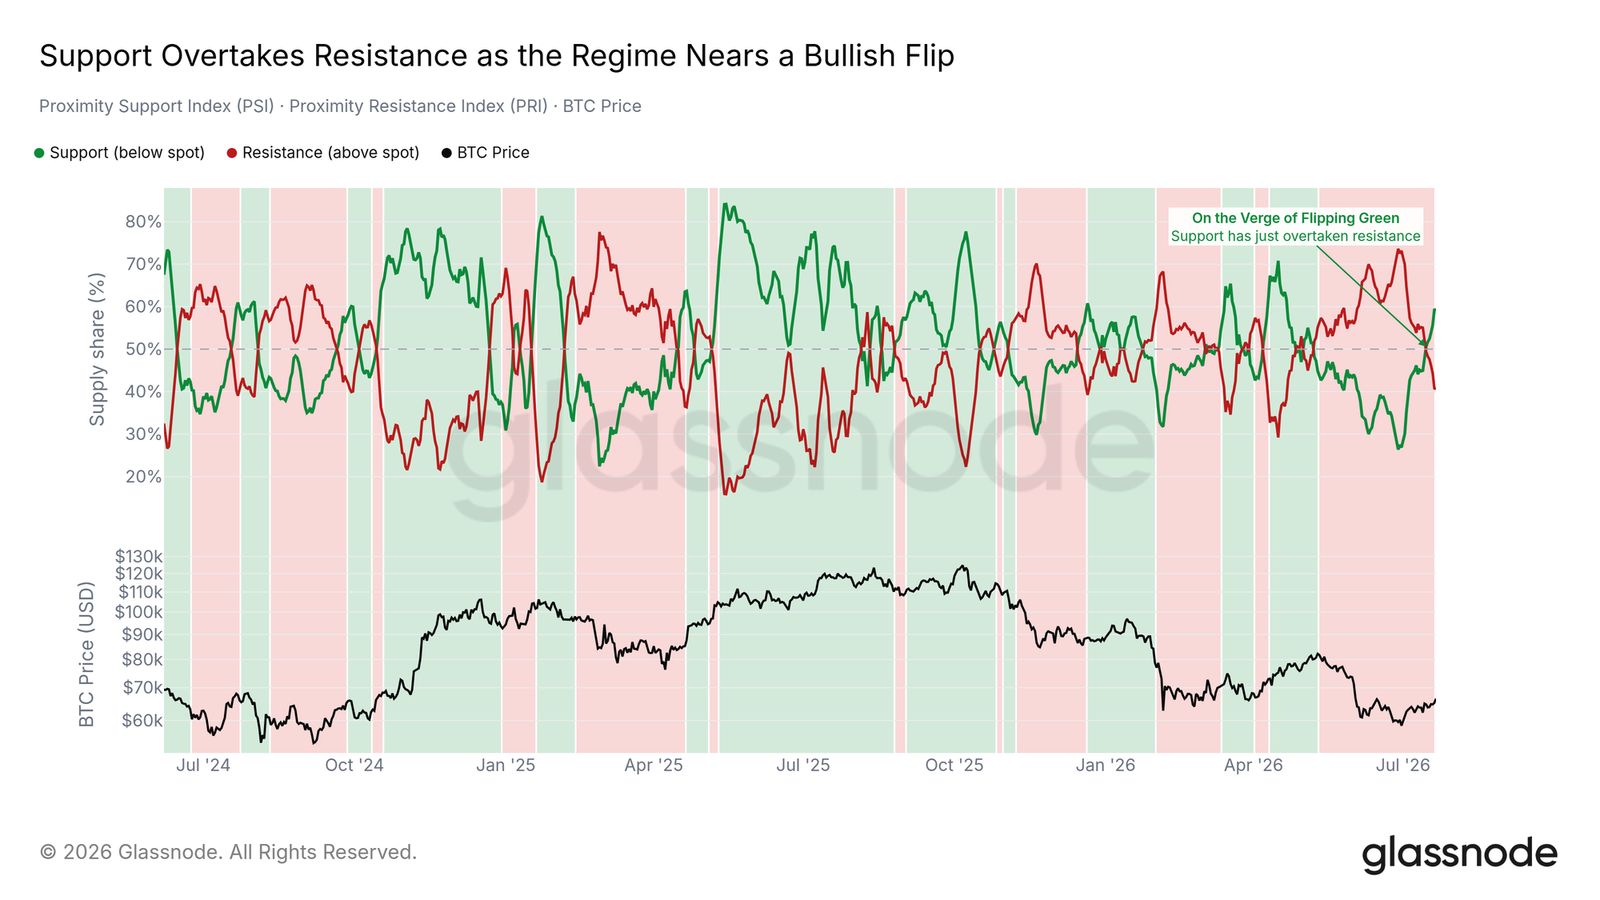
Supply close to the current price is beginning to shift. Using a distance-weighted cost basis, Glassnode splits nearby coins into support below spot and resistance above it. Support has now just overtaken resistance, putting a spring-to-summer structure that had favored overhead supply close to a reversal.
At the same time, failed rebounds usually require enough profit-taking pressure to stall the move, and that fuel has not fully built yet. Glassnode highlights one classic trigger: short-term holder profit supply rising above 54%. That would mean enough recent buyers are back in profit to create more meaningful selling pressure. The indicator is still well below that level.
Short-term holder SOPR is also holding near break-even rather than rolling over. In other words, recent buyers are neither euphoric nor leaving the market.
Exchange inflows are fading, but clear outflows have not returned
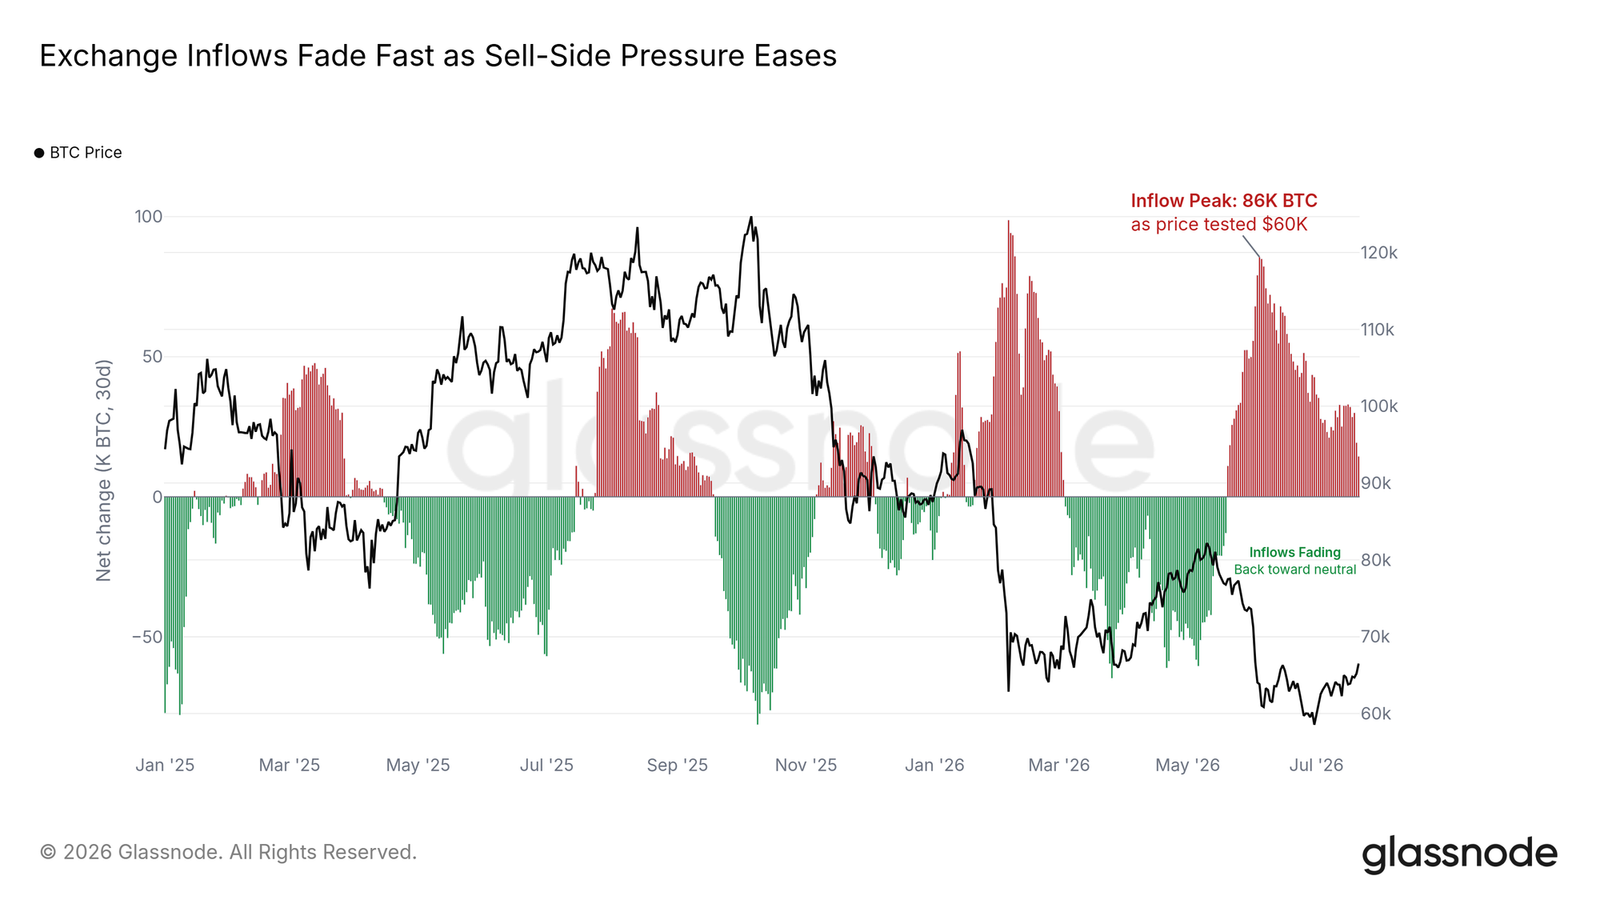
Glassnode describes the exchange “revolving door” as slowing down. When the market broke lower in early June, exchange net position change showed heavy net inflows, a sign that potential sell-side inventory was being moved onto trading venues. Those inflows have weakened for several weeks and are now only a fraction of their peak.
That leaves the market in a neutral setup. Demand is absorbing incoming supply, but the structural withdrawal pattern seen in healthier conditions has not yet returned. The report says sustained net outflows would be the stronger confirmation signal, and that is where ETF channels have started to matter.
Accumulation is concentrated in 1,000-10,000 BTC wallets
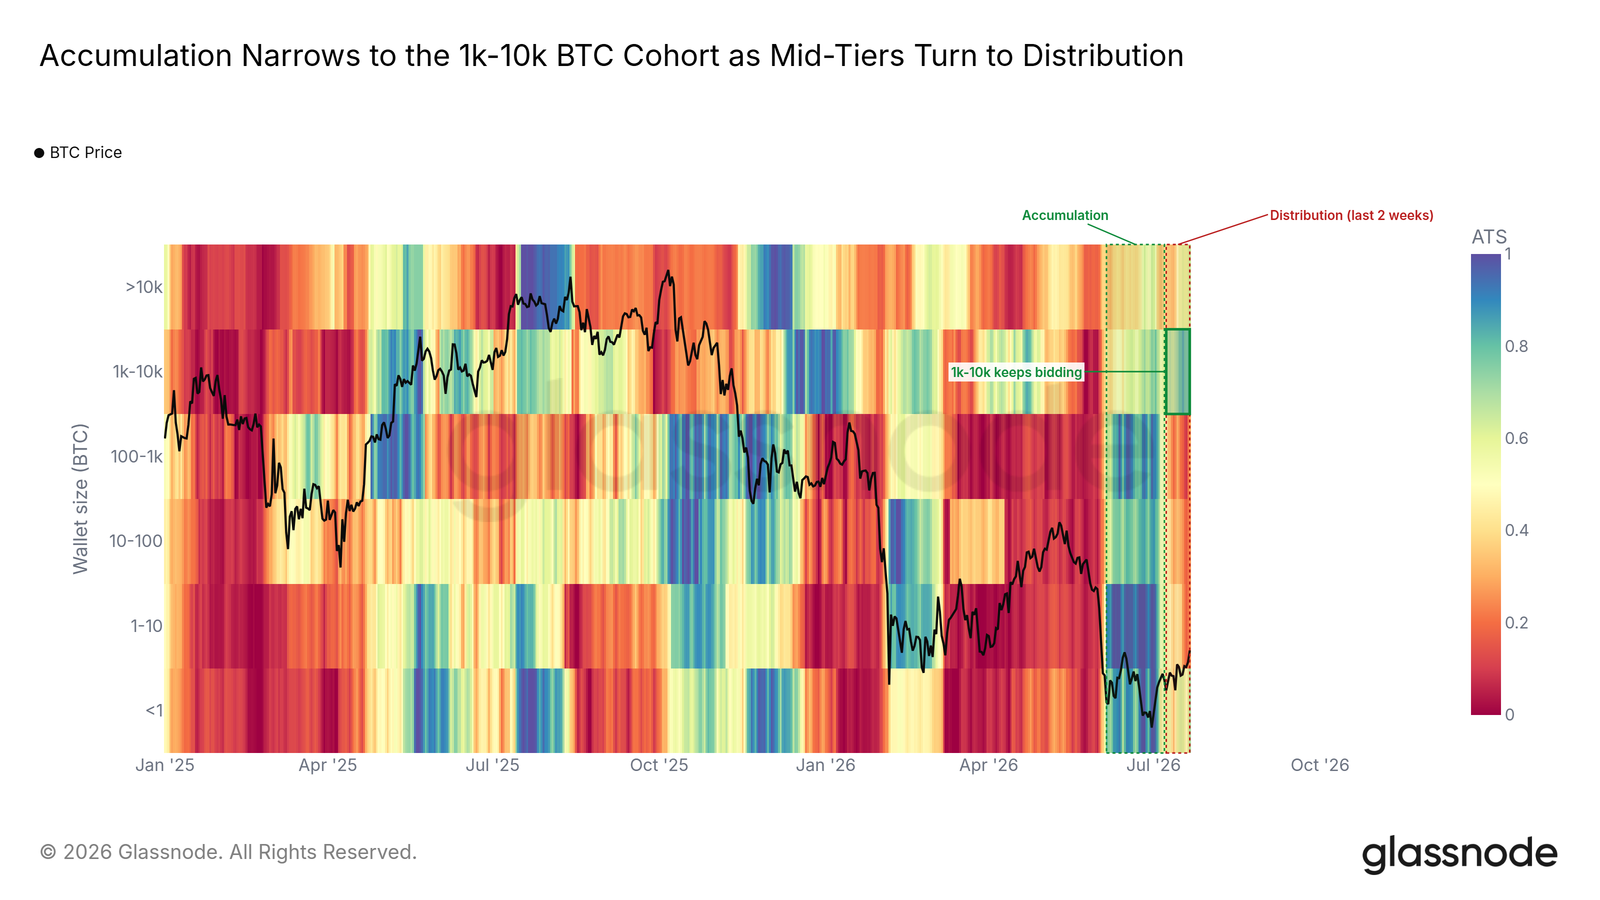
Glassnode contrasts the current rebound with June’s low. At that earlier stage, the accumulation trend score showed broad-based buying across wallet cohorts. Over the past two weeks, buying has narrowed to wallets holding 1,000 to 10,000 BTC. Historically, the report says, these wallets have often led more durable turning points, while mid-sized cohorts have moved back into distribution.
That concentration cuts both ways. Large, patient wallets have often helped lead recovery phases, but a market being held up by one cohort alone is thinner than one supported across the spectrum. Breadth on the next leg higher will be crucial in telling the difference between a squeeze and a real trend.
ETF flows turn positive and price moves above max pain
Off-chain conditions have improved. For weeks, every sign of better sentiment came with the same caveat: derivatives looked stronger, but U.S. spot Bitcoin ETFs were still bleeding capital. That has changed. Glassnode says flows into U.S. spot Bitcoin ETFs have flipped to net inflows, marking the first stretch of sustained net buying since the June redemption wave ended.
The previous weekly report said institutions had stopped fleeing but had not started buying. This week’s update suggests the turn has begun. The shift is still early and the size remains modest, yet it changes the character of the rebound by adding spot demand instead of leaving the move driven only by derivatives. Persistence, not one-off size, is what the report says to watch.
In options, the max pain level — the price at which the largest number of contracts expires worthless — had acted as resistance throughout the spring. Bitcoin approached it from below last week and has now moved above that aggregate level, well above where max pain sat during the February low. Historically, Glassnode says, reclaiming max pain has often coincided with a friendlier options-market structure, though the change tends to be gradual. If price stays above it through the coming expiry cycle, dealer hedging flows could damp volatility rather than chase it, turning max pain from a ceiling into an anchor.
Hedges are being unwound and bearish positioning is fading
Since the June low, Glassnode has tracked the same quiet process in each report: traders closing shorts and allowing downside protection to expire. The latest data makes that process more visible. One-week 25-delta skew has fallen to its lowest level in months, with front-end downside protection being abandoned fastest and one-month tenors following the same path.
Put/call composite measures point in the same direction. The report says the options open-interest put/call ratio has dropped to its lowest level this year, while the volume ratio has been cut in half from the June hedging peak. At the same time, perpetual futures funding rates have stayed below neutral every day over the past month.
That mix suggests the improvement in sentiment is coming from the removal of hedges rather than from a fresh build-up in leverage. If the market squeezes higher from here, Glassnode says the move would usually unwind more gently on pullbacks than a squeeze driven by elevated funding rates.
Altcoins are losing ground to Bitcoin again
Beneath the surface, capital is still favoring the market leader. Altcoins across market-cap tiers have been underperforming BTC for years. That longer downtrend slowed in the spring, forming what Glassnode describes as the most constructive kind of altcoin bottom seen in a bear market. Last week, that gradual decline quietly resumed as smaller-cap coins gave up more ground against Bitcoin while BTC moved higher.
The report treats that as a healthier rotation sequence. Bitcoin leads first, concentrating capital in the deepest and most liquid asset, and only later does money spill outward. When altcoins lead too early, the move more often resembles a bubble. A market where the bottom holds and Bitcoin leads is, in Glassnode’s view, a more durable sequence for recovery.
The next confirmation sits at $69,000
Glassnode’s conclusion is straightforward. Until the market proves itself, this is still a bear-market rebound, and the proving ground is clear. A short squeeze has already done much of what it can do: hedges have been lifted, shorts have been closed, funding remains calm, and ETFs have shifted from a drag to support. What it has not done is clear overhead resistance.
Bitcoin remains below the $69,000 short-term holder cost basis. If it reclaims that level decisively while spot inflows continue, the air pocket toward $84,000 opens up. If the market is rejected there and exchange inflows return, focus shifts back to the demand support band near $63,000.