



Bitcoin pushed back toward a weekly high on Wednesday, trading near $84,500 and rising 2.5% over the past 24 hours as the crypto market recovered from a mid-October selloff that had sent the asset below $80,000. Total crypto market capitalization, the combined value of all coins, rose 2.2% to $2.9 trillion.
Large-cap tokens moved higher, with XRP and Zcash standing out
Other major cryptocurrencies also posted gains. Ethereum rose 2.5% to $2,504, Solana added 2.2% to $108.18, and BNB climbed 2% to $749.
XRP led the large-cap group with a 4.1% gain to $1.37. Zcash jumped 11.2% to $1,332 and was up 15.3% over the past seven days.
The Crypto Fear & Greed Index, which runs from 0 to 100, stood at 55. A reading of 0 signals extreme fear and 100 signals extreme greed. At 55, the gauge remained in neutral territory but was 3 points higher than the previous day, indicating that traders had stepped back from panic without shifting into outright price chasing.
Oil, inflation and rate expectations stayed in focus
According to the report, Brent crude, the global oil benchmark, has traded between $97 and $112 a barrel this month and was near $108 on Wednesday. The war with Iran has kept supply concerns alive, while Washington rejected an Iranian proposal to reopen the Strait of Hormuz in late September.
Oil matters for crypto because it feeds into inflation. U.S. consumer prices rose 3.7% in September from a year earlier, above economists’ 3.6% expectation and higher than August’s 3.4% reading. Higher inflation tends to push Treasury yields higher, raising the return investors demand for lending to the U.S. government.
When government bonds offer yields above 5% with almost no default risk, capital can move away from stocks and crypto. Higher rates also increase the borrowing costs behind leveraged trades.
The Federal Reserve’s benchmark rate stands at 3.75% to 4% after a September hike. CME FedWatch showed roughly an 80% chance that the Fed would hold rates steady at its Oct. 28 meeting, while markets were firmly pricing in a hike on Dec. 9.
Bitcoin reclaimed a key level after a roughly 6% bounce from the monthly low
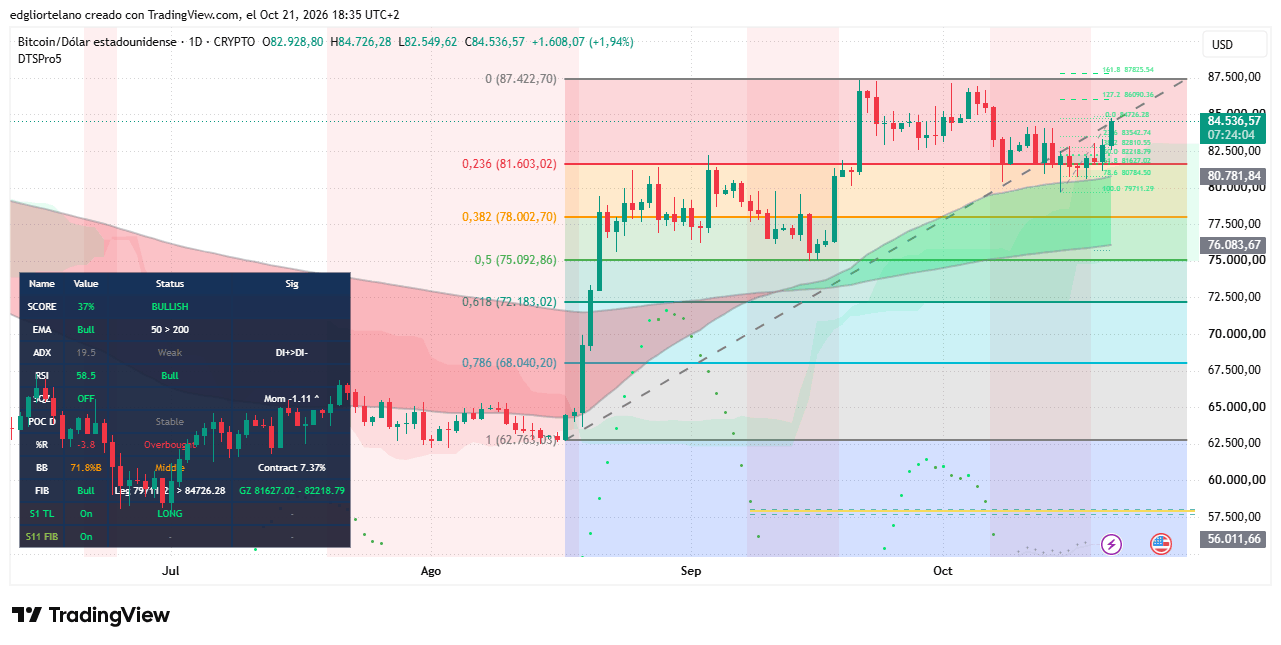
On the daily chart, Bitcoin opened Wednesday at $82,928.80 and reached $84,726.28, putting the candle up 1.94%. From this month’s low near $79,711, the asset has rebounded about 6%. The current move is pressing higher as price approaches natural resistance at $87,422.70.
The latest rally in Bitcoin ran from $62,763 to a September high of $87,422.70. That move established strong support at $81,603. Bitcoin lost that level during the October dip and has now reclaimed it, with price action still sitting on the upper side of the rebound.
Moving averages and RSI still point to a constructive setup
The 50-day exponential moving average sat near $80,782, above the 200-day moving average at about $76,084. A 50-day average above the 200-day average is commonly treated as a sign of an uptrend. Bitcoin was trading 4.6% above the shorter average.
The Relative Strength Index, or RSI, read 58.5. The indicator measures recent buying versus selling on a 0-to-100 scale. Readings above 50 suggest buyers have the edge, while 70 marks overbought territory. On that basis, momentum had not yet become stretched, though it was moving in a more bullish direction.
Levels in focus: $84,726 on the upside, $81,603 on the downside
The report said the bullish case would require a daily close above $84,726, Wednesday’s high, ideally with ADX, a measure of trend strength over time, climbing back above 25. That setup would open a path toward roughly $86,090 and then the September high at $87,422.70.
On Myriad, the prediction market built by Decrypt parent company Dastan, traders put the odds of Bitcoin touching $87,500 in October at 31%, down from 45% on Oct. 12. The probability of a move to $90,000 was priced at 18%.
If Bitcoin stalls below $84,726, the asset would remain inside the roughly $79,700 to $87,400 range that has held since late September, a pattern the report said fits with an ADX reading below 20.
The bearish case begins with a daily close below $81,603. That would expose the 50-day EMA at $80,782, then the October low near $79,711, followed by the 200-day EMA at $76,084.
The article noted that the views and opinions expressed by the author are for informational purposes only and do not constitute financial, investment, or other advice.