

Bitcoin traded around $77,500 on September 1, down about 1.3% on the day after closing August with a gain of roughly 25%, one of the strongest monthly performances of the current cycle. The move marked a sharp rebound from a 21-month low near $59,300 seen in June.
The rally that pushed crypto markets from “fear” to “extreme greed” has now cooled, leaving traders focused on where Bitcoin could head next.
What drove the August rally
According to Decrypt, the recent advance traces back to August 19, when U.S. Treasury Secretary Scott Bessent decided to double the size of long-end bond buybacks. The liquidity move hit Treasury yields and helped trigger a short squeeze across crypto markets.
Around the same period, the U.S. Securities and Exchange Commission, or SEC, offered a framework for crypto investment contracts, giving the move an added regulatory tailwind.
The rally then lost pace after Federal Reserve Chair Kevin Warsh, in his first Jackson Hole speech as chair, warned that inflation data were “more concerning” than the labor market. That revived talk of a possible rate hike at the Fed’s September 15-16 meeting. Bitcoin briefly moved above $81,000 in the days following the buyback news before slipping back below $78,000.
Prediction market traders still lean bullish
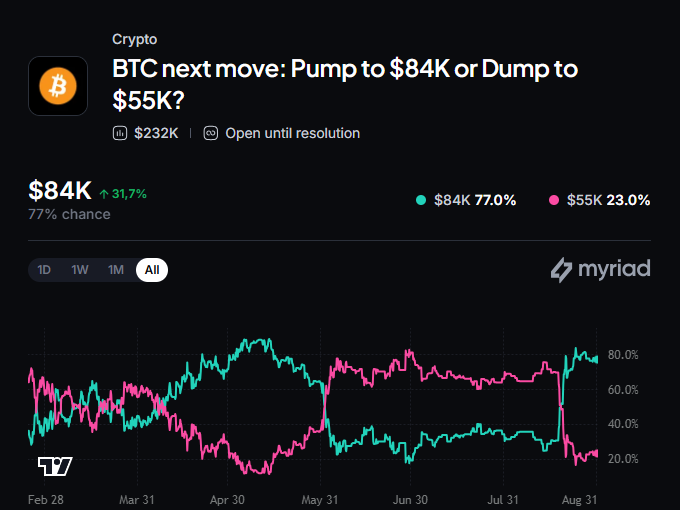
On Myriad, a prediction market built by Decrypt parent company Dastan, traders continue to bet on more upside.
The market shows a 77% probability that Bitcoin reaches $84,000 before falling back to $55,000. Decrypt described that as a heavily one-sided reading, reflecting August momentum more than what the charts currently confirm.
Daily chart signals remain constructive, but resistance is close
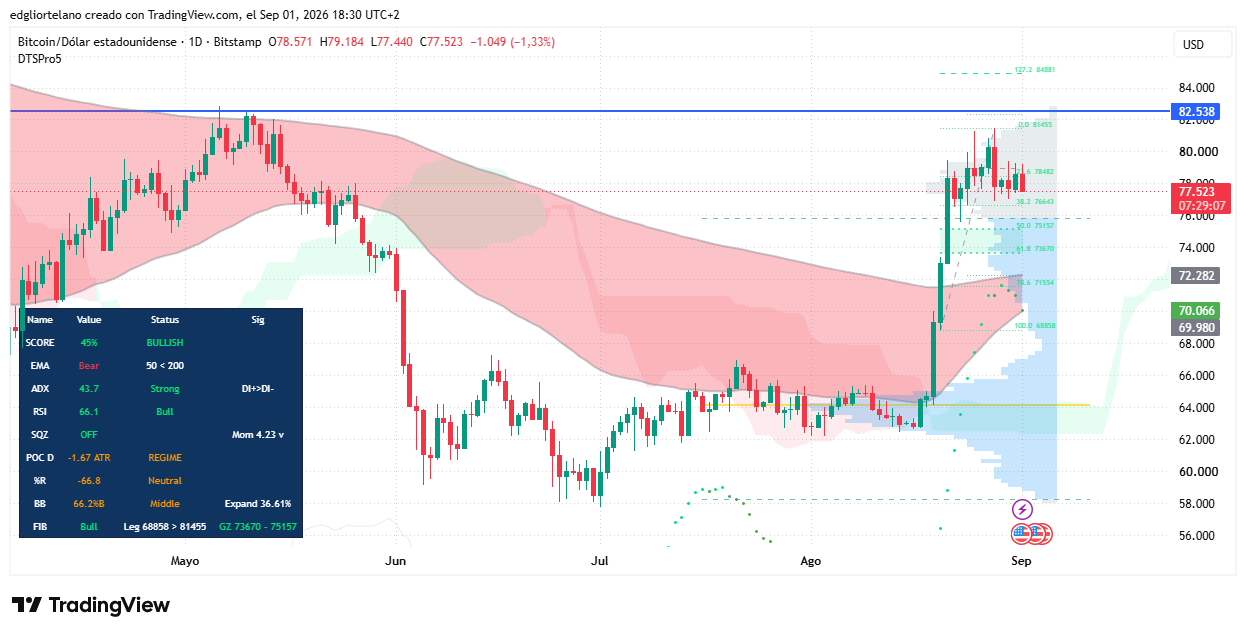
Bitcoin opened September at $78,571, the same level where August ended, before sliding to an intraday low of $77,440. The pullback was modest, but it came just below a resistance zone that has repeatedly held near $82,500.
On the daily chart, the Relative Strength Index, or RSI, stands at 66.1. That is still in bullish territory, though it is moving closer to 70, the level where traders often begin to expect profit-taking.
The Average Directional Index, or ADX, is at 43.7, well above the 25 threshold that signals a real trend is in place. That reading points to a stronger directional move rather than choppy, directionless trading.
One caution remains. The 50-day and 200-day exponential moving averages are still in a bearish crossover, with the 50-day below the 200-day. That is usually read as a longer-term warning sign during a rally because the broader trend structure has not fully turned bullish yet; price has simply moved ahead of it for now.
Decrypt noted that the gap between the two averages is narrowing, which could leave room for a bullish crossover later.
The monthly chart shows a larger shift, but not a full confirmation
The more important technical story appears on the monthly chart.
From the second half of 2025 through July 2026, Bitcoin spent most of its time in a declining path below its 50-month moving average, the slower gray line that smooths four years of price action. Decrypt said that has happened only a few times before in Bitcoin’s history: during the 2018-2019 bear market after the 2017 top, and again during the 2022 collapse that followed the Terra/LUNA and FTX blowups. Both periods were described as full crypto winters.
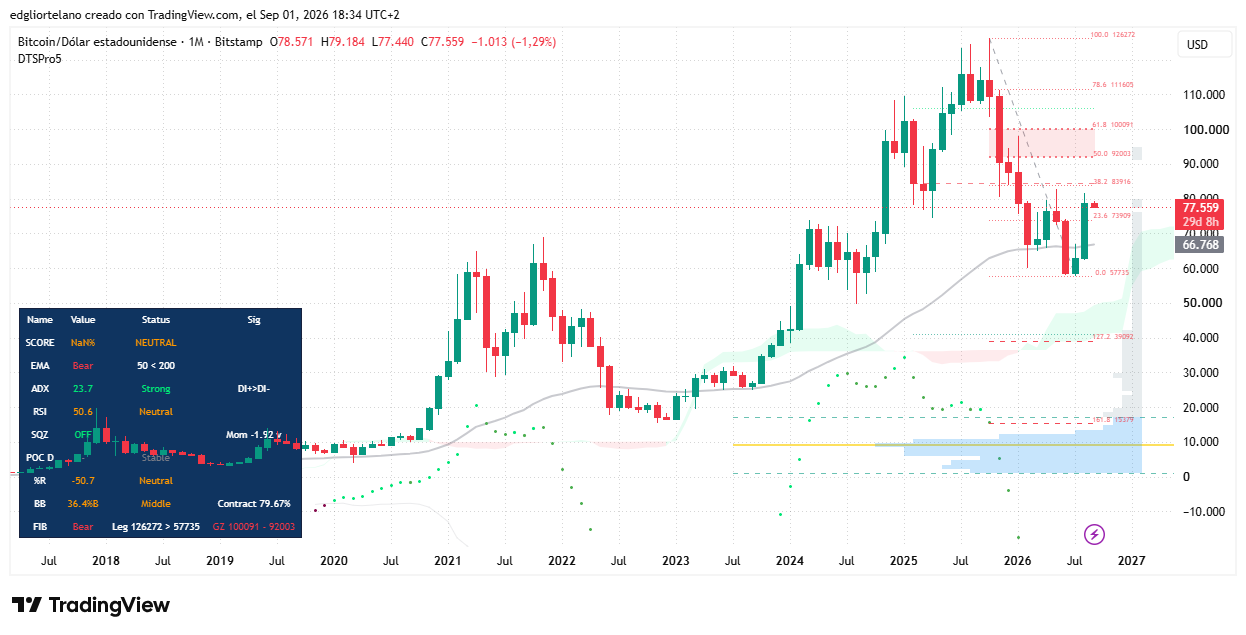
August produced the largest green monthly candle on the chart and pushed Bitcoin back above that 50-month average after its best monthly performance since November 2024.
That is a meaningful technical change. Even so, the monthly RSI sits at 50.6, a neutral reading, while monthly ADX is 23.7, just below the 25 mark that would confirm a real trend instead of a bounce. In Decrypt’s framing, the move above the average may have ended the winter signal, but it has not yet confirmed a new bull trend.
Macro support remains in place, while September seasonality pushes the other way
The macro backdrop behind August’s rally is still intact. The Treasury buyback program runs through the November 4 refunding quarter, spot Bitcoin ETFs kept posting net inflows through the month, and the SEC’s crypto rulemaking process is still moving ahead rather than stalling.
Decrypt argued that reclaiming the 50-month moving average, combined with a daily ADX reading that confirms a genuine trend rather than noise, gives bulls a structural case. The winter signal that held for roughly 10 months has just broken, and trend-following capital often chases that kind of shift once it is confirmed on a higher timeframe.
Still, September itself remains a headwind before any fresh catalyst appears. Decrypt said September has been Bitcoin’s weakest calendar month since 2013. This year, that seasonal pressure comes alongside Warsh’s hawkish Jackson Hole tone and rising odds of a rate hike at the Fed meeting on September 15-16.
Key levels in focus
- Resistance: $81,455 to $82,538 as the immediate confluence zone; $92,003 to $100,091 as the monthly golden zone.
- Support: $73,670 to $75,157 as the daily golden zone; $68,858 as the August swing low.
The author added that the views in the article are for informational purposes only and do not constitute financial, investment, or other advice.