

Bitcoin has not followed the rebound in traditional assets. After hitting an all-time high of about $126,000 in October last year, BTC has remained in correction, and it is still moving sideways even as U.S. stocks and gold have both recovered.
In a report written by Nancy for PANews and carried by MarsBit, renewed ETF inflows and several long-term indicators nearing historical lows were cited as early signs worth watching, but those shifts have yet to translate into a sustained price recovery.
Stocks and gold rebound, Bitcoin stays behind
After a sharp bout of volatility and a fast pullback in U.S. equities at the end of July, money moved back into risk assets and drove a quick recovery in stocks. The S&P 500 and the Dow Jones Industrial Average both reclaimed earlier losses and each reached record highs this week. Technology shares led the rebound, with semiconductor and AI-related names posting broad gains.
Precious metals also drew fresh demand. Spot gold rose for several sessions and briefly broke above $4,400 per ounce, marking its highest level in nearly two months. Spot silver climbed as well and at one point traded above the $66-per-ounce area, its highest in nearly seven weeks.
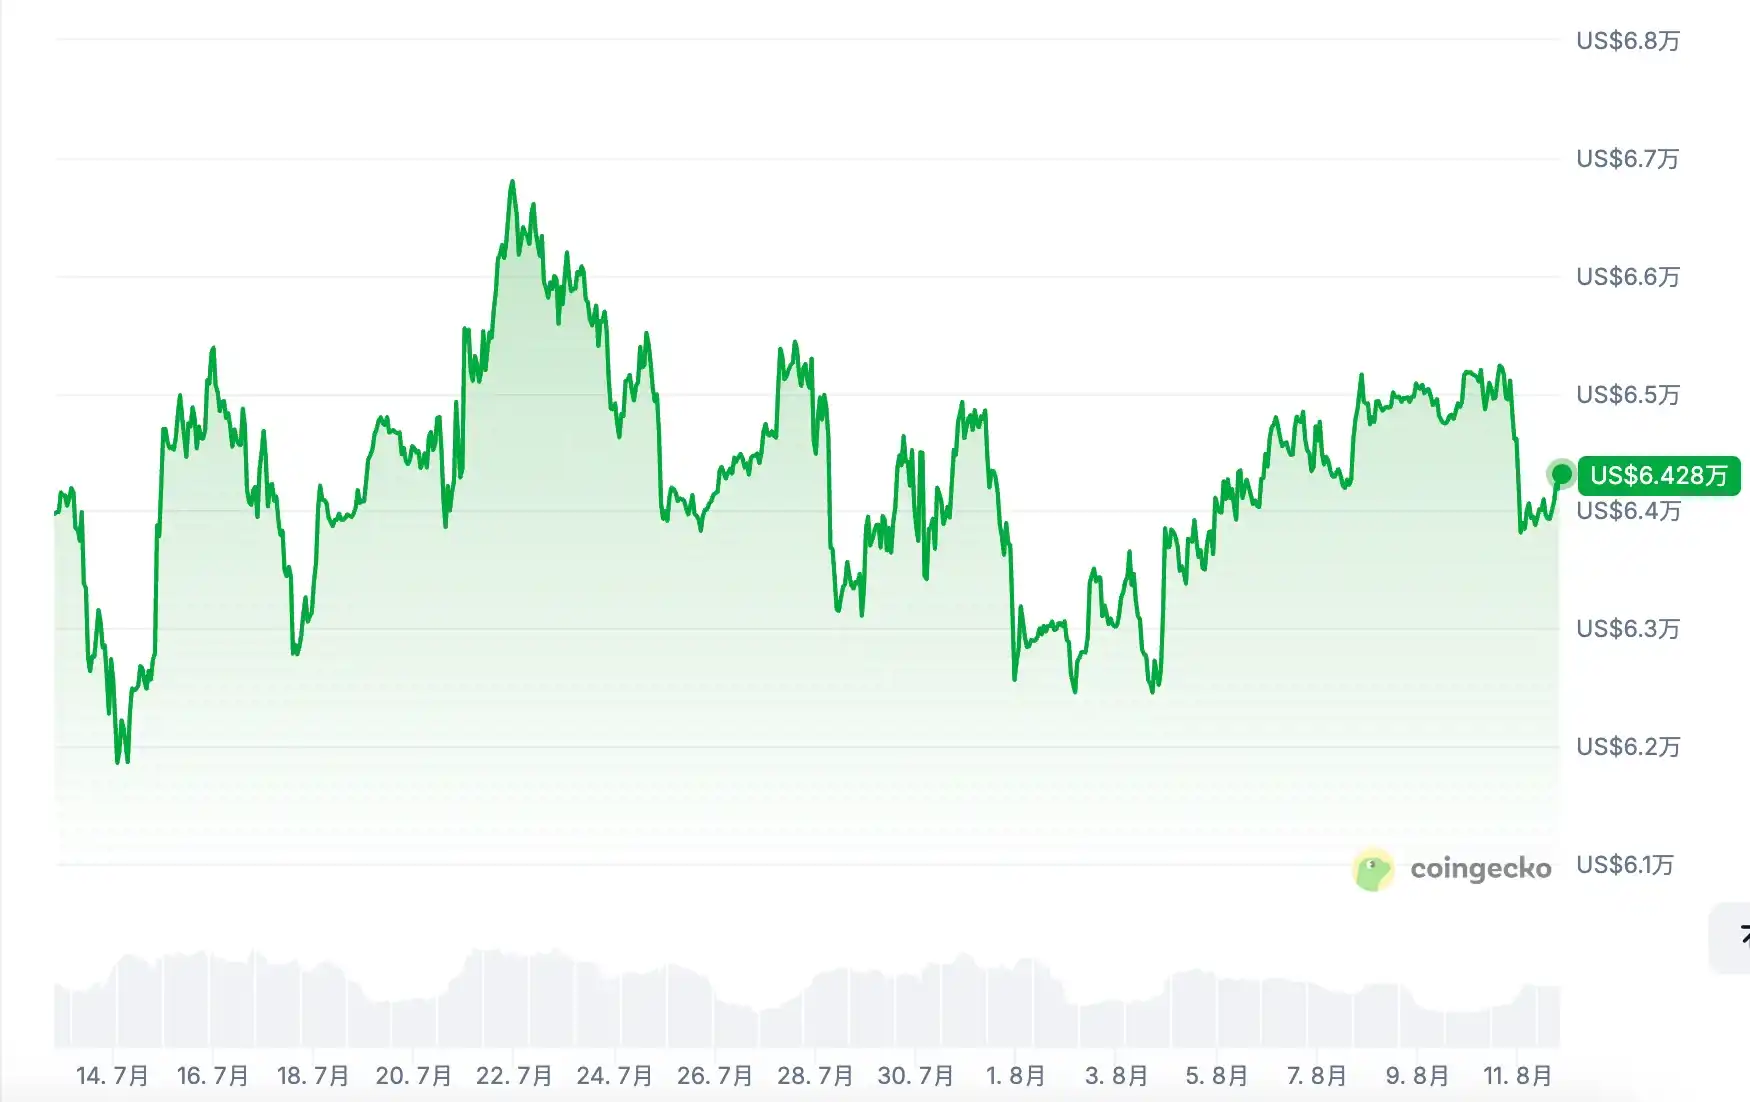
Bitcoin did not stage a similar recovery. CoinGecko data cited in the report showed BTC has spent the last 30 days consolidating between $62,000 and $66,000.
Glassnode said that over the past 90 days, the S&P 500 has gained about 5% while Bitcoin has fallen 20%. The divergence has also remained visible over the past seven days. Until Bitcoin re-establishes relative strength against U.S. equities, the report said, market direction is still being led by stocks.
Higher on-chain activity and ETF inflows have not lifted price
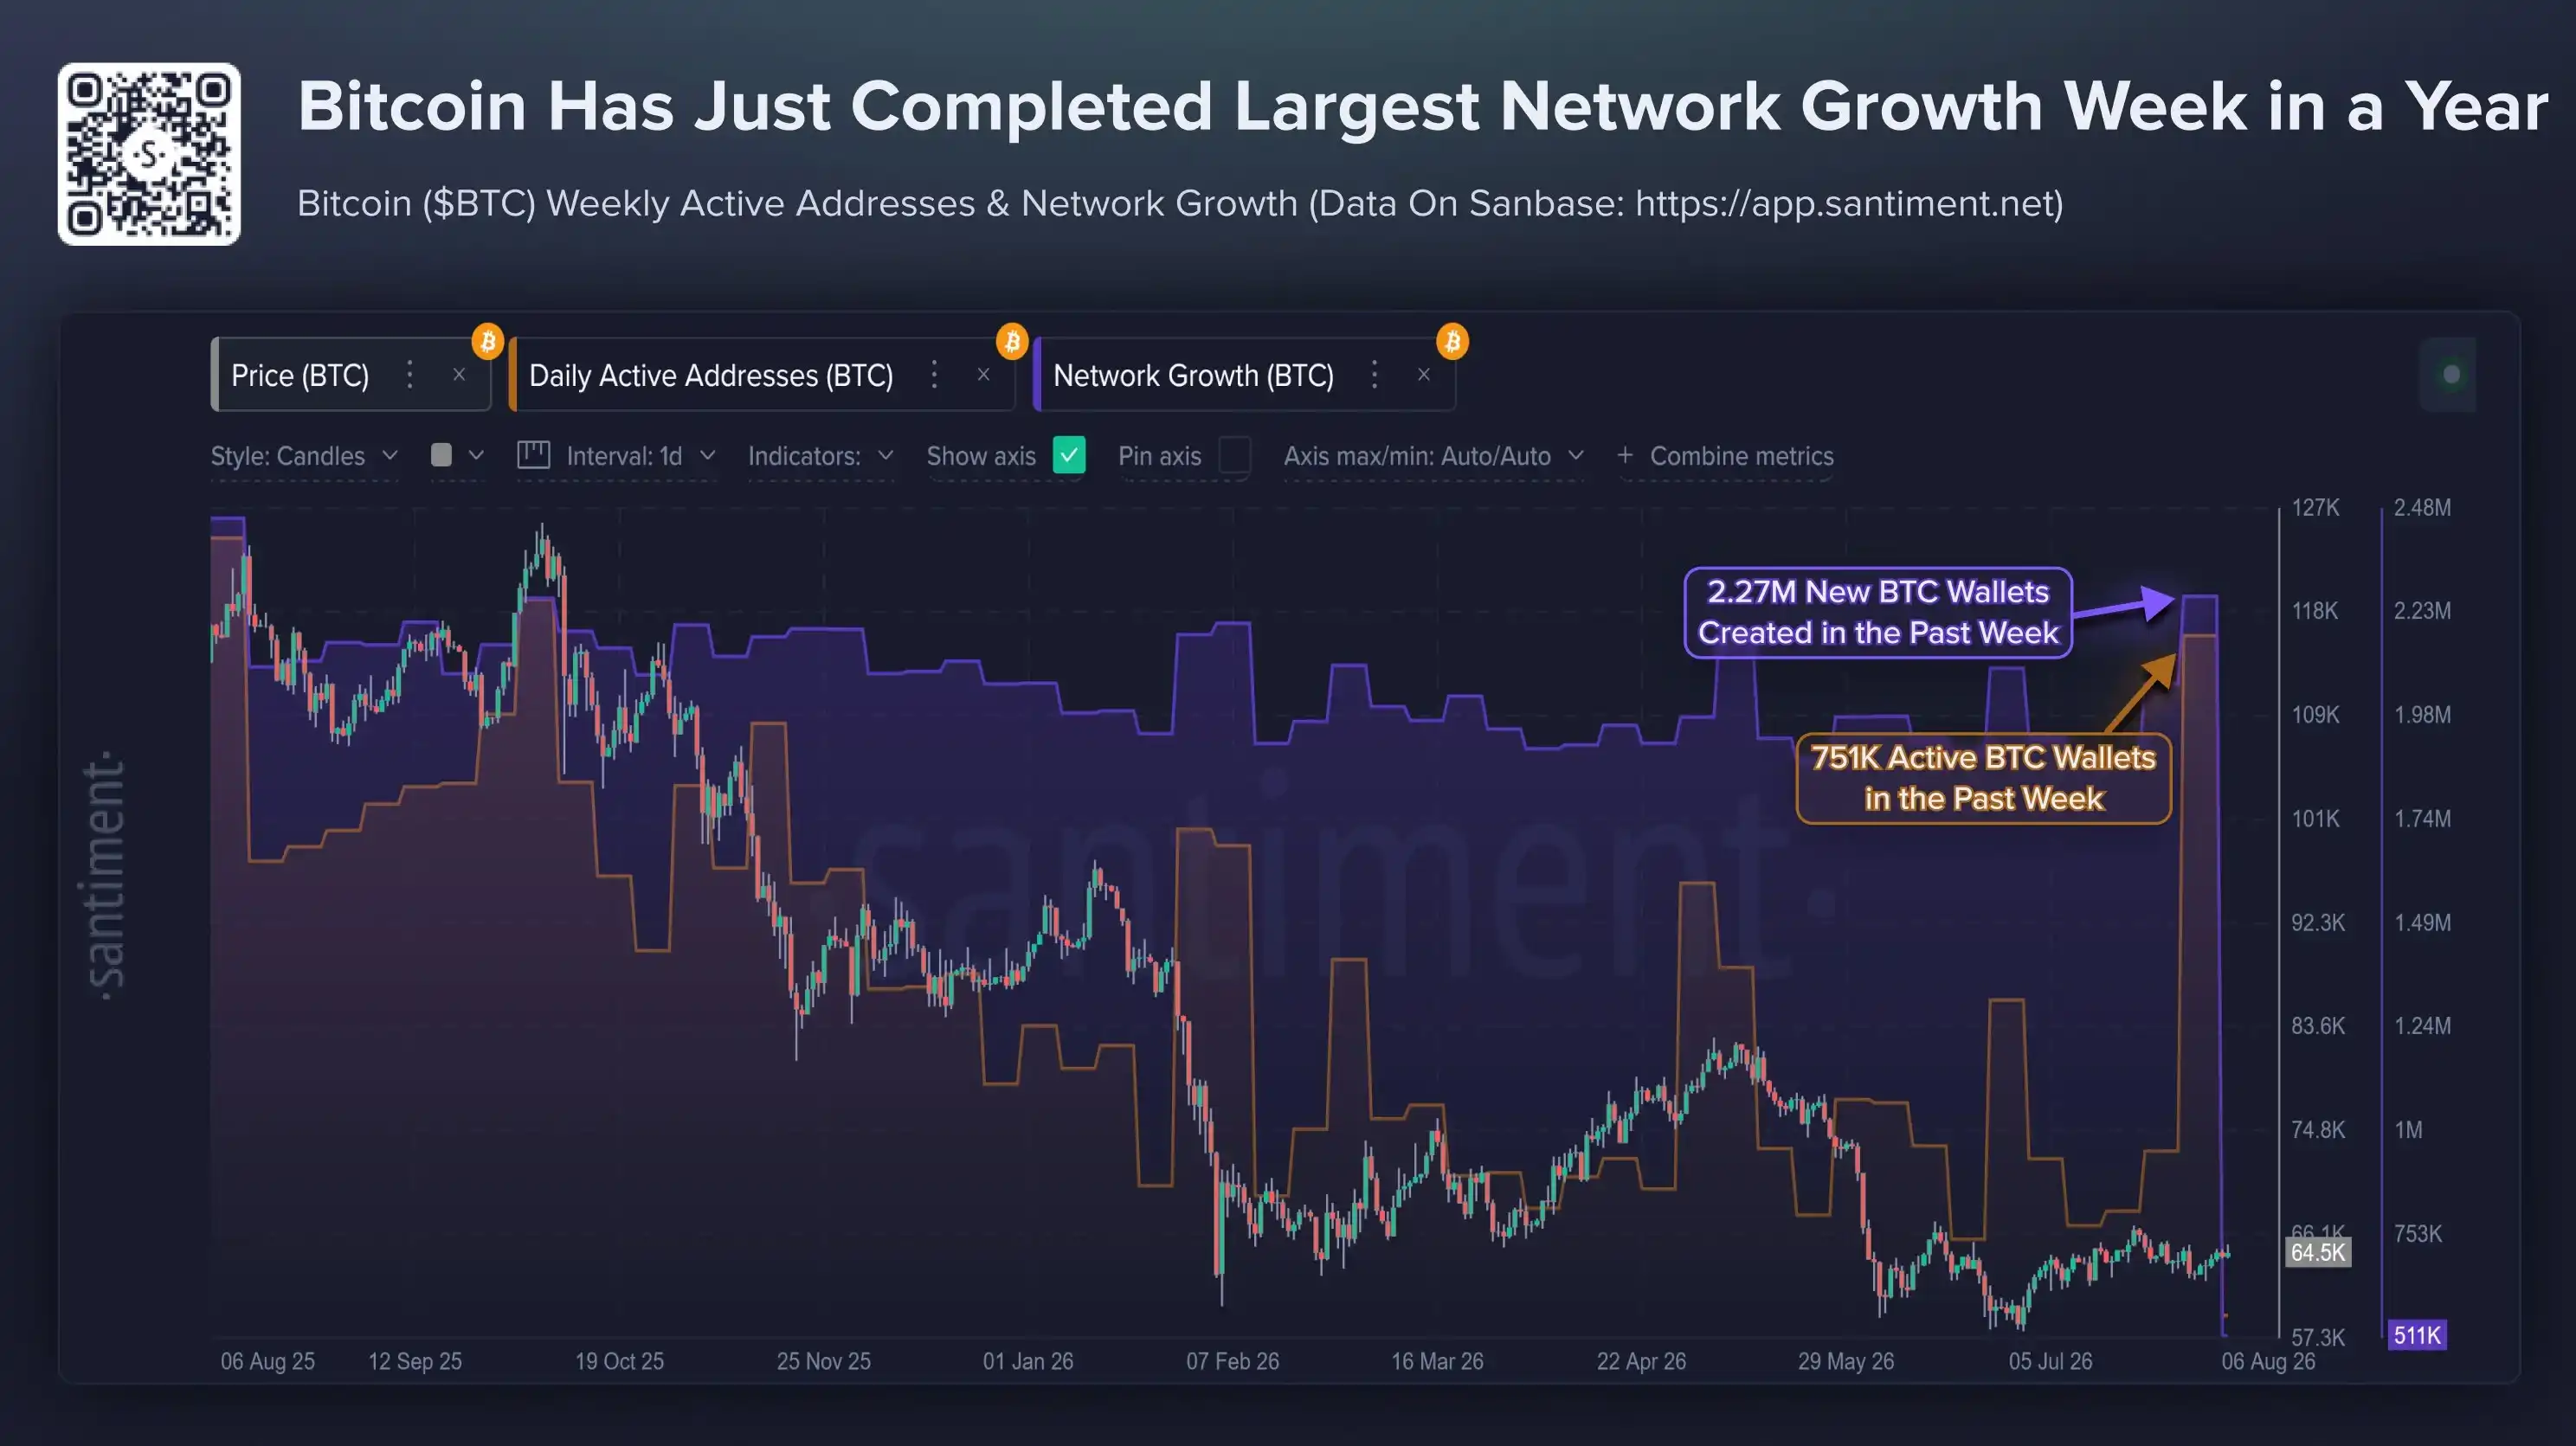
On-chain participation has picked up. Santiment Intelligence data showed the Bitcoin network added 2.27 million new BTC wallets over the past week, the highest reading in nearly a year. Active wallets reached 751,000, the highest in 10 months.
Still, the increase was not presented as a clean risk-on signal. The report said an important catalyst came from security concerns linked to the Coldcard wallet incident, which pushed some users to move funds, open new wallets, adjust custody arrangements, and reassess asset security. That process materially increased wallet creation and on-chain interactions.
ETF flows improved as well. According to SoSoValue, U.S. spot Bitcoin ETFs recorded net inflows on all five trading days last week, with cumulative net inflows of $854 million, the best weekly showing since April 17. Since the start of August, cumulative net inflows into spot Bitcoin ETFs have already exceeded four times the full-month level seen in July.
That marked a reversal from earlier pressure. Between May and July, U.S. spot Bitcoin ETFs saw cumulative net outflows of more than $6.59 billion, and the market went through eight straight weeks of withdrawals.
Even so, the rebound in ETF demand has not been large enough to spark a price recovery. The report said recent inflows were driven mainly by shifts in custody demand and by softer employment data that improved rate-cut expectations, while the scale of buying has not fully offset ongoing selling pressure.
Miner selling, crypto DAT sales, and weak U.S. spot demand are weighing on BTC
Bitcoin is still facing steady selling from miners and crypto DAT companies. As margins narrow, operating costs rise, and the need to pivot toward AI data centers grows, some mining firms have been selling Bitcoin to cover cash flow needs, repay debt, or adjust business direction.
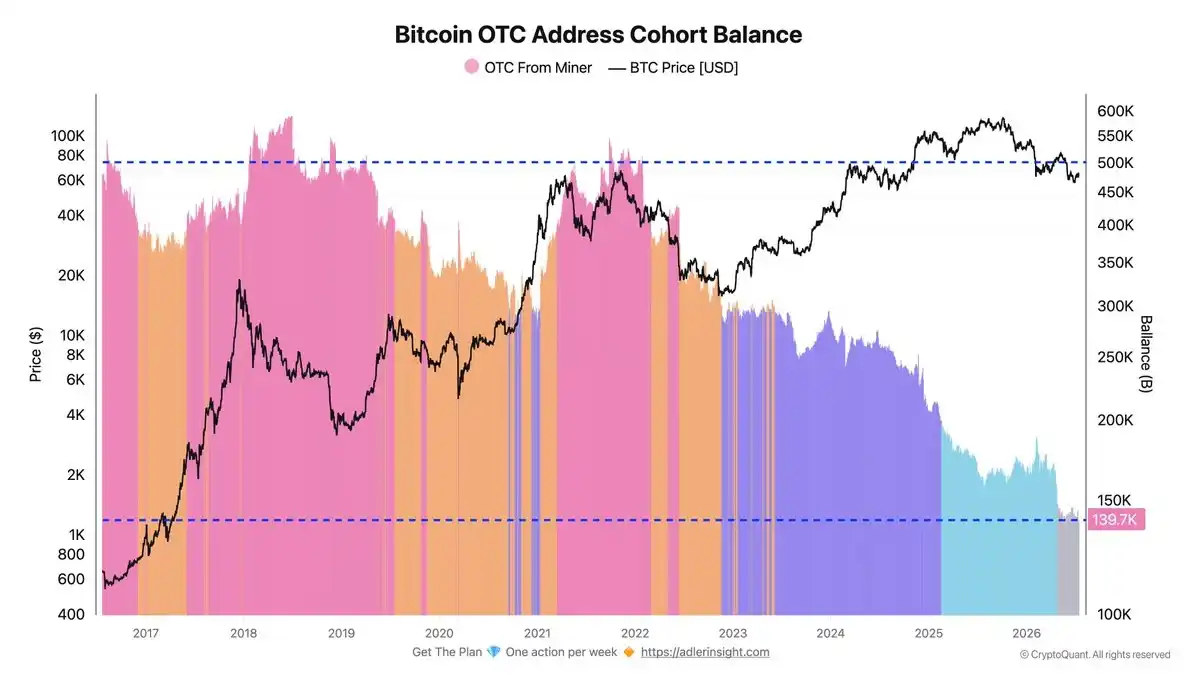
CryptoQuant data showed that since November 2021, the BTC balance held by miner-linked over-the-counter addresses has dropped from about 500,000 BTC to 139,700 BTC, a decline of nearly 72%.
Crypto DAT companies are also changing how they manage Bitcoin holdings. The report said some have sold part of their positions to add liquidity, buy back shares, or fund shareholder returns, while others have liquidated more aggressively to survive. As one example, Strategy has sold a cumulative 6,948 BTC since late June, raising about $432 million.
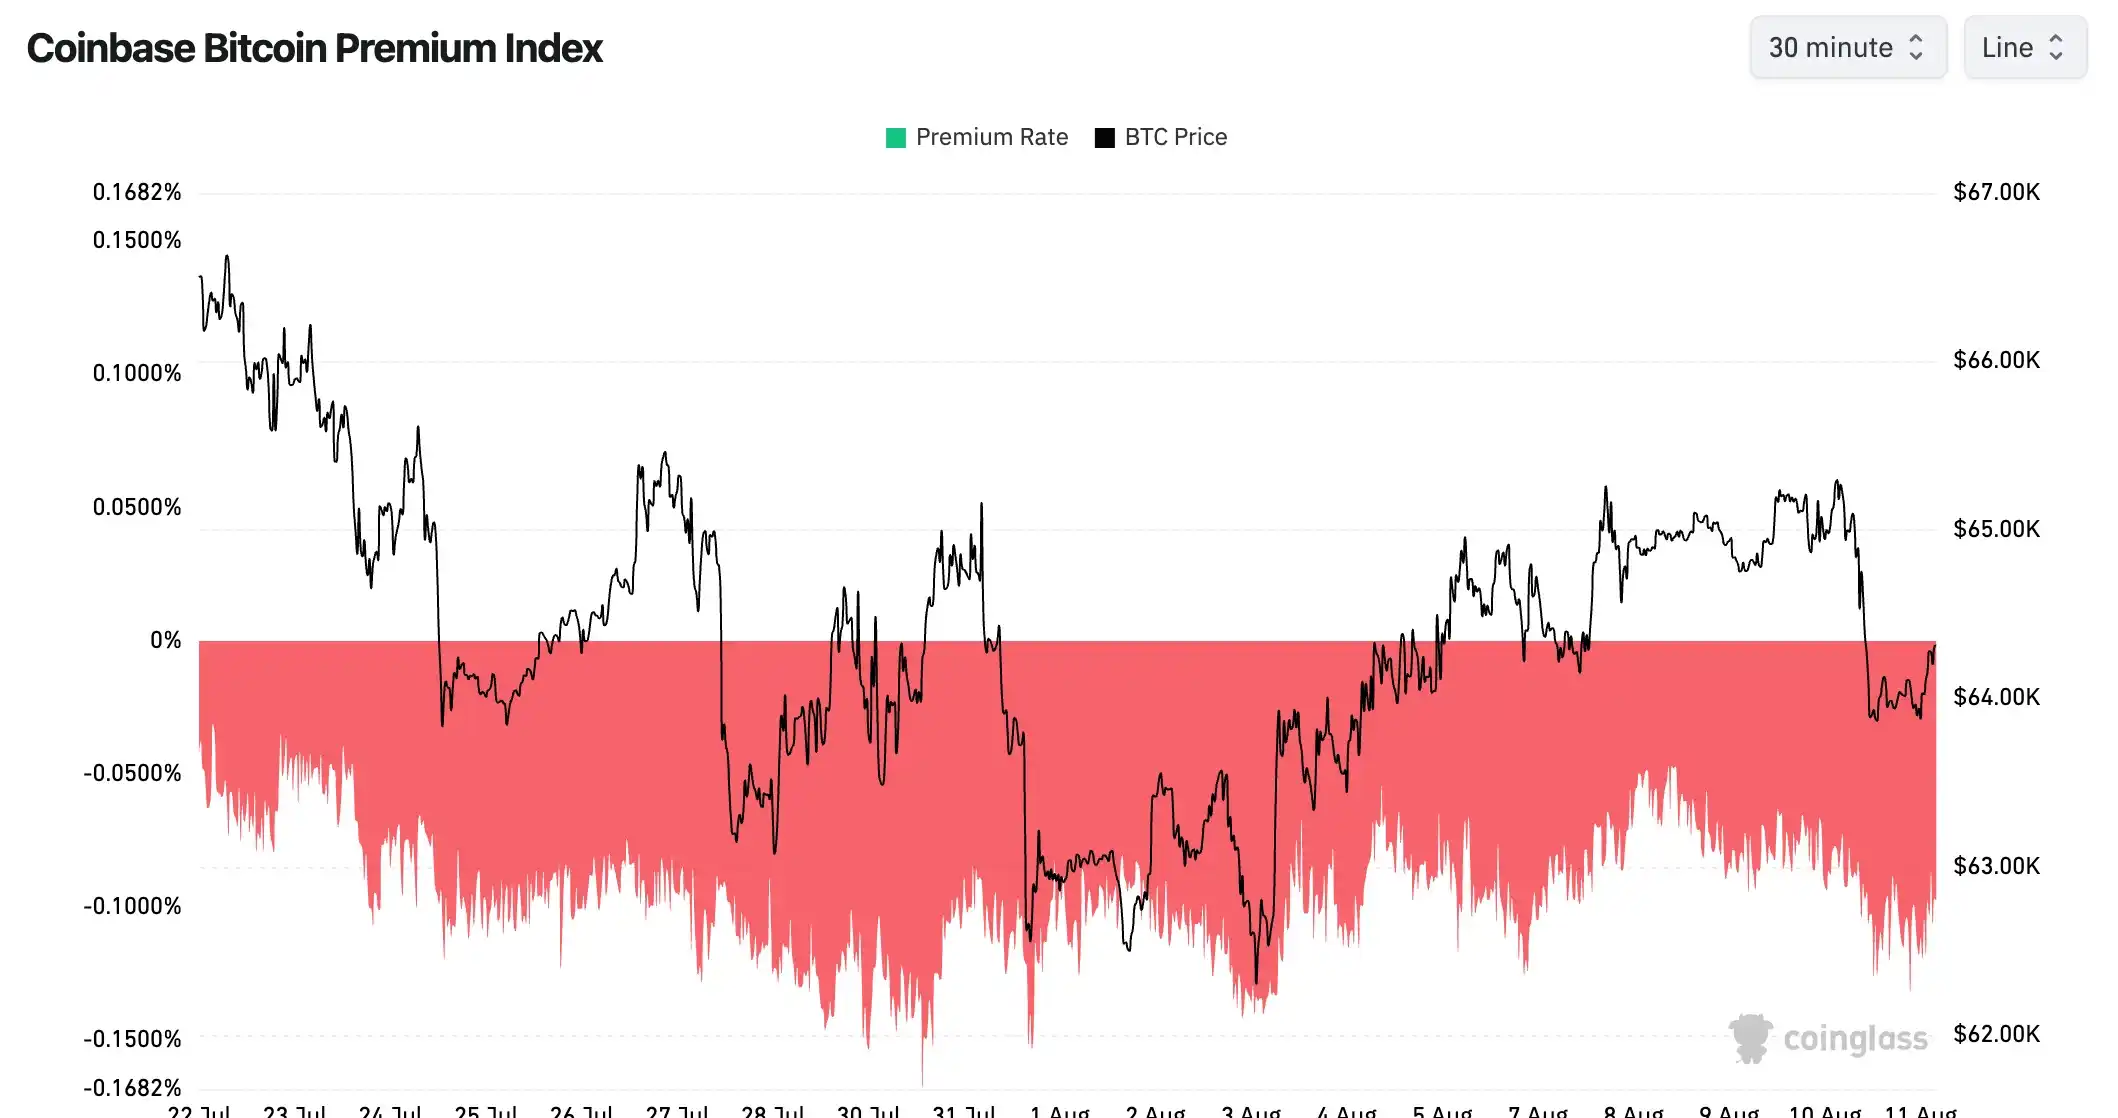
U.S. spot buying power remains weak. Coinglass data showed the Coinbase Bitcoin Premium Index has stayed negative for 80 straight days, from May 19 through the present in the report, with the latest reading at -0.0868%. That is the longest negative premium streak on record and twice the previous 40-day record. Historically, a sustained negative Coinbase premium has tended to point to weak buying demand from U.S. investors or persistent selling pressure in the market.
Four of 12 bottom-fishing indicators have entered hit zones
The report noted that in past cycles, Bitcoin has usually taken about 12 to 13 months from a cycle top to reach a final bottom. If that historical rhythm holds in the current cycle, the market low may not arrive until the fourth quarter of 2026.
PAData, the crypto market data and cycle indicator platform run by PANews, showed that Bitcoin is displaying only partial bottoming signals at this stage.
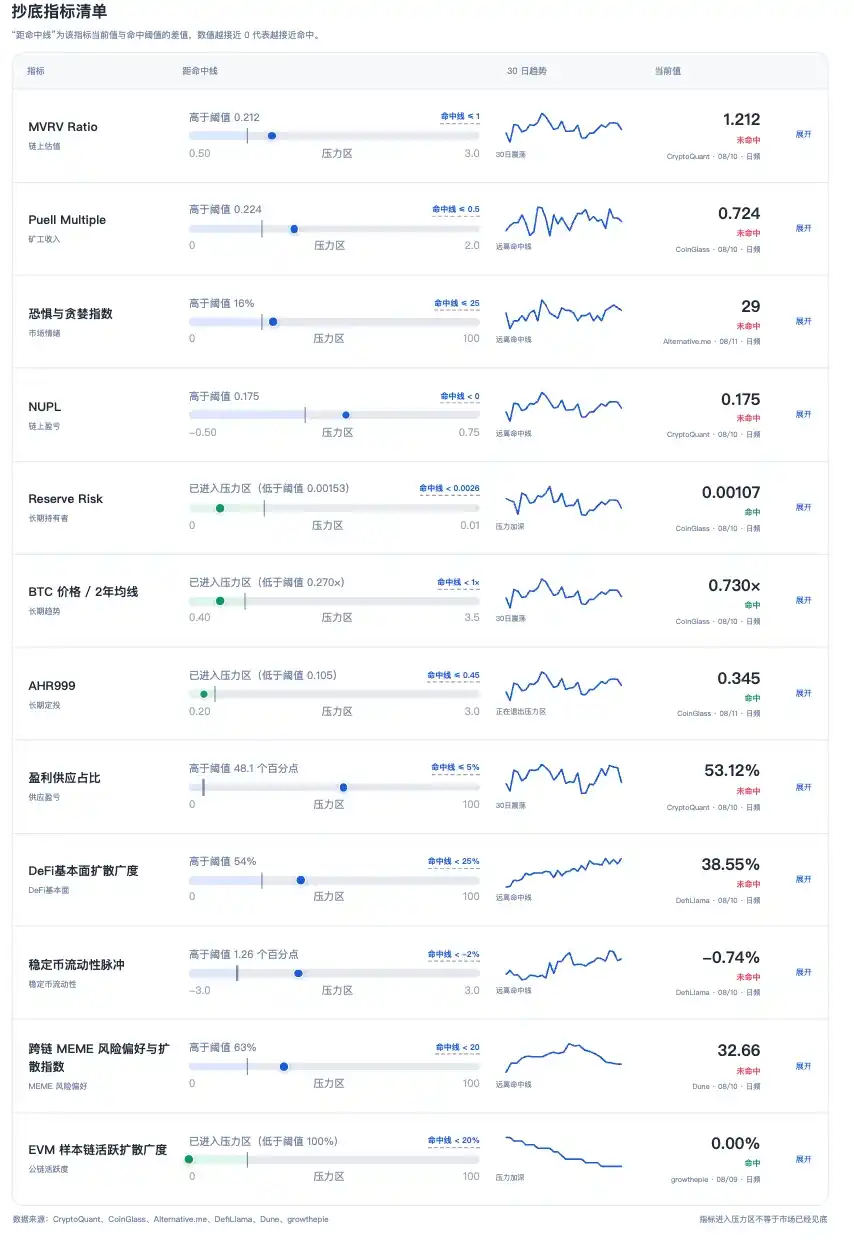
The dashboard draws from sources including CryptoQuant, CoinGlass, Alternative.me, DefiLlama, Dune, and growthepie. It uses a measure called the distance to trigger line to show how close a live reading is to a historical bottom-fishing threshold. The closer the figure is to 0, the nearer it is to a historical trigger.
Among 12 core bottom-fishing indicators, 4 have entered hit zones:
- Reserve Risk (long-term holder confidence)
- BTC price / 2-year moving average
- AHR999 (long-term dollar-cost averaging)
- Active breadth across sampled EVM chains
The current readings were listed as 0.00108 for Reserve Risk, 0.73x for BTC price / 2-year moving average, 0.345 for AHR999, and 0 for active breadth across sampled EVM chains.
Those indicators mainly reflect long-term holder confidence, price position within the broader cycle, and on-chain ecosystem activity. The report said they have moved into historical stress zones, indicating that Bitcoin is trading at a clear discount to its long-term trend and that long-horizon allocation value is improving.
Broader metrics still stop short of a confirmed cycle bottom
Entering stress zones does not mean the market has already bottomed. The report argued that Bitcoin bottoms have usually not been called by any single indicator. In past cycles, a final bottom tended to form only after several dimensions reached extreme levels at the same time.
At present, the report said valuation, sentiment, liquidity, and on-chain profitability metrics still suggest the market is some distance from the deepest historical bottom range.
Valuation
The MVRV Ratio stands at 1.212 and has not fallen below 1, which the report described as a historical undervaluation line. MVRV compares Bitcoin’s market value with realized value to gauge the market’s aggregate profit condition. Historically, readings below 1 have often aligned with deep adjustment phases and late-bear-market accumulation zones.
On-chain profitability
NUPL is at 0.175 and has not turned negative. The metric tracks net unrealized profit and loss across the market; a reading below 0 means holders as a whole are in loss.
Miner revenue indicator Puell Multiple is currently 0.755, still above the historical stress area below 0.5. The report said major macro bottoms in the past have appeared when Puell Multiple dropped under 0.5.
Market sentiment
The Fear and Greed Index is at 29, showing panic but not extreme panic. In the report’s framing, that means investor risk appetite is falling, yet the kind of widespread capitulation often seen near cycle lows has not appeared.
Supply structure and liquidity
The proportion of supply in profit remains 53.12%, meaning more than half of all Bitcoin supply is still sitting on gains. In prior bottom phases, that figure usually fell below 5%, which suggests the market often needed much deeper loss realization and more complete coin redistribution before a durable low formed.
The stablecoin liquidity pulse is now -0.74%, indicating some contraction in the stablecoin funding environment. Historical observation in the report suggested readings below -2% have usually matched a notable decline in fiat-backed stablecoin supply over 30 days and heavier liquidity stress. The current level is still above that extreme contraction zone.
On-chain ecosystem activity
Some ecosystem indicators have not fully bottomed either. DeFi fundamental breadth is at 38.55%, still above the deep contraction zone of 0% to 25%. The measure is used to assess how broadly DeFi operating activity is spreading across the sector; low readings generally point to widespread contraction.
The cross-chain MEME risk appetite index is 32.66, above the 0 to 20 cooling zone threshold. That suggests risk appetite has weakened materially, but capital has not yet moved into a fully washed-out state.
Partial bottom signs are visible, but a recovery still needs confirmation
Taking the indicators together, the report concluded that Bitcoin is showing some bottom signals, but not enough to confirm a cycle reversal. Whether a recovery can begin from here will depend on the durability of capital inflows, the degree to which selling pressure eases, and whether key on-chain metrics move closer to the historical bottom ranges seen in previous cycles.