

Model revision lifts the current reading to 24.3
Jake Pahor said the latest Bitcoin reading from his valuation framework is 24.3, placing BTC in the bottom 20% of all observations across its history. Two weeks earlier, he had described Bitcoin as sitting in the bottom 3% zone, but he said the change came from a rebuilt model rather than a sudden swing in the market.
According to Pahor, the older framework had a known flaw: it compared today’s price with Bitcoin’s entire price history, including early periods when BTC could rise or fall by thousands of percentage points within months. Because those moves are unlikely to repeat, they kept pushing the score lower over time and made the top end of the scale harder to reach.
The rebuilt version, CSH Score v4.1, is now live. Pahor said it measures where price sits inside a fair-value band that projects forward with the asset instead of staying anchored to 2012. The scale still runs from 0 to 100. He said the new model was tested against 21 manually labeled cycle tops and bottoms in Bitcoin’s history and showed roughly 35% better accuracy than the previous version.
He did not lay out the full methodology in the article, but said a plain-language version has been published on the website along with historical data.
Prior bear-market bottoms all spent time below 20
Pahor wrote that every Bitcoin bear market since 2014 ended the same way on this model: the score spent a meaningful period below 20 before the turn.
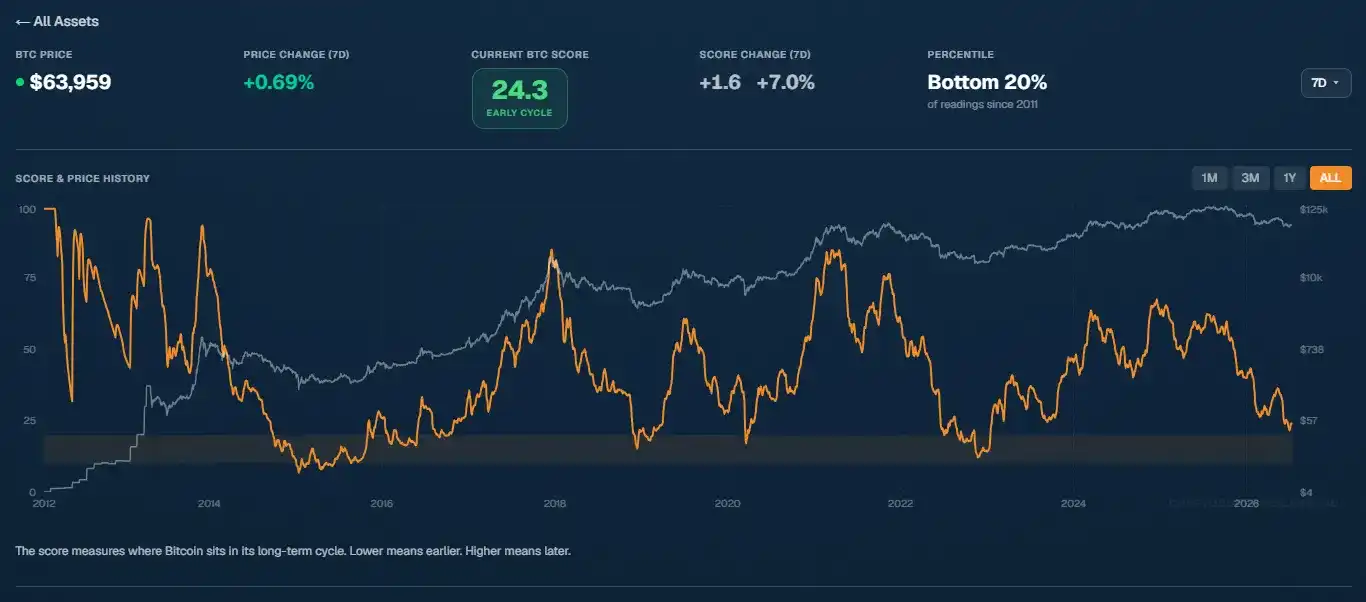
- The 2015 bottom printed around 7.
- The December 2018 bottom printed about 15.
- At the November 2022 price low of $15,742, the score read 18 and stayed below 20 for weeks around that period.
This cycle has not done that yet. The lowest reading so far was 21.5 on July 1, when BTC traded at $58,550. Pahor said that is close, but not there.
His interpretation was straightforward: by the standard of every prior cycle, the market has not yet seen the kind of washout that historically marked the end. He also raised another possibility, that this cycle could remain shallower than the last. He noted that the October 2025 top scored 59, well below the 74-plus readings seen in earlier euphoric periods, and said a compressed top could also mean a compressed bottom. He added that the model is a map of where the market is, not a forecast of where it will go.
He said he bought on July 1 and would buy harder below 20
Pahor said he bought Bitcoin on July 1 because his plan had a trigger at that level, not because he knew it was the bottom. He described the day as ordinary, with the cheapest score of the cycle showing up quietly and no alerts going off on his phone.
He said he is still holding a large amount of capital in reserve, with deployment rules tied to score levels rather than daily emotion. If the model prints below 20, his plan calls for more aggressive buying. If it never gets there and the market turns anyway, his regular dollar-cost averaging has already put him in position.
Dashboard figures: BTC above the 200-week moving average, BTC/gold ratio near a three-year low
At the time of writing, BTC was at $64,085, up 0.96% on the week. The score stood at 24.3, up 1.6 points over the same period, or about 7%. Pahor said the 20-to-30 zone has accounted for roughly 15% of Bitcoin’s 14.4-year history.
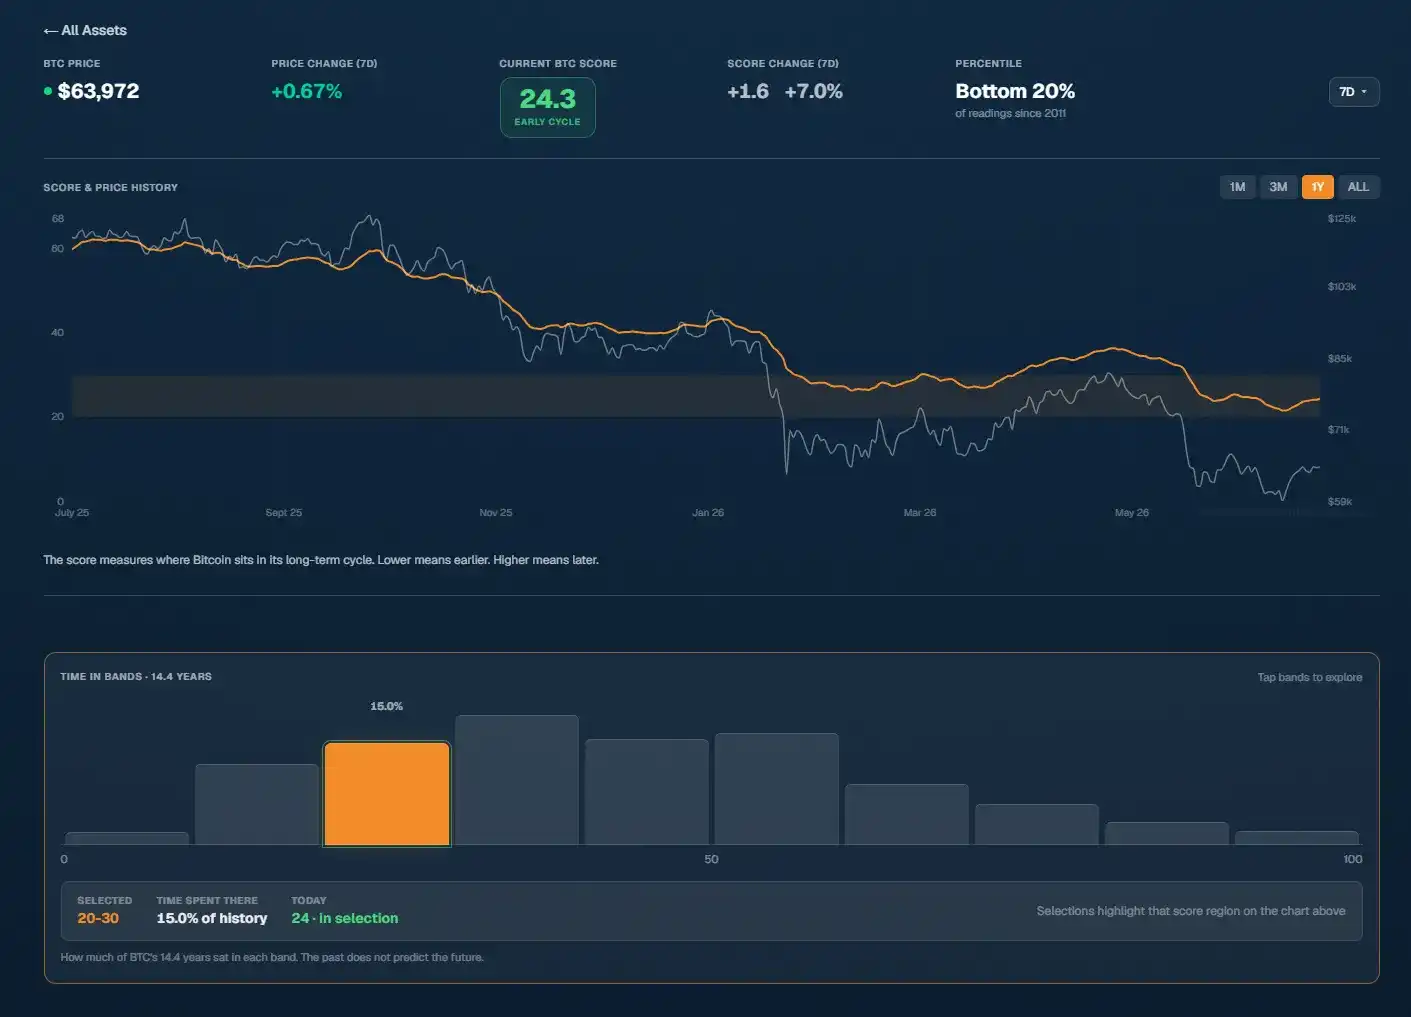
He also pointed back to July 1, when BTC hit $58,550 and the cycle’s lowest reading of 21.5. Since then, price has risen about 9.5%, and the score has moved up as well. He said that does not change his plan because the next level already has its own trigger.
On the technical side, BTC has reclaimed its 200-week moving average near $62.9K after losing that level on July 1. Pahor wrote that Bitcoin spent months below the same line in the last two bear markets, so a quick recovery is constructive, though he said his plan does not trade moving averages directly.
He also highlighted the BTC-to-gold ratio. One Bitcoin currently buys about 15.5 ounces of gold, the lowest reading in nearly three years. Gold has already pulled back sharply from a record high near $5,100 in January to around $4,120, but BTC has still lost ground against it. Pahor said the ratio has roughly halved since the October top, when one BTC bought nearly 30 ounces of gold.
Bitcoin dominance stood at 59%. On that basis, he said an altcoin season is not on the radar and that his plan is to accumulate the index leaders first and leave altcoins for much later in the cycle.
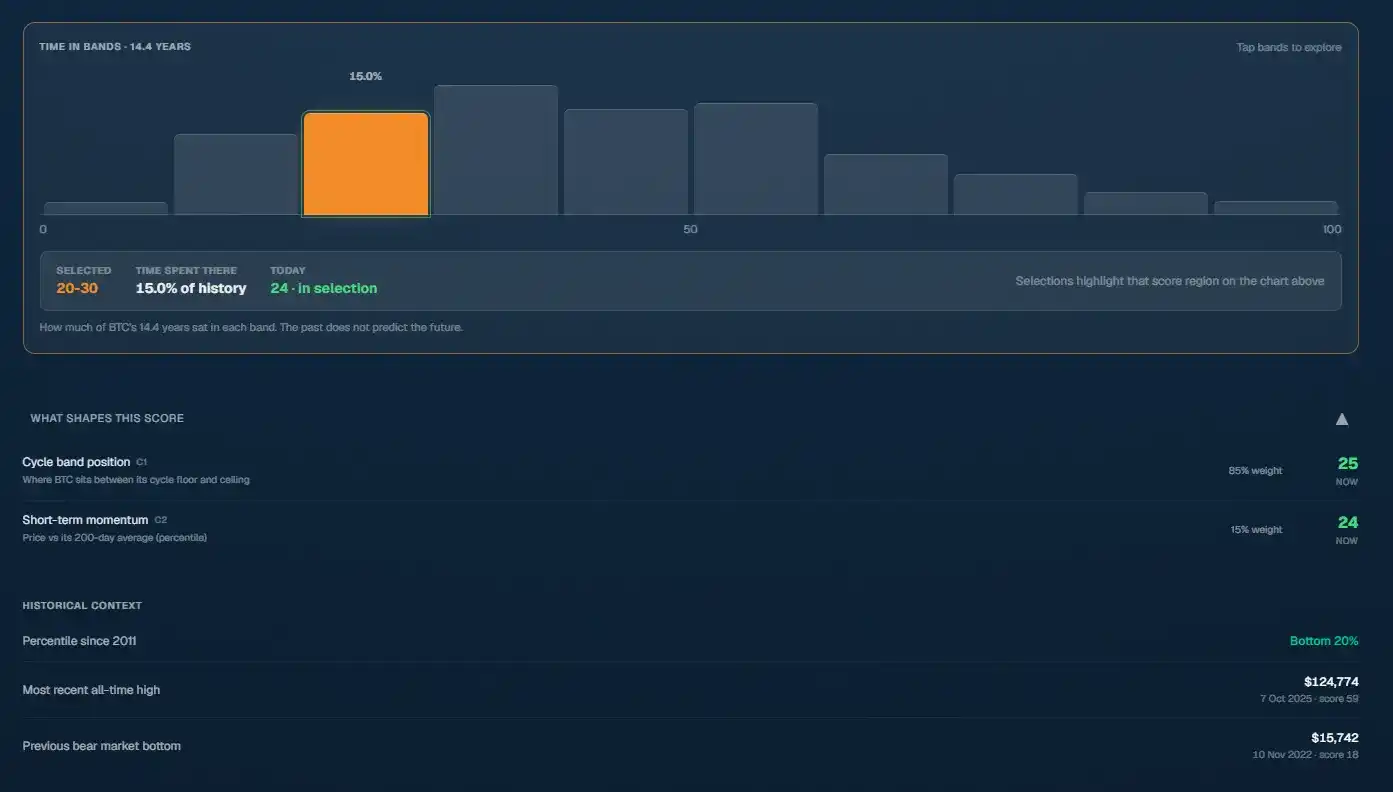
v4.1 is live for BTC, with ETH, SOL and XRP to follow
Pahor said CSH Score v4.1 has launched for BTC, with ETH, SOL and XRP next in line. He also said the website received a full UI overhaul across charts and mobile, and that the team completed a security audit before rolling out a paid founder plan.
That founder plan will have 100 seats with permanently locked discount pricing, according to the article. Pahor also apologized to users whose real-time plans may have shifted because model-trigger readings changed after the update, adding that the full changelog is available on the website.
Three things he is watching next week
For next week, Pahor said he is focused on three indicators: whether BTC can hold above the 200-week moving average near $62.9K, whether the score moves toward 20, and whether the BTC/gold ratio stops falling. He said a drop below 20 would lead his plan to buy more aggressively, while stabilization in the BTC/gold ratio would be an early sign that hard-money capital is beginning to look back at Bitcoin.
He added that the team spent 10 to 12 weeks rebuilding its own model before asking anyone to pay for it, and that the result made today’s market look less like a bottom, not more.