

This week, Bitcoin's daily structure has shown signs of weakening, making the key question whether a short-term bounce can break through the upper boundary of its descending channel. At the same time, HYPE's seven-wave rally may be approaching its culmination. Last week, we already noted that BTC remained in a corrective, range-bound downtrend, favoring a “sell on rally” approach—a view validated by the actual price action. Below, we examine the current formations across multiple timeframes and lay out short- to medium-term trading references.
Multi-Timeframe Bitcoin Structure: Channel Breakdown, Feeble Bounce
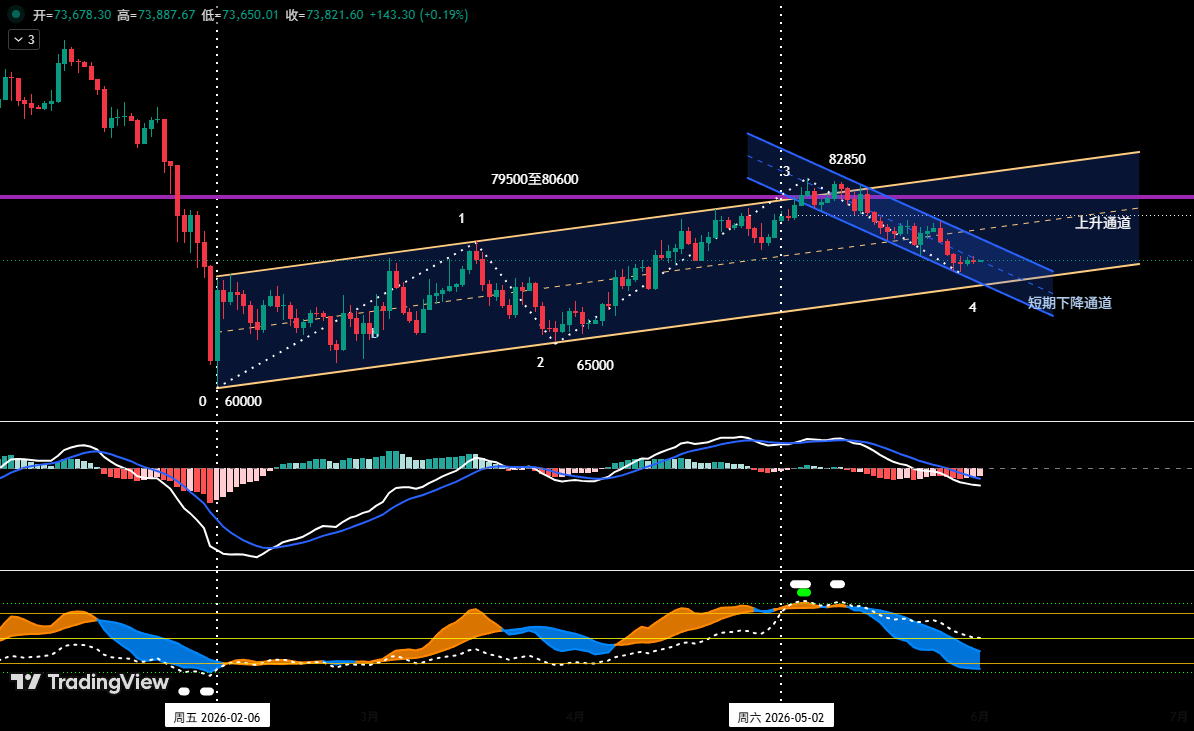
Since the February 6, 2026 low, Bitcoin has been oscillating higher within an ascending channel (yellow). Its lower boundary connects the February 6 and March 29 lows, while the upper boundary parallels it through the March 17 high. Currently, price has fallen below the channel’s midline and is seeking stronger support at the lower boundary. Separately, after peaking at $82,850 on May 6, BTC entered a short-term descending channel (blue), where the upper rail links the May 14 and May 26 rebound highs and the lower rail connects the May 7 and May 23 lows, landing around $72,500. Having found brief support at that lower rail, the price is now staging a weak bounce toward the descending channel’s upper line.
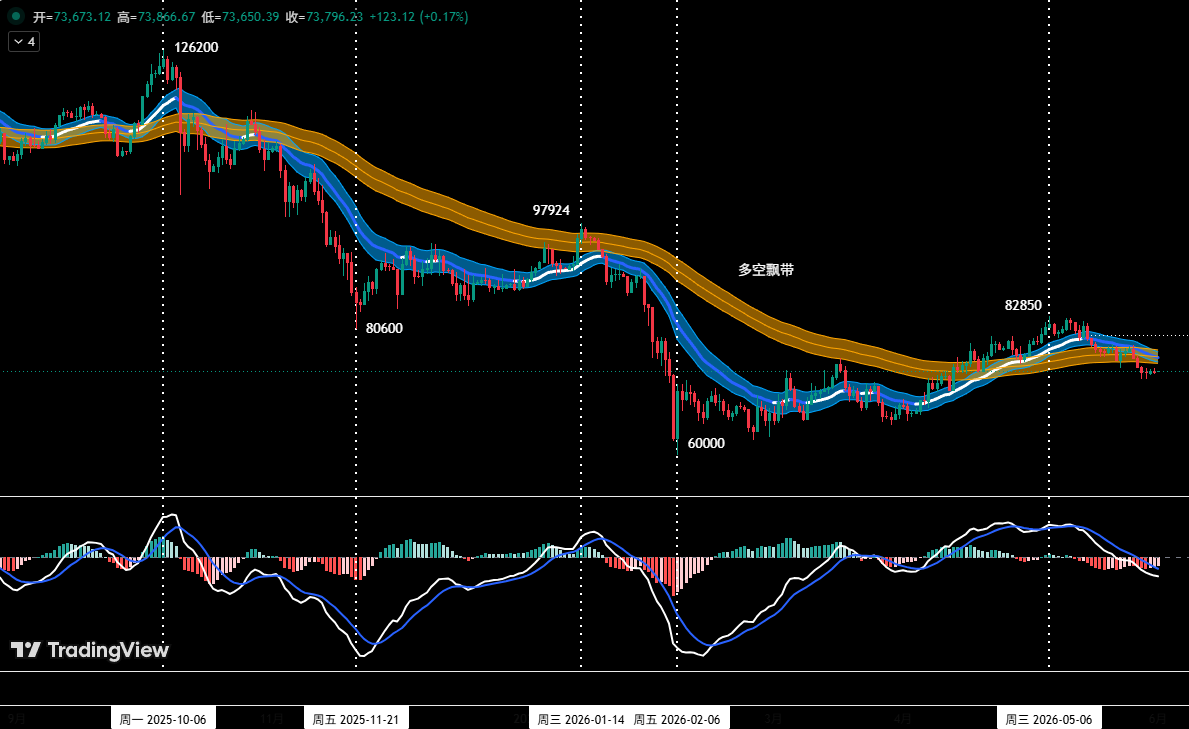
Overall, Bitcoin is caught between the pressures of two channels on different timeframes. The current rebound chiefly repairs short-term oversold conditions, with an upside target of the descending channel’s top. However, the break below the midline of the mid-term ascending channel has weakened the technical structure. Once this bounce exhausts itself, the price is likely to resume its prior downtrend and test the ascending channel’s lower boundary again.
BTC 4-Hour Structure: A Ten-Segment Correction and Two Shorting Plans
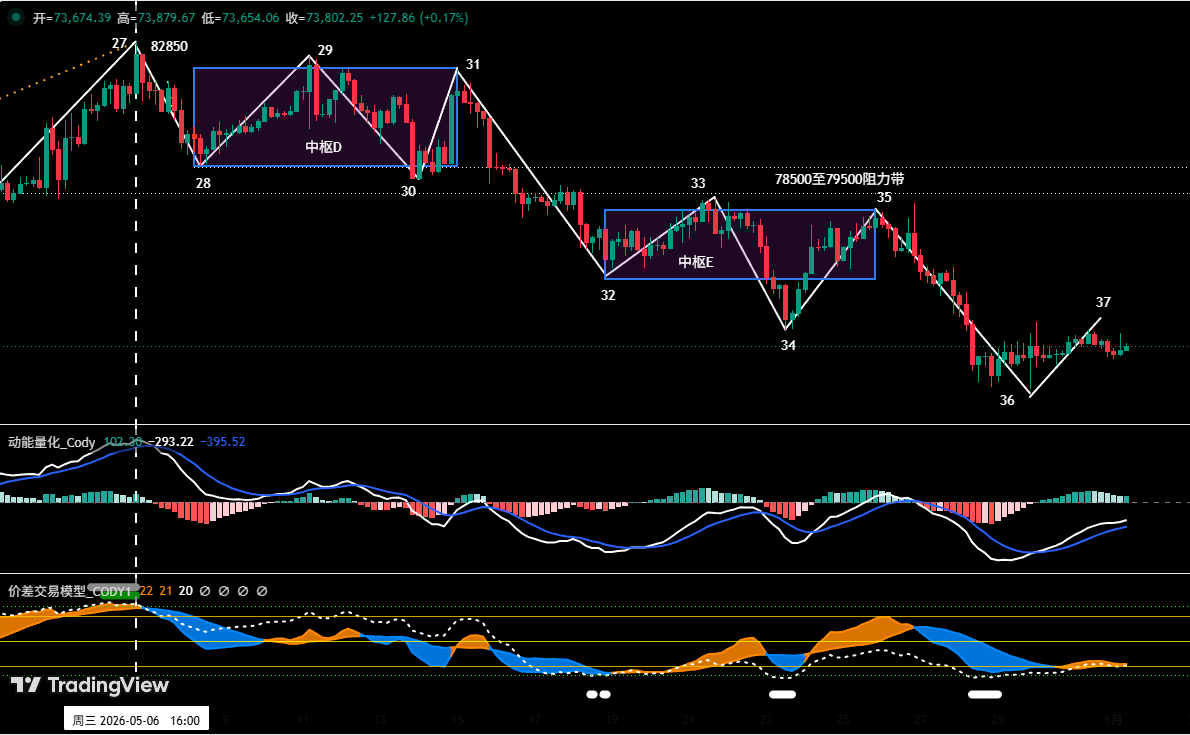
On the 4-hour chart, the correction from the May 6 high of $82,850 can be divided into ten segments, labeled from “27-28” to “36-37.” Within this sequence, two descending consolidation zones have formed: segments 28-29, 29-30, and 30-31 overlap to create Zone D, while segments 32-33, 33-34, and 34-35 overlap to create Zone E. The price is currently advancing in segment 36-37. Should it encounter resistance and fail to break through the $75,000–$76,000 area, the market will likely continue its lower-highs, lower-lows pattern and probe the $69,500–$70,500 support zone.
Key resistance levels are $75,000–$76,000 (near the lower edge of Zone E) and $78,500–$79,500 (the intersection of the two consolidation zones). Key support sits at $69,500–$70,500 and around $65,000.
For short-term trades, we deploy 30% of the position, looking for spread opportunities near these support and resistance areas on 30- or 60-minute charts. To handle complex market developments, we have prepared two scenarios:
Plan A: If the price rallies into the $75,000–$76,000 zone and shows rejection, combined with a top signal from our quantitative model, initiate a short position of up to 30% with an initial stop above $77,000. Close gradually as the price approaches key support and the model confirms.
Plan B: If the price breaks below the $69,500–$70,500 support area with a top signal, also open a short position (≤30%), with a stop above $72,000, and exit near major support.
HYPE’s Seven-Wave Top Signal: Growing Momentum Divergence
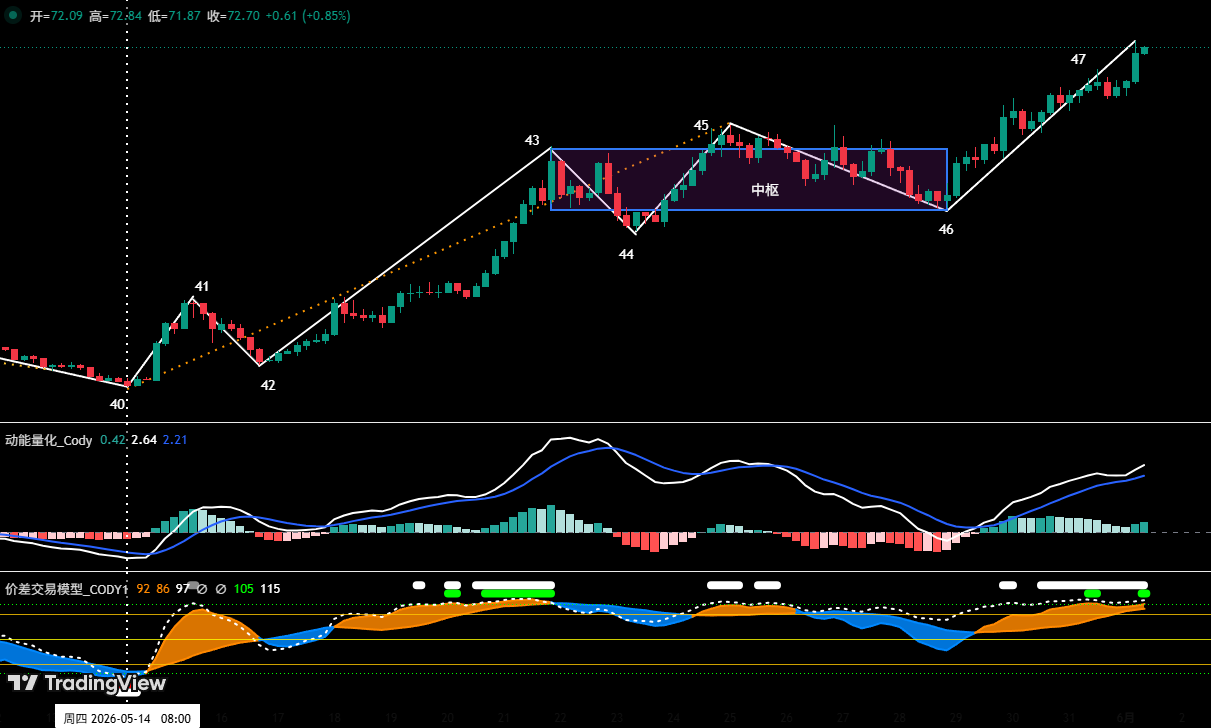
On HYPE’s 4-hour timeframe, the rally from the May 14 low of $38.14 has carved out a clear seven-wave structure (40-41 to 46-47), with segments 43-44, 44-45, and 45-46 overlapping to form an ascending consolidation zone. Earlier weekly reviews had already warned that “endpoint 45” exhibited bearish momentum divergence alongside a top signal from our spread-trading model, making a short-term peak highly probable. The market then dropped from $64.75 to $56.30, a maximum decline of 13.05%. Now, comparing the exit wave (46-47) with the entry wave (42-43), bullish momentum is fading, raising the odds of a momentum divergence. Our proprietary spread-trading model has triggered a strong top alert at “endpoint 47” (red dot + white dot).
This week’s focus: whether a momentum divergence is confirmed alongside endpoint 47’s top signal. If so, and if the price subsequently breaks below the $62.5–$64.57 support zone, endpoint 47 would mark the termination of the advance from the May 14 low.
Short-term trading should adopt a “buy dips, avoid chasing rallies” approach. Watch how the price reacts to the $62.5–$64.75 area. If stabilisation signals emerge there, supported by bottom signals from both models, light long positions (under 30%) may be considered with strict stop-losses. However, a decisive breakdown below this zone would escalate the correction to a daily-degree decline, with initial downside targets around $54–$56.3.
Last Week’s Short Trade Review and Risk Discipline
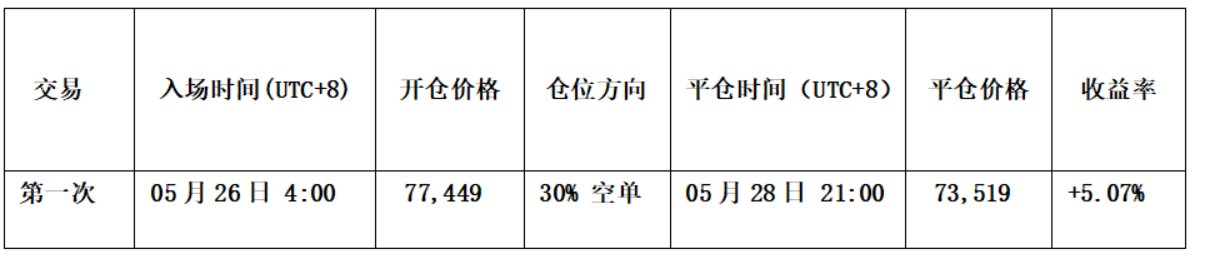
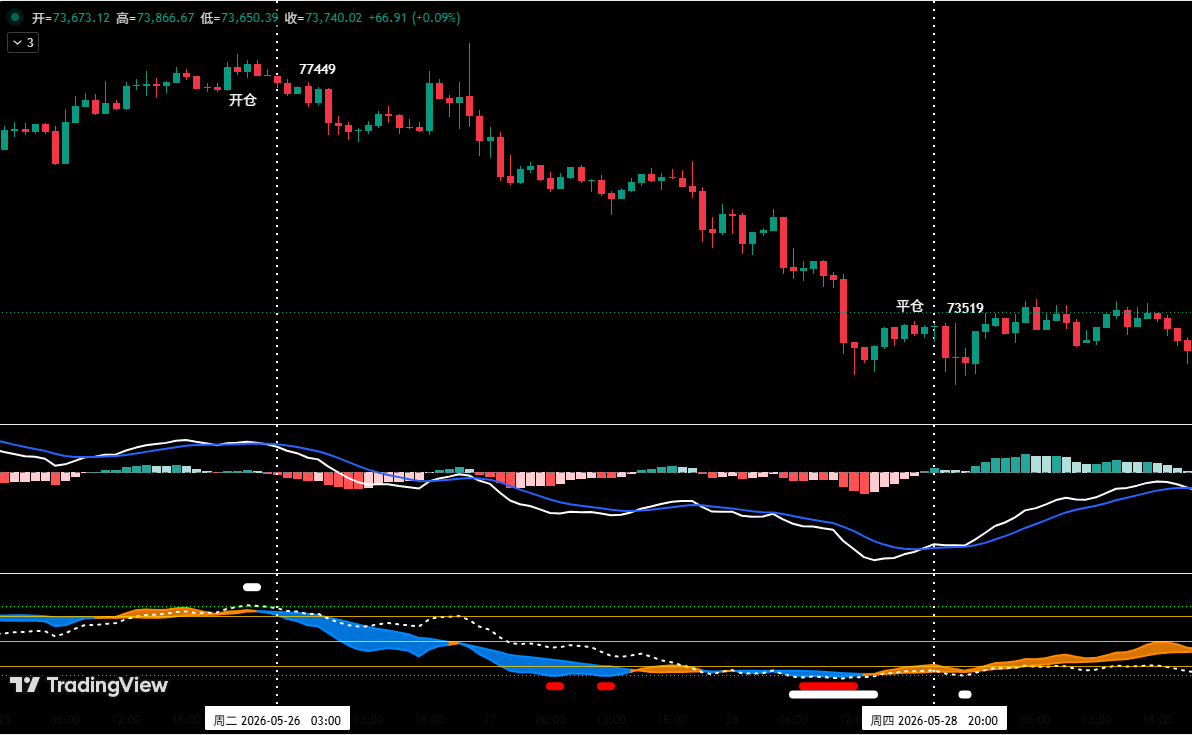
Following our own spread-trading and momentum quantification models, we executed one short-term short trade last week. When Bitcoin rebounded to around $78,000 and formed a bearish “top fractal” pattern, and both models signaled a top (white dot / divergence), we opened a 30% short at $77,449. After price fell to near $73,000, a bullish “bottom fractal” appeared alongside bottom resonance signals from both models, prompting us to close the entire position at approximately $73,519. The trade yielded a gain of about 5.07%.

Special note on risk management: Always set an initial stop immediately upon entry. Once profit reaches 1%, move the stop to the entry price. At 2% profit, trail the stop to lock in 1% of gain. Thereafter, for each additional 1% in profit, shift the stop-loss by a corresponding 1% to dynamically protect profits. Markets are perpetually changing, and all analyses and strategies must be adjusted accordingly. The views, models and strategies presented here are solely personal technical logs and do not constitute investment advice. Trading involves risk; exercise caution.