
Bitcoin (BTC) logged its second-longest losing streak of the year with five consecutive down days from May 15 to May 19. The pullback pushed the asset from above $80,000 to roughly $76,000 amid broad market weakness. Yet, on Bitfinex, leveraged traders doubled down.
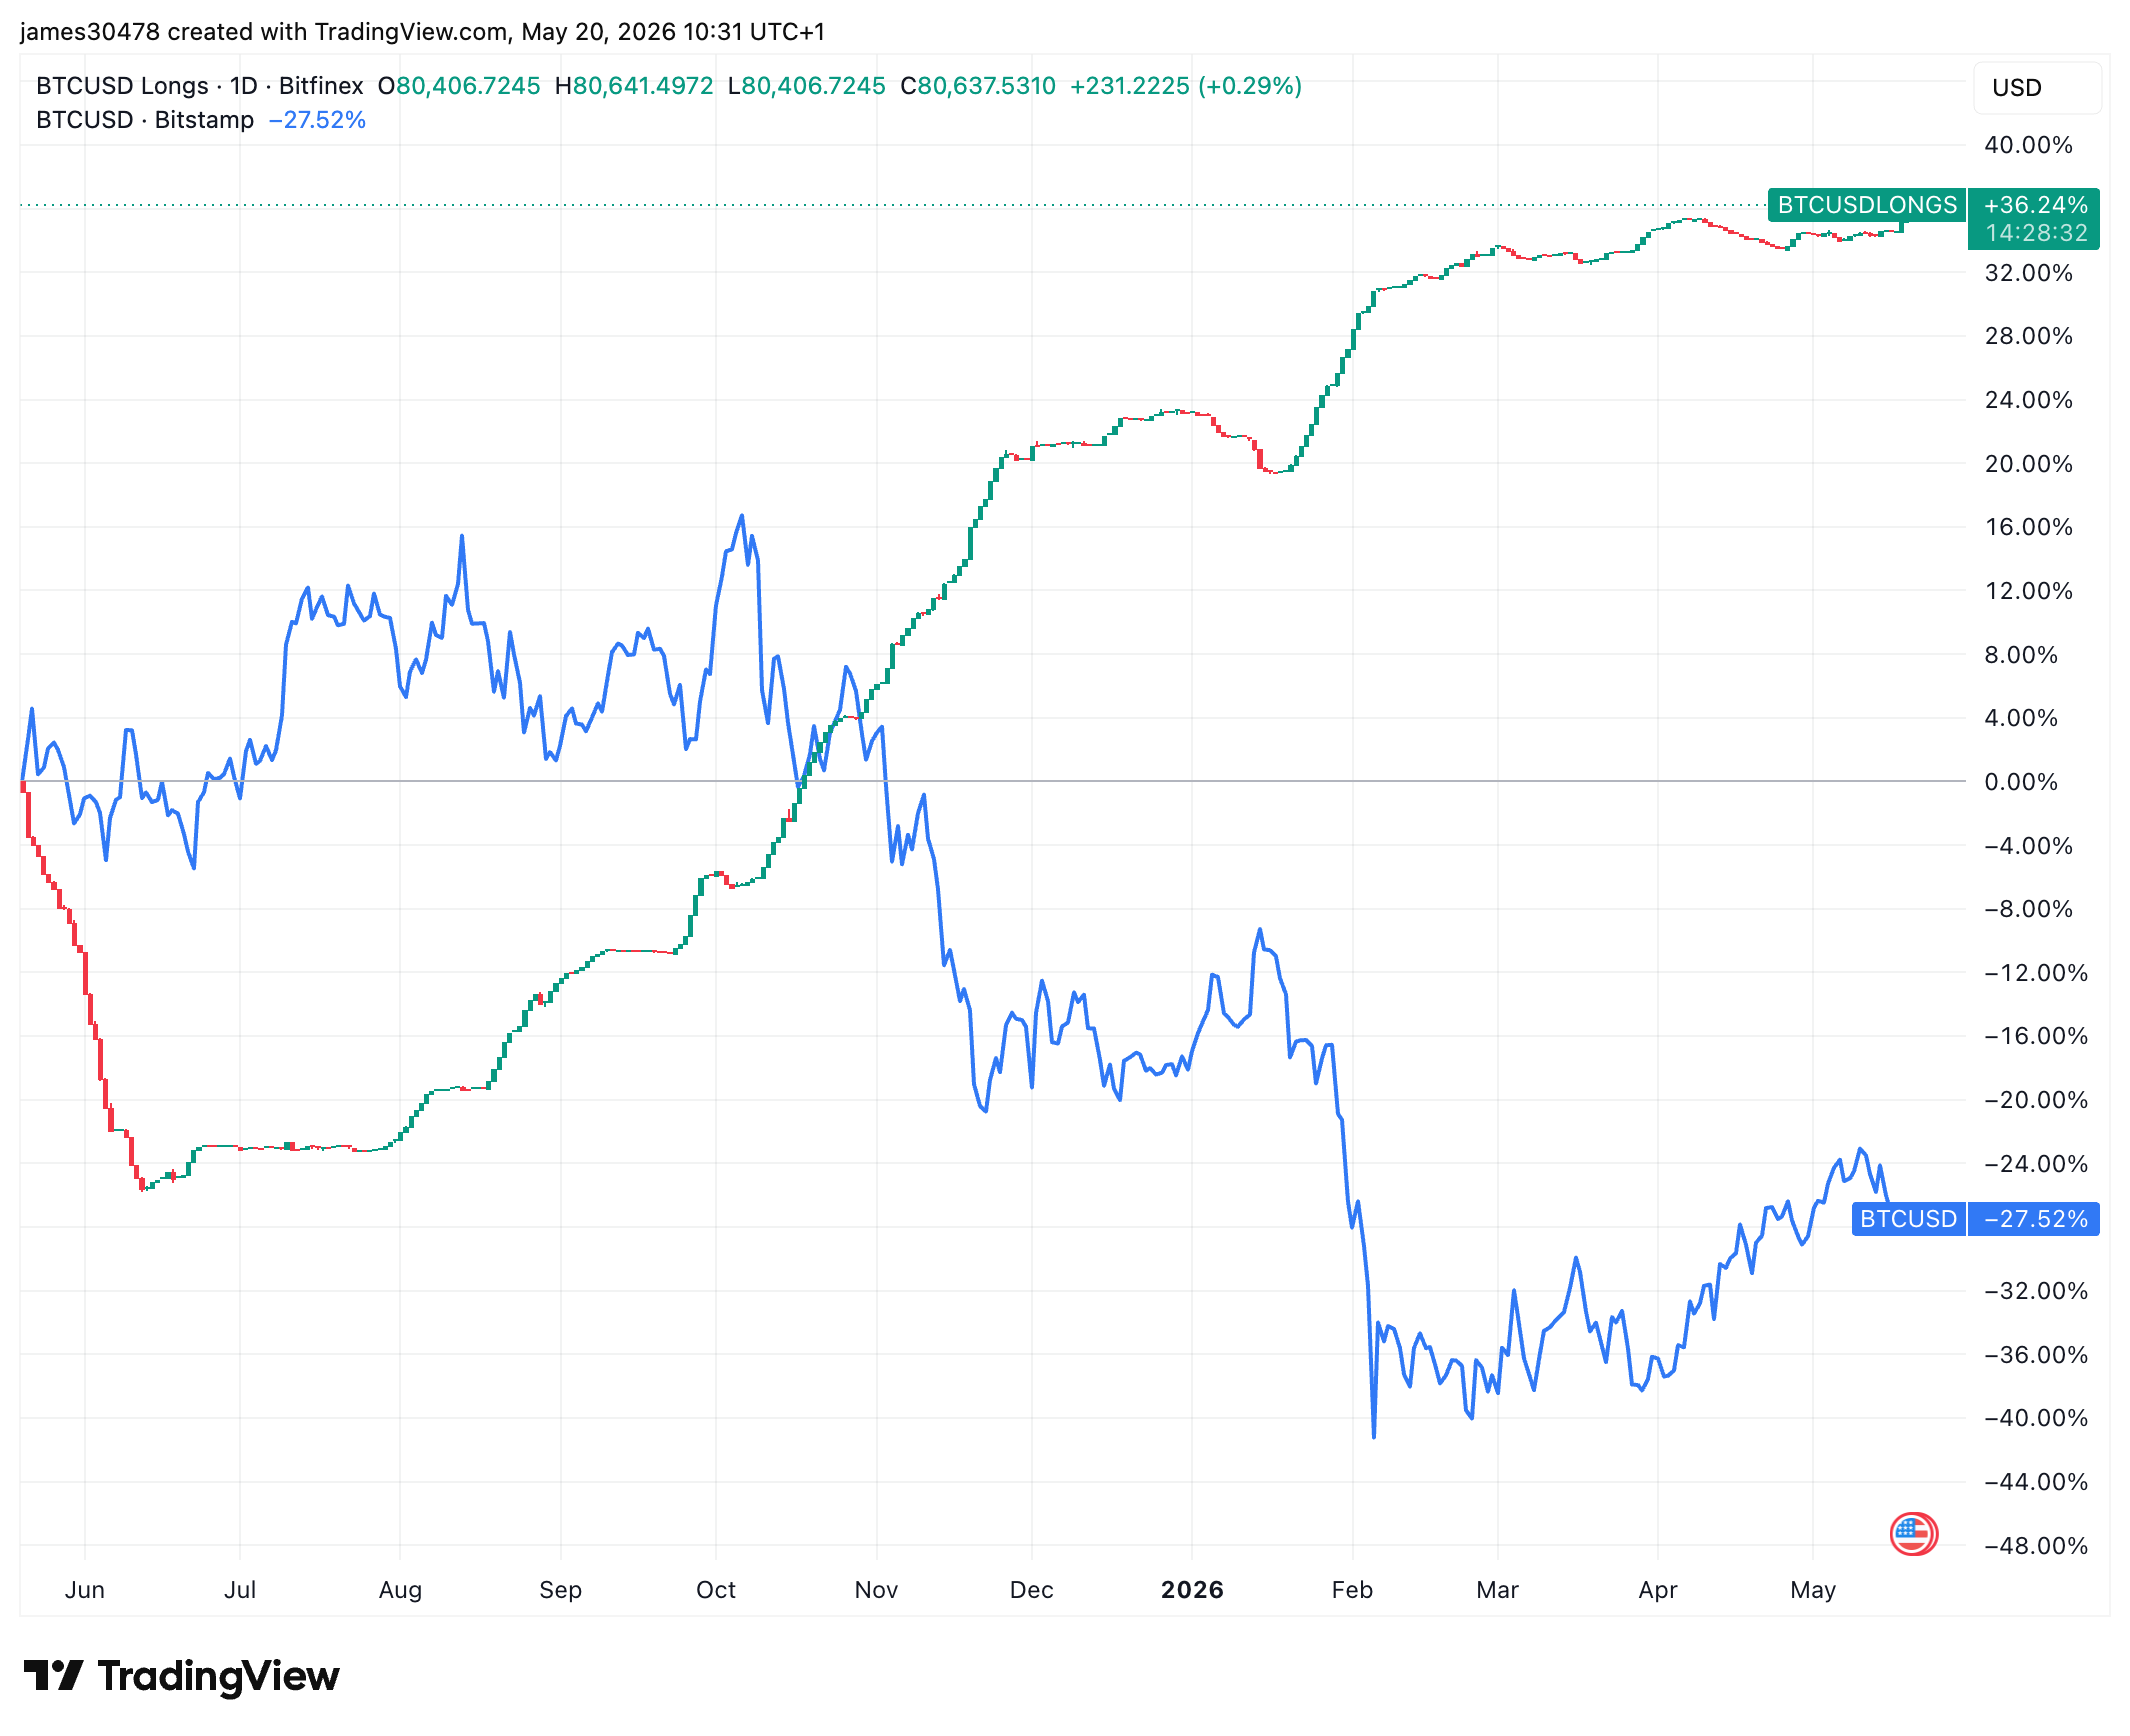
Margin Longs Surge to 80,636 BTC – Highest in 2.5 Years
Data from TradingView shows that margin longs — positions opened with borrowed funds — on Bitfinex have climbed to 80,636 BTC, up about 1.5% over the past days and now at their highest level since December 2023. Back then, Bitcoin traded near $43,000. Since the start of the year, Bitfinex margin longs have risen roughly 10%, while Bitcoin itself has dropped 13%. The divergence indicates that large traders continue accumulating despite BTC sitting nearly 35% below its October all-time high of $126,000.
Historical Pattern: A Contrarian Signal
Over the past five years, the so-called “Bitfinex whale” has often acted as a contrarian indicator. Large leveraged long positions tend to expand during periods of market weakness and capitulation, while being reduced near local tops and trend reversals. The current spike to 2.5-year highs suggests caution may be warranted.
Key Technical Levels: $78K and 200-Day MA
Bitcoin is now testing a critical zone. The True Market Mean (an onchain metric representing aggregate cost basis) and the short-term holder realized price (average acquisition cost of recent buyers over 155 days) both sit near $78,000, just above spot. Above that, the 200-day moving average at around $81,000 presents another major resistance. If BTC fails to hold $78,000, further downside toward $73,000 could follow.
The divergence between falling price and rising leveraged longs creates a tense setup. Whether this signals a bottom or just a pause before more pain remains to be seen.