
Source: BIT Securities.
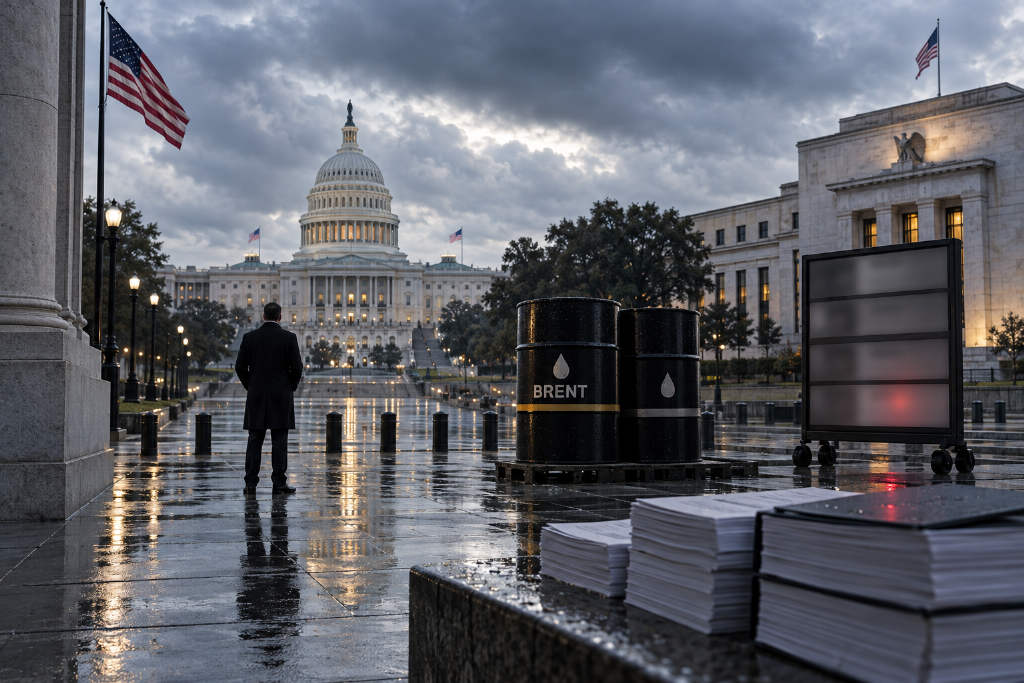
Over the next two days, the U.S. will publish its August Producer Price Index and Consumer Price Index. That lands just as Brent crude briefly pushed above $100 a barrel and WTI neared $95. The report’s argument is simple: oil is still one of the cleanest leading indicators for where PPI may head next. At the same time, weaker card spending and retail numbers hint that inflation pressure may be coming less from overheated demand and more from supply-side shocks.
Oil moves back to the center of the market outlook
CNBC and Rigzone data cited in the piece show Brent crude hit an intraday high of $100.45 a barrel, about 2.9% above Tuesday’s close of $97.92. WTI climbed as well, reaching roughly $95, up about 2.4%.
The article says WTI is breaking out of a symmetrical triangle pattern that has held since the March high. At the same time, the 100-day moving average has crossed above the 200-day moving average. If that breakout holds, the contract could go on to test the $100 psychological mark.
But the piece says this rally is different from the violent March jump tied to a sudden escalation in the Iran-Israel-U.S. conflict, when Brent surged toward $109 in a single day and then lost steam in the months that followed. This time, the move is described as a more measured climb from a July low of $76. Oil spent most of August in the $80s, stayed above $90 from the start of September, and has now broken through $100. In that setup, higher energy costs could start feeding into PPI through transportation, chemical feedstocks, and energy inputs over the next one to two months.
August PPI and CPI will shape expectations for the September Fed meeting
Data from the U.S. Bureau of Labor Statistics showed July PPI rose 4.7% year over year. Core PPI, which excludes food, energy, and trade services, also came in at 4.7%, while the monthly core reading increased 0.4%.
August PPI is scheduled for 20:30 Beijing time on Sept. 10. Because oil tends to pass through with a lag, the report says markets are wary. Institutional previews mentioned in the article suggest core PPI, using an excluding-food-and-energy measure that was 4.2% in July, could rebound to around 4.6%. If that happens, headline PPI could climb back above 5% year over year.
Then comes August CPI at 20:30 Beijing time on Sept. 11. July CPI was 3.4% year over year, and core CPI was 2.5%. Wall Street expectations cited in the piece call for headline CPI to stay at 3.4% in August, while core CPI edges down to 2.4%.
The report says that is not necessarily at odds with the recent oil spike, because core CPI strips out energy and usually picks up oil’s effect later. There is another wrinkle too. The Bureau of Economic Analysis recently said it would change its methodology for investment advisory services, legal services, and software components. Goldman Sachs and JPMorgan estimate that move could mechanically reduce core PCE by 0.1 to 0.2 percentage points. So a softer core inflation reading may reflect methodology in part, not just a real easing in price pressure.
| Indicator | July | August expectation/risk | Release time (Beijing) |
|---|---|---|---|
| PPI YoY | 4.7% | Oil pass-through could push it back above 5% | Sept. 10, 20:30 |
| Core PPI | 4.2% | Institutional previews center near 4.6% | Same |
| CPI YoY | 3.4% | Market expects 3.4% | Sept. 11, 20:30 |
| Core CPI YoY | 2.5% | Expected at 2.4%, partly linked to core PCE methodology changes | Same |
Consumer data show slower momentum
The article uses consumer spending as a reality check. Demand story, or cost story? That is the question.
Bank of America Institute’s latest Consumer Checkpoint report showed total credit and debit card spending growth slowed to 5.0% year over year in July from 6.3% in June. Strip out gas station spending, and the pace fell to 4.3% from 5.6%.
And the report says that cooling was tied more to temporary issues than to a broad demand breakdown. It points to fading World Cup-related spending and timing shifts in online promotions. Even so, July’s 5.0% growth was still one of the top three readings of the past three years and more than four times the 2025 full-year average.
NRF/CNBC retail tracking tells a similar story. July was the 10th straight month of positive retail growth, but the speed dropped hard. Retail sales excluding autos and gas stations rose 5.15% year over year in July, down from 9.41% in June. Core retail sales, which also exclude restaurants, slowed to 4.72% from 10.08%—a fall of more than 5 percentage points.
| Indicator (YoY) | June | July | Change |
|---|---|---|---|
| BofA credit + debit card spending | 6.3% | 5.0% | -1.3 pct |
| Excluding gas stations | 5.6% | 4.3% | -1.3 pct |
| NRF retail sales ex autos/gas | 9.41% | 5.15% | -4.26 pct |
| NRF core retail ex restaurants | 10.08% | 4.72% | -5.36 pct |
Warsh and Waller leave markets split before Sept. 17
The piece says remarks from Kevin Warsh and Christopher Waller have pushed expectations in opposite directions ahead of the Sept. 17 policy meeting.
It says Federal Reserve Chair Kevin Warsh struck a distinctly hawkish tone in remarks at the Jackson Hole global central banking conference on Aug. 28, signaling that sticky inflation could warrant a rate hike. Markets briefly took that as lifting the odds of a September increase.
Then Waller said on Sept. 3 that if the recent disinflation trend continues, he would lean toward backing unchanged rates in September. So investors went into the meeting split.
The article’s larger point is that the policy story has shifted. Not "no more hikes this year" anymore. Now it is "further tightening cannot be ruled out," whether Sept. 17 brings an actual rate increase or a hold with hawkish language attached. In a data-dependent setup, gaps between inflation components and even changes in statistical methodology can move markets on their own.
UBS flips its call and now expects two hikes
The article also says UBS analysts have abandoned their earlier view that the Fed would not raise rates at all in 2026. They now expect 25-basis-point hikes in both September and December, taking the federal funds target range to 4.00%-4.25%.
A key line from the UBS report reads: "Historically, tightening carried out against a backdrop of resilient GDP growth, strong AI capital spending, and a solid labor market has often supported risk assets." UBS contrasts that with a situation where the Fed is forced to hike because growth is weak while inflation stays high. In its view, the current cycle looks closer to "growth-driven" tightening than "inflation-driven" tightening.
The article lists UBS’s asset views as follows:
- Equities: UBS remains constructive on stocks through the hiking cycle and still favors artificial intelligence, power/resources, and longevity themes, viewing short-term volatility as a buying opportunity.
- Bonds: UBS lifted its U.S. Treasury yield forecasts, raising its 2-year target to 4.25% for June 2027 and its 10-year target to 4.5%. It says short-duration bonds look less appealing on a relative basis, while medium- and long-duration high-quality bonds still offer portfolio value through carry and downside protection if growth slows.
- U.S. dollar: Expectations for tighter policy support the dollar in the near term, though UBS says that support may weaken if later hikes are confirmed to be inflation-driven rather than growth-driven.