Bitcoin 5-Wave Correction Nears Completion – $58,110 is Key
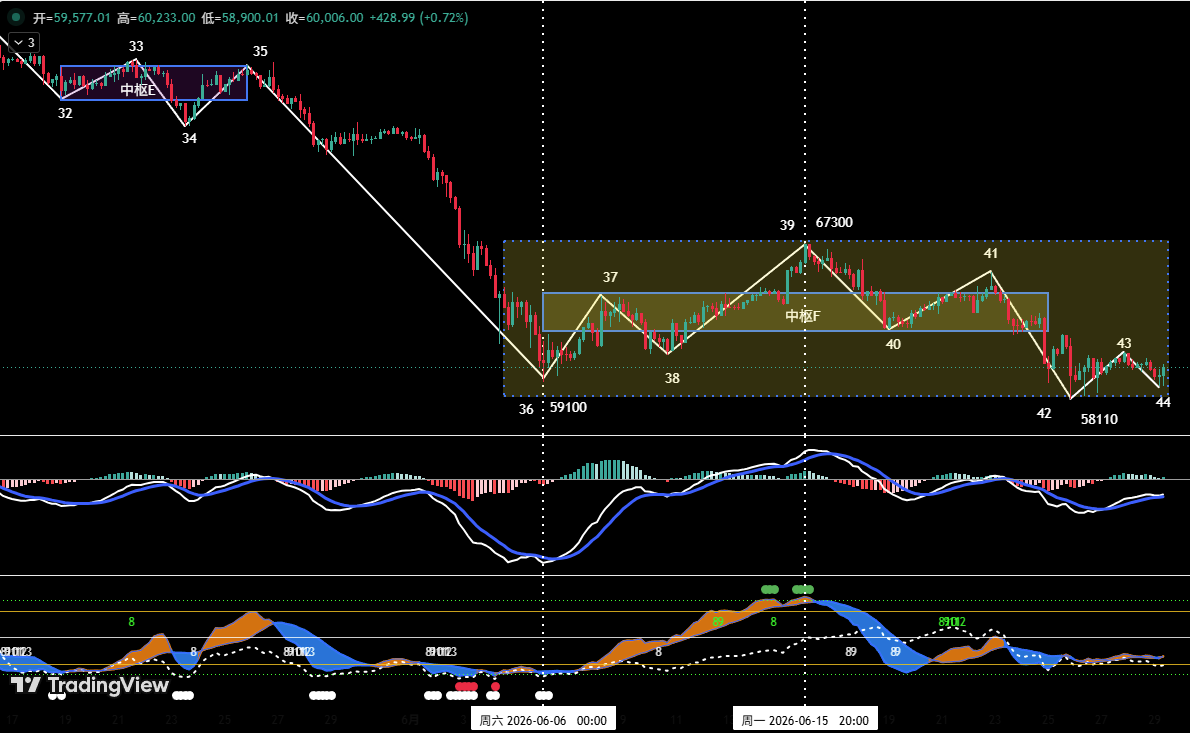
Bitcoin is currently in the final leg of a 5-wave corrective structure (endpoint 39 to endpoint 44) on the 4-hour chart. The rebound from the June 6 low of $59,100 ended at endpoint 39 ($67,300), after which the market entered a clear 5-wave decline. The final position of endpoint 44 will determine short-term direction:
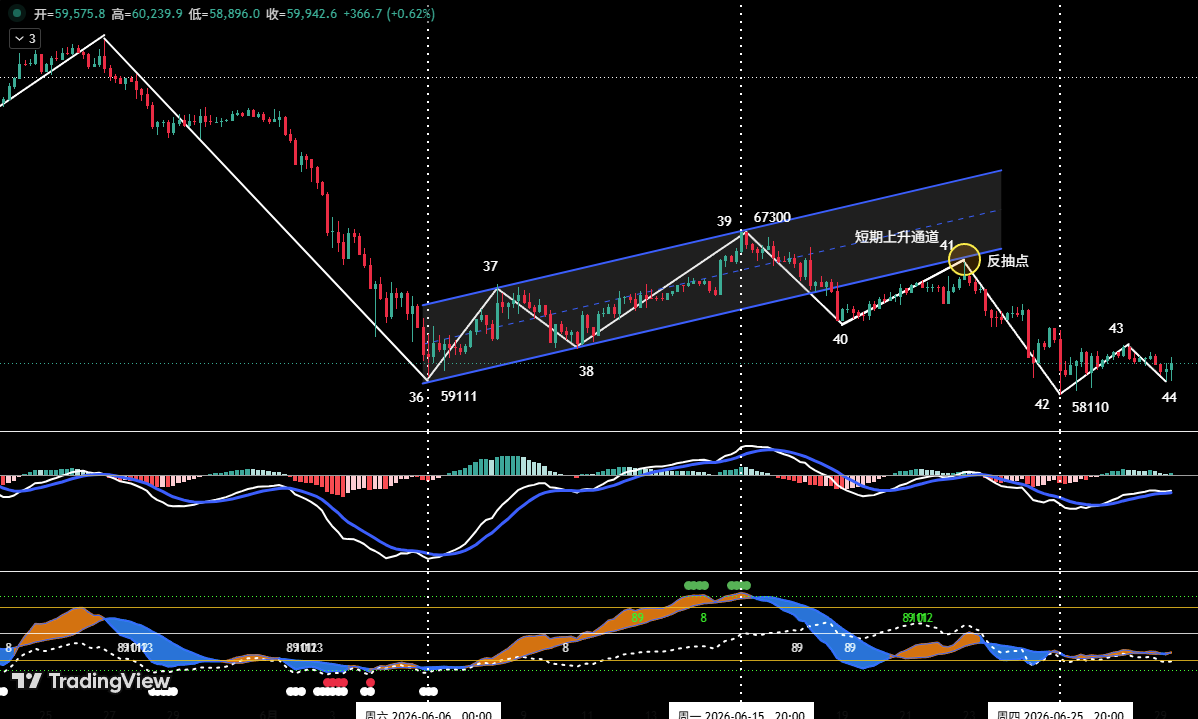
- If endpoint 44 closes above $58,110: a significant technical bounce is likely, followed by a wide-range consolidation.
- If endpoint 44 closes below $58,110 but with bullish divergence in momentum: a bounce is still possible but its strength needs confirmation.
- If endpoint 44 closes below $58,110 without bearish divergence: continued breakdown is more probable.
Based on proprietary quantitative models, the first two scenarios have higher probability. Key resistance zones: first at $60,900–62,300, second near $65,500, third at $67,300–69,500. Key supports are the prior lows of $59,100 and $58,110.
Trading Plan for BTC: 20% Mid-Term Short, 30% for Short-Term Scalping, and Three Contingency Plans
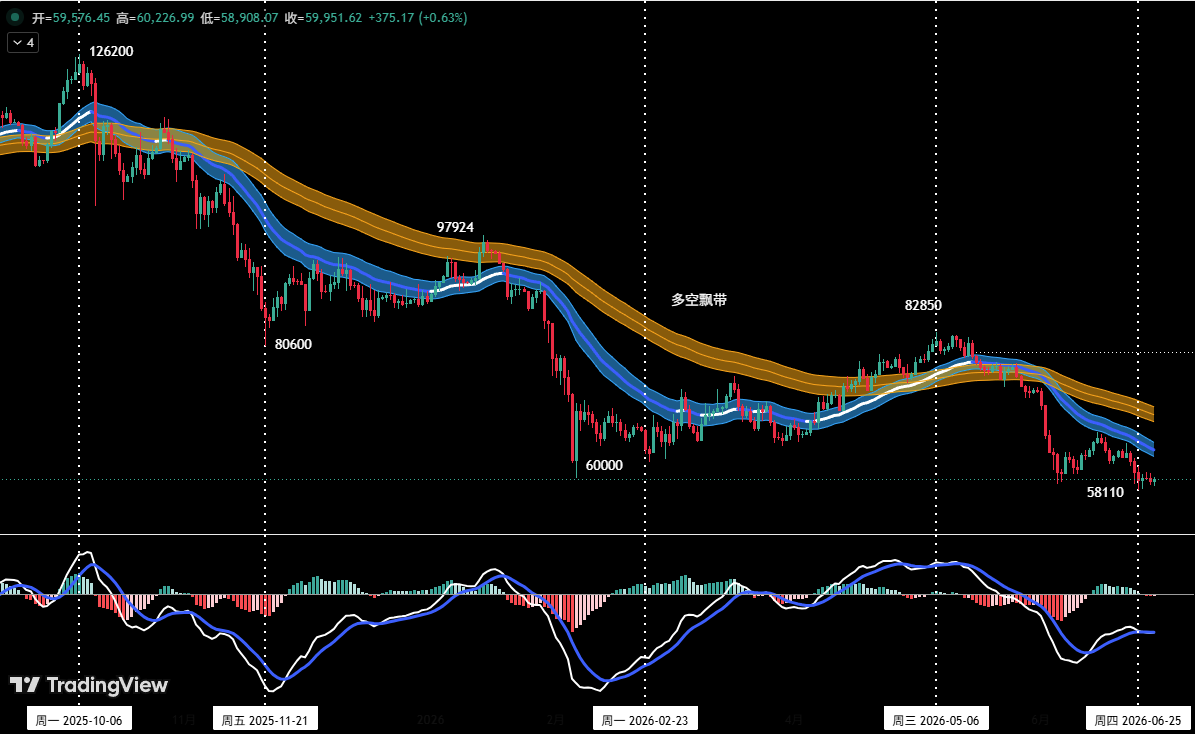
The price has effectively broken below the long-short channel, confirming a bearish market structure. The mid-term strategy maintains a 20% short position. Short-term strategy uses 30% of capital with strict stop-losses, targeting scalping opportunities on the 30-min/60-min timeframe between support and resistance. Three pre-set contingency plans (A/B/C) are ready to adapt to various market evolutions.
HYPE Correction Structure: Wave 55-56 in Progress – Long Entries on Support
HYPE began its correction from a high of $76.94 (endpoint 51) on June 16. On the 4-hour chart, the move can be subdivided into a 5-wave structure (51-56), with price currently in wave 55-56. The position of endpoint 56 is critical: if it forms a higher low (double-bottom), the probability of a bounce increases sharply. Quantitative models indicate this scenario is more likely.
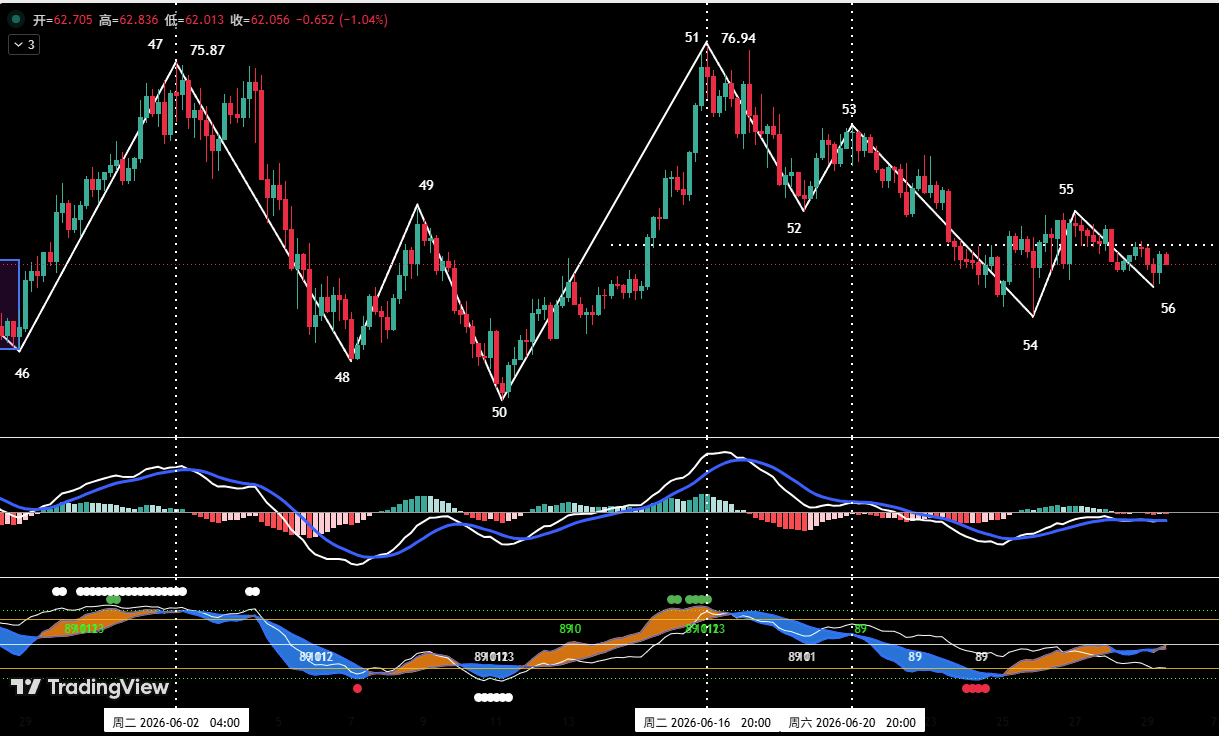
Key resistance: first near $65.5, second near $71.5. Key support: above $58.8, with a deeper zone at $52–54. The short-term strategy follows a “buy on support, avoid chasing” approach. When price stabilizes in the support zone and both the price difference model and momentum model trigger bottom signals, light long entries are allowed, with position size strictly capped at 30% and tight stop-losses.
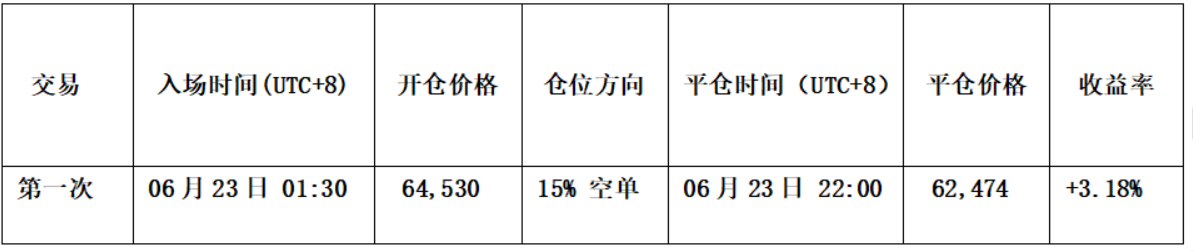
Last Week’s Trade Verification: Two Short Trades Delivered 6.21% Profit
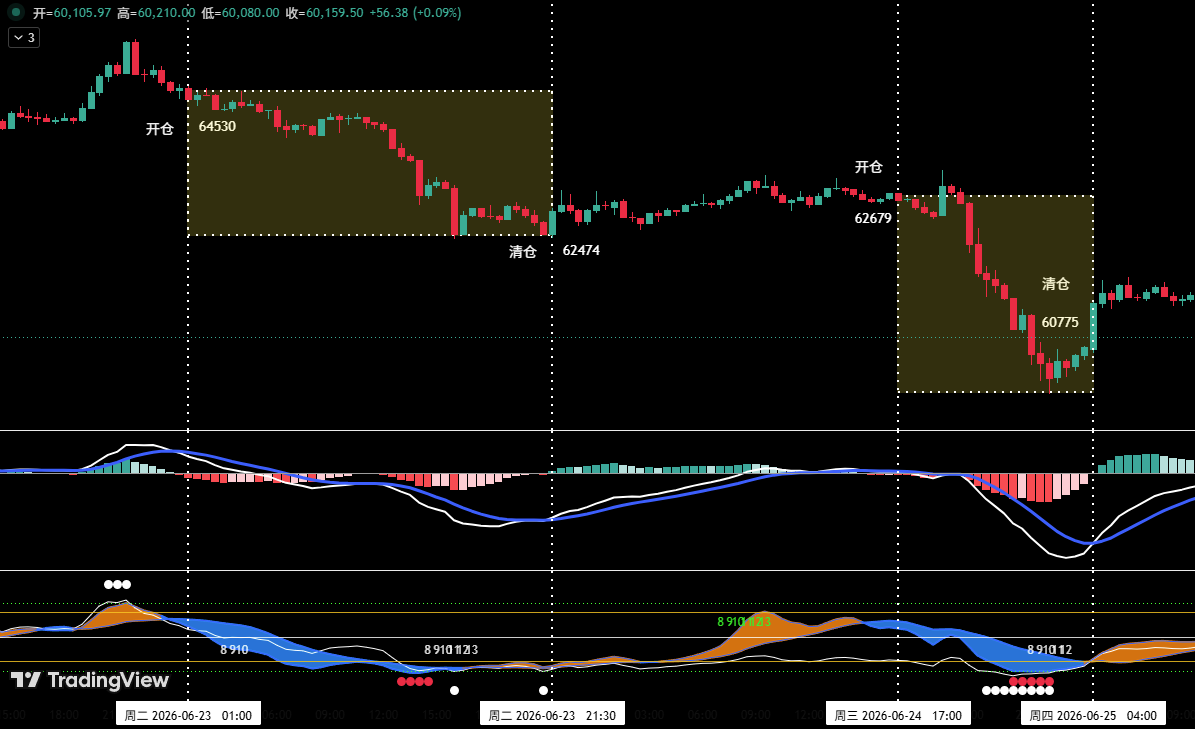
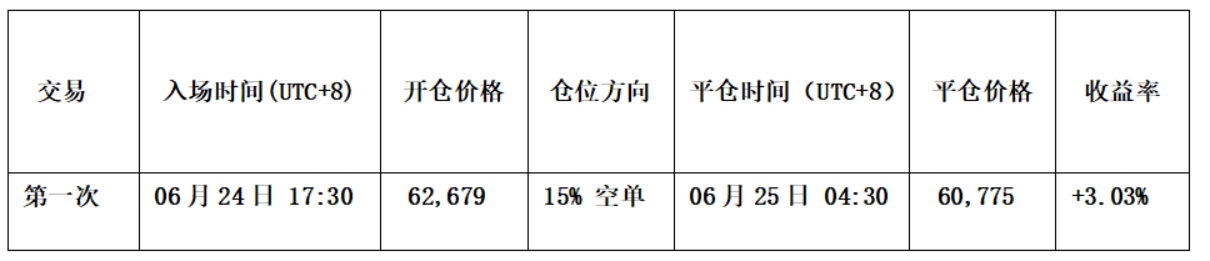
Using signals from the price-difference model and momentum model, two short-term short trades were executed last week (both with 1x leverage): first entry at $64,530 with 15% position, closed at $62,474 for a profit of 3.18%; second entry at $62,679 with 15% position, closed at $60,775 for a profit of 3.03%. Total profit from these two trades amounted to approximately 6.21%.
Risk disclaimer: All analysis and trading strategies are for personal journal purposes only and do not constitute investment advice. Financial markets are highly volatile and require dynamic adjustment.