This week, both Bitcoin and HYPE are at crucial technical junctures within their respective corrective structures. BTC is concluding a five-wave decline from the June 6 high, while HYPE is undergoing a similar pattern. This analysis covers structural details, key support/resistance levels, actionable trading plans, and a recap of last week's trades.
Bitcoin’s Five-Wave Correction Enters Final Phase
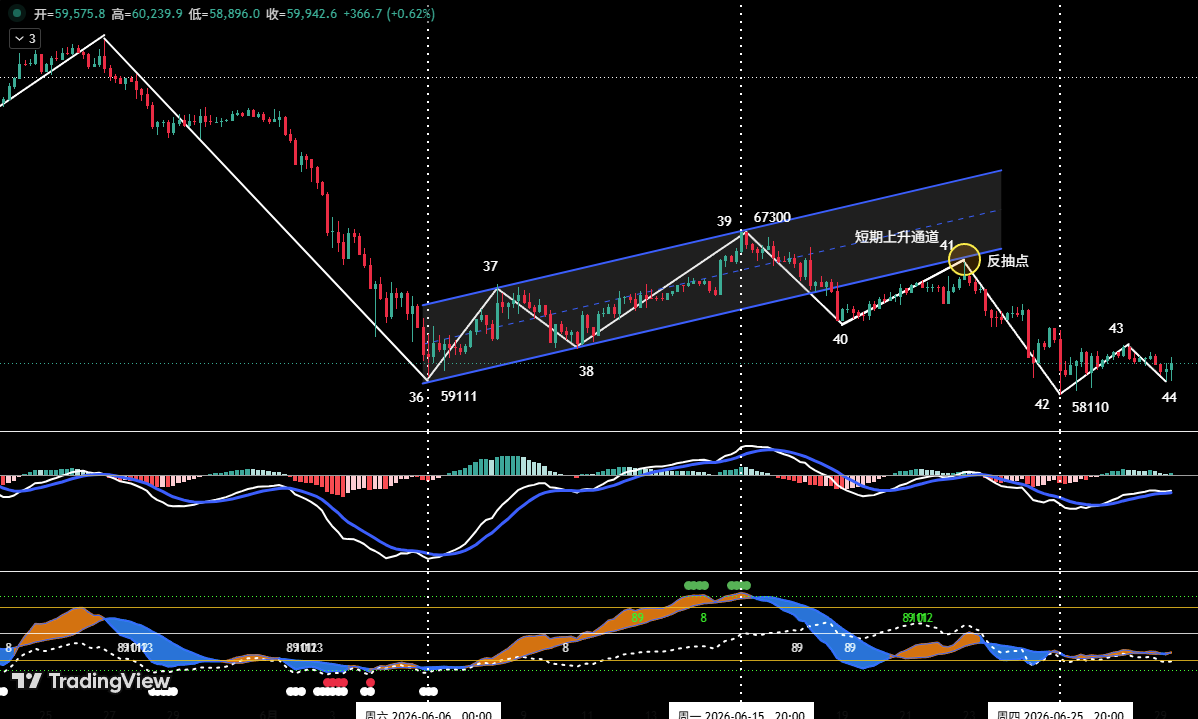
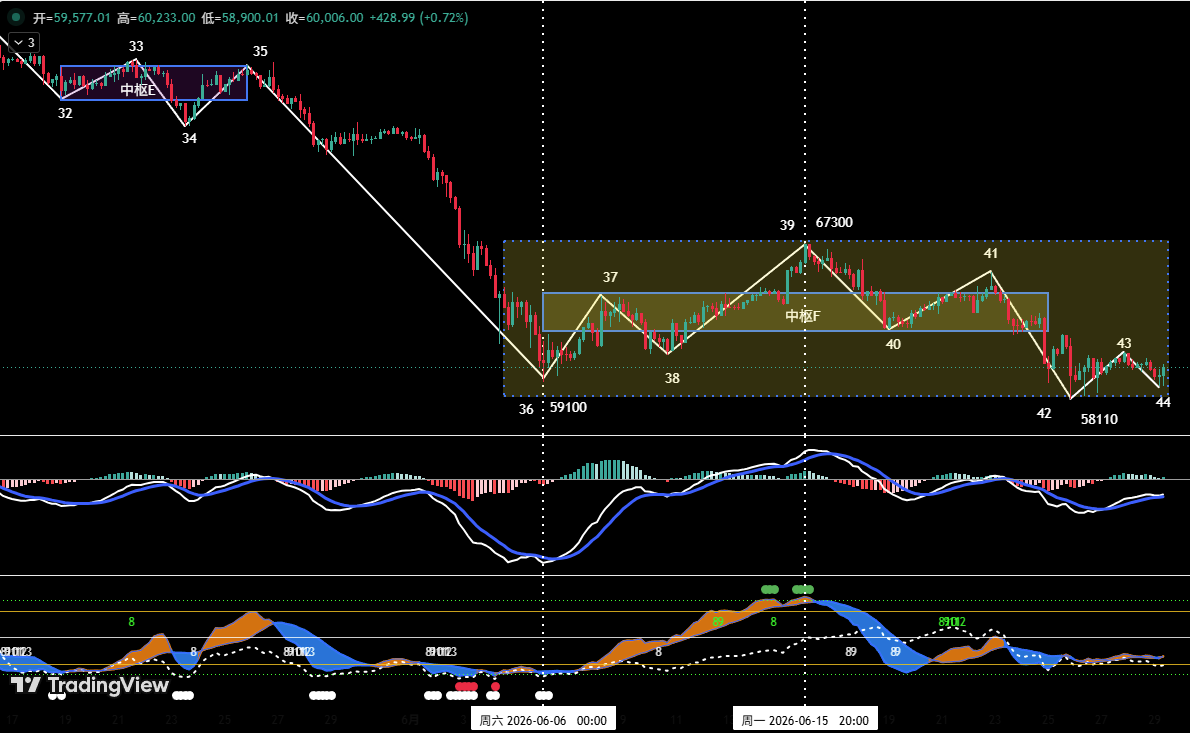
On the 4-hour timeframe, the rebound from the June 6 low of $59,100 ended at "Point 39" ($67,300). The market then entered a clear five-wave correction (Points 39 to 44), with the current (43-44) leg being the final wave. The exact position of "Point 44" will dictate the near-term outlook: if it closes above $58,110, a technical bounce is likely, followed by a wide consolidation range; if it closes below $58,110 but with bullish divergence in momentum, a bounce is still possible but with weaker follow-through; if it closes below $58,110 without divergence, the market risks further breakdown. According to our proprietary quantitative model, the first two scenarios have a higher probability.
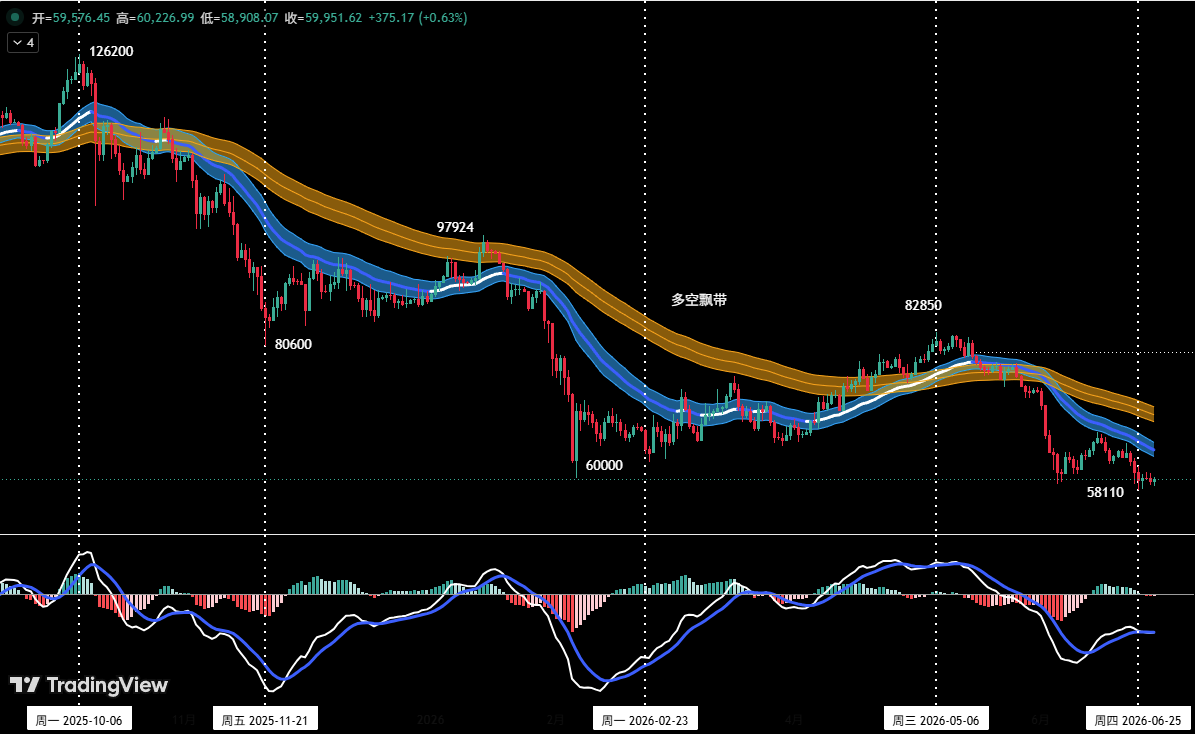
Key resistance levels are as follows: first resistance zone $60,900–$62,300 (previous high/low pivot area), second resistance near $65,500, and third resistance $67,300–$69,500. The critical support remains $58,110 (the prior low).
Bitcoin Trading Strategy for the Week
For medium-term positioning, since the price has effectively broken below the "bull-bear channel," the market structure has confirmed a bearish dominance. Therefore, we maintain a 20% short position. For short-term trading, we allocate 30% of capital to scalp around support/resistance levels using 30- or 60-minute charts. To adapt to evolving conditions, three pre-set plans (A/B/C) are prepared: Scenario A (Point 44 above $58,110) – focus on buying dips; Scenario B (Point 44 below $58,110 but with divergence) – wait for confirmation then light long; Scenario C (Point 44 below without divergence) – hold shorts and consider adding. Actual entries will rely on quantitative model signals.
HYPE Five-Wave Structure and Trading Opportunities
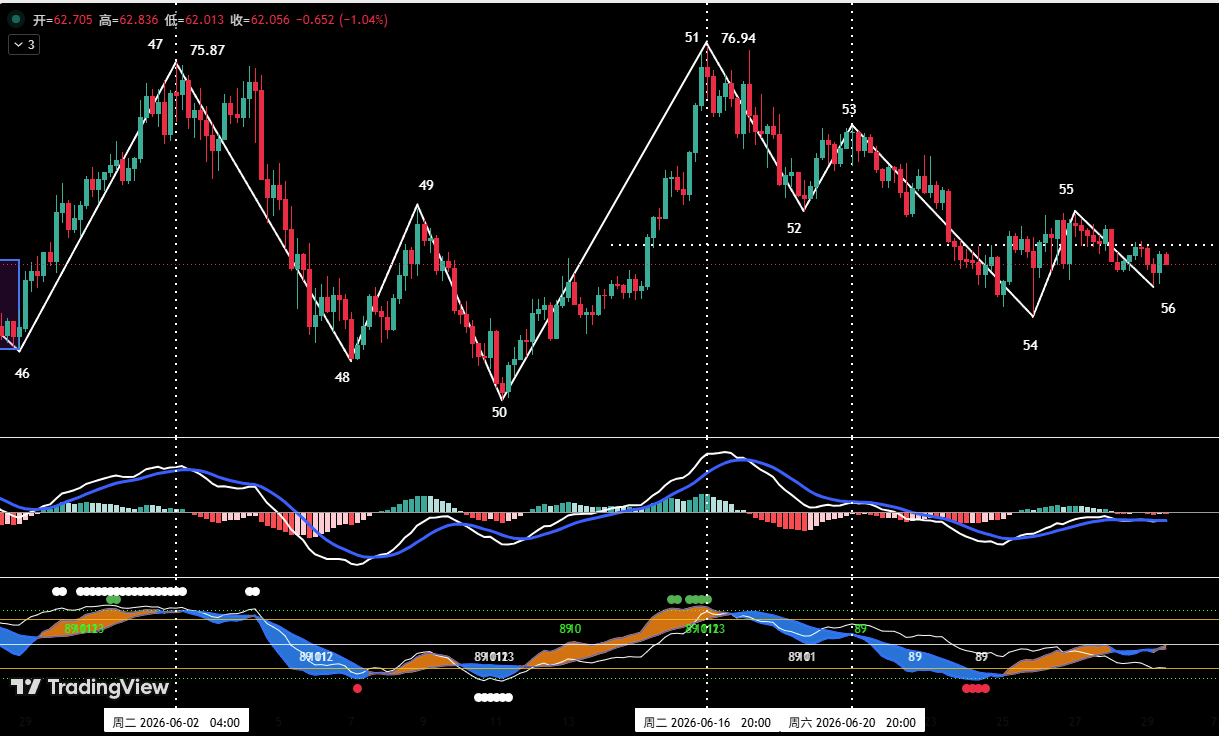
HYPE started its decline from the June 16 high of $76.94 (Point 51) and has been unfolding in a five-wave pattern on the 4-hour chart: waves 51-52, 52-53, 53-54, 54-55, and the ongoing 55-56. The position of "Point 56" is the key. If it forms a double bottom above $58.8, a significant bounce is likely. Key resistance levels: first near $65.5, second near $71.5. Support zones to watch are above $58.8 and deeper at $52–$54. The recommended strategy is "accumulate on dips, avoid chasing." When the price stabilizes near support and quantitative models flash bottom signals, consider opening a small long position with position size strictly below 30% and a tight stop loss.
Last Week’s Trade Review and Risk Disclaimer
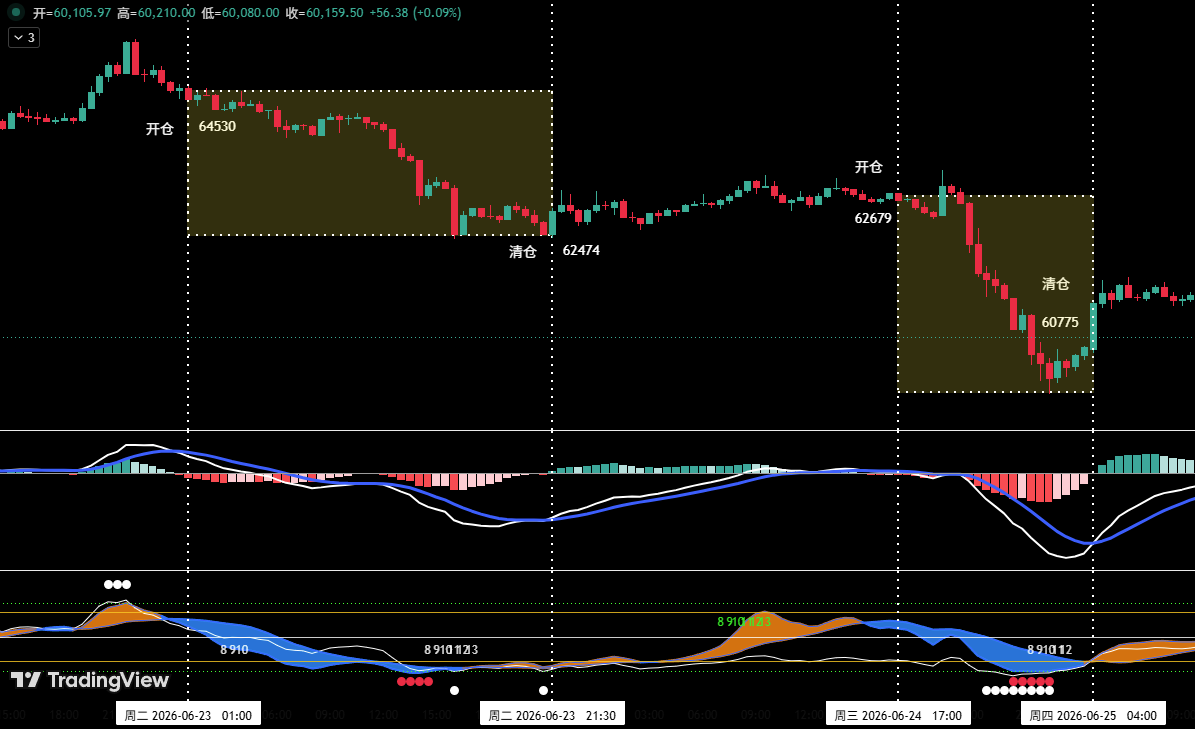
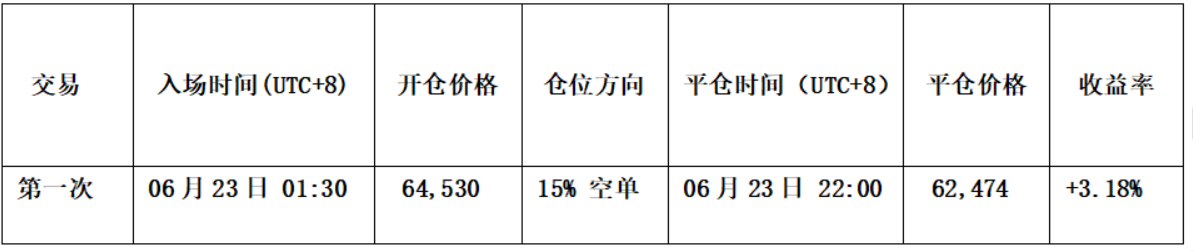
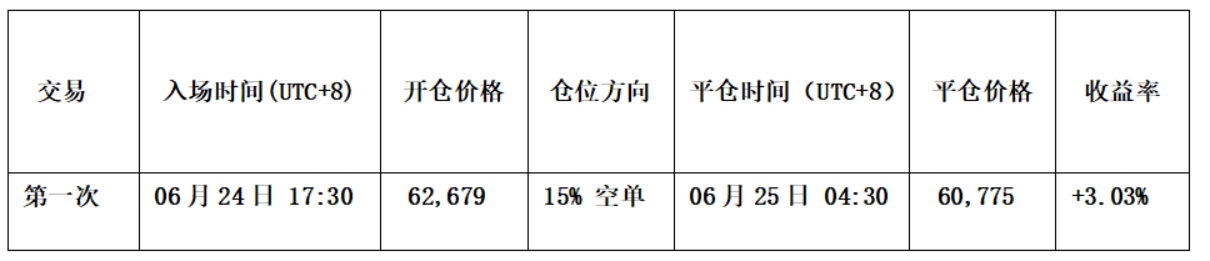
Last week, following the trading plan, we executed two short trades based on our "Spread Trading Model" and "Momentum Quantitative Model." The first short was opened at $64,530 (15% position) and closed at $62,474, netting a profit of approximately 3.18%. The second short was opened at $62,679 (15% position) and closed at $60,775, netting approximately 3.03%. Total profit from the two trades was about 6.21%. It is important to emphasize that financial markets are highly dynamic, and all analysis and strategies must be adjusted in real time. This article is solely a record of personal technical analysis and trading logs. It does not constitute any investment advice or recommendation. Market risks are significant; please trade with caution.