

Odaily said in a guest market analysis that Bitcoin traded between $74,950 and $81,950 last week after the Federal Reserve rate decision, completing what the article described as a "build-up first, breakout later" move. The piece said that path closely matched its previously outlined "Scenario 2." Based on that plan, the author said a long position was opened after the decision at a multi-factor confirmation point and later closed near the $82,850 resistance zone after price stalled and top confluence signals appeared, resulting in a reported gain of about 4.76%.
The article also said HYPE rebounded sharply after touching a low near $75 and set a new all-time high of $94.52 on Sept. 19. According to the analysis, its earlier call that the prior daily upswing had ended and would be followed by a correction was validated during the pullback.
For this week, the article placed both assets at critical levels. BTC is approaching the upper boundary of its range at $82,850, while HYPE is near its record high and in what the piece called a deeply overbought area. The author said a proprietary spread-trading model had already flashed top warnings in both names, while a momentum quant model showed top-side dulling at the same time. The article’s message was clear: the closer price gets to the highs, the more restraint traders should keep, and chasing strength should be avoided.
The piece said it would introduce Chan theory analysis for the first time this week to break down the daily structures of BTC and HYPE in a more systematic way. The focus is on the possible end points of BTC’s (6-7) upswing and HYPE’s (16-17) upswing, together with support and resistance levels for medium- and short-term plans.
Weekly focus and last week’s trade review
The article listed four core topics for the week:
- Daily structure analysis for BTC.
- BTC market outlook and medium- and short-term trading plans.
- Daily structure analysis for HYPE.
- HYPE market outlook and short-term trading plans.
It also said last week’s strategy produced one short-term BTC long trade using 1x leverage, with a gain of about 4.76%.
BTC daily structure: attention on a second potential upward center
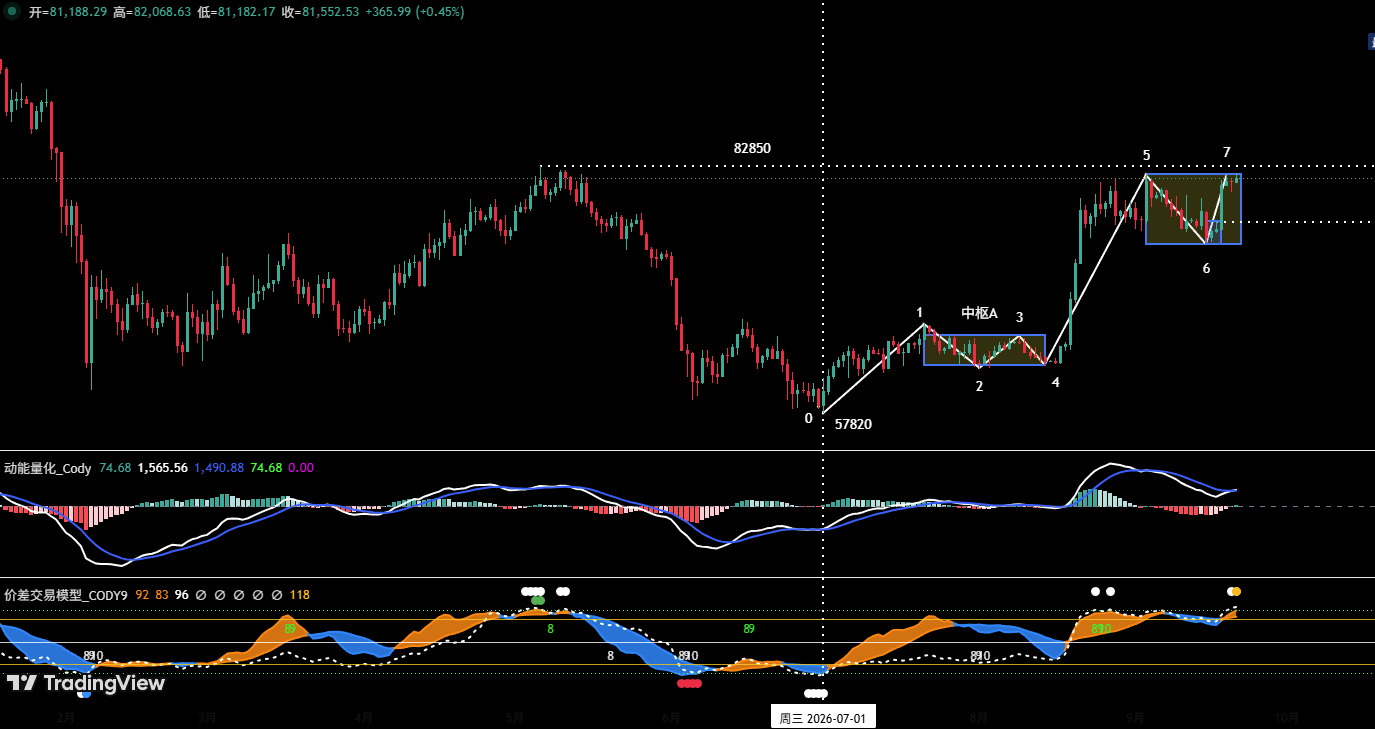
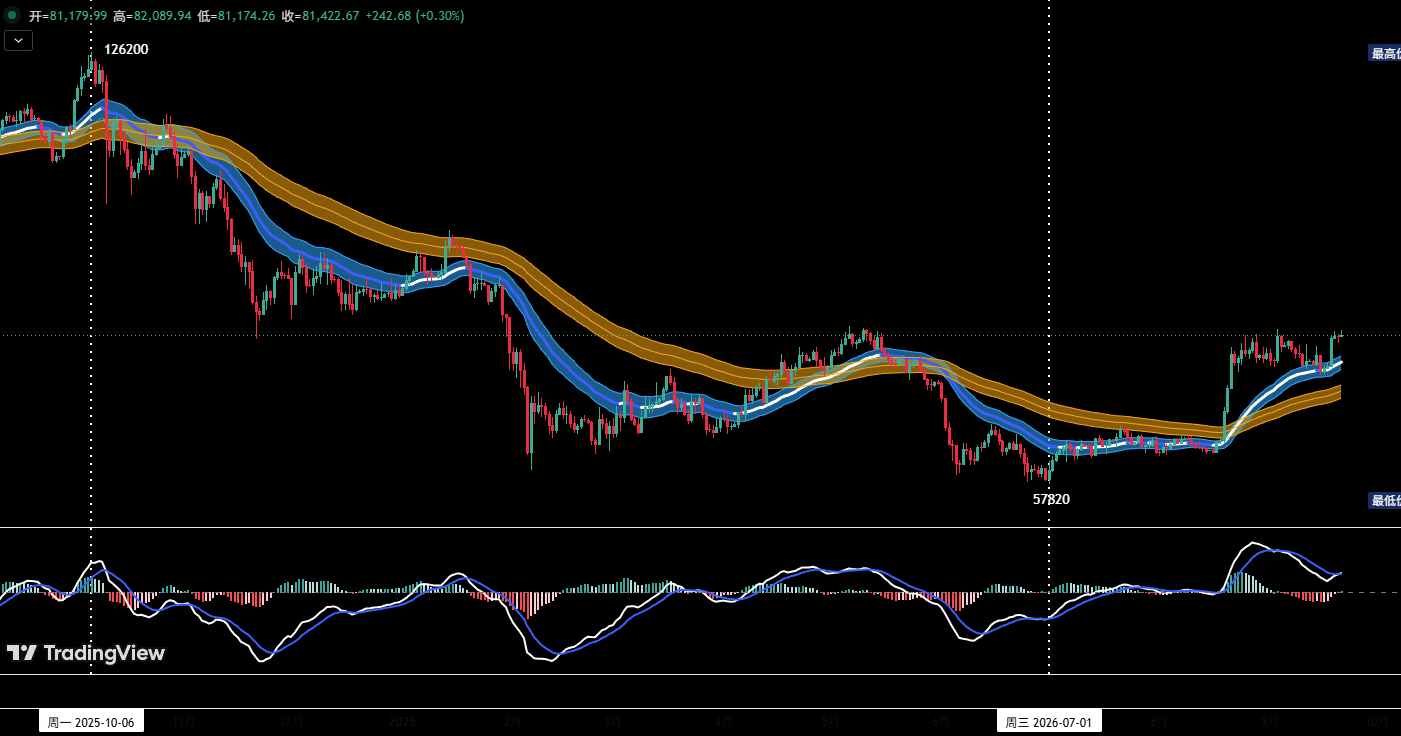
The article said its previous weekly review, built on a moving-average framework, had defined BTC’s structure after the current rebound reached $82,300 on Sept. 3. That rebound began on July 1. In the author’s reading, BTC has been holding a high-level range, with the upper boundary near $82,850 and the lower boundary around $75,500, while forming a second daily-level upward center during the same period.
Using the Sept. 17 Federal Reserve rate decision in Beijing time as a key timing window, the earlier review mapped out two possible paths for last week and prepared short-term trading plans around them. The article said the actual move, with a low near $74,950 and a high near $81,950, closely matched "Scenario 2."
Under the Chan theory framework, the article said BTC has traced a seven-leg advance from (0-1) through (6-7) since rebounding from its July 1 low, and is now in the process of building the (6-7) leg.
It added that the overlap among moves (1-2), (2-3) and (3-4) completed the first daily-level upward center, labeled Center A. In that structure, (0-1) was the entry leg into the center and (4-5) was the exit leg. The article argued that the exit leg was clearly stronger than the entry leg, which in its view raised the probability that a second upward center would be built from "Point 5" after the exit leg ended.
Since "Point 5," the piece said BTC has already completed the (5-6) downswing and is now building the (6-7) upswing. At the time of writing, that leg had approached the upper boundary of the range near $82,850. After a short run of consecutive gains, multiple technical indicators were in overbought territory, the article said. Its proprietary spread-trading model had triggered top warnings, marked by yellow and white dots, while the momentum quant model was in a top dulling state, which the author described as a precondition for a momentum bearish divergence. On that basis, the article said this was not a level to chase and that traders should watch for short-term pullback risk and a possible new downswing.
BTC outlook and trading plans for the week
The article’s central BTC view for the week was to watch the end point of the (6-7) upswing and track the possible construction of the next downswing.
Key resistance levels
- First resistance: around $82,850.
- Second resistance: $84,500 to $86,500.
- Third resistance: around $90,000.
Key support levels
- First support: $79,500 to $80,500.
- Second support: $73,500 to $75,000.
- Third support: $67,300 to $69,100.
For medium-term positioning, the article said a position-monitoring model showed that price had broken through the "bull-bear channel" but had not yet completed a retest confirmation. Because of that, the preferred medium-term stance was to stay in cash and wait.

For short-term trading, the article suggested using 30% of capital, setting stop-loss levels, and looking for spread-trading opportunities around support and resistance, using 30-minute or 60-minute time frames.
It then laid out two plans:
- Plan A: try a light short in a strong resistance zone. If BTC rises into the $82,850 to $84,500 area, shows a clear rejection pattern, and the quant model also gives a top signal, the article said a short position of about 30% could be opened. An initial stop-loss should be set. If price later falls toward a key support area and model signals align, profits can be taken gradually.
- Plan B: try a light long in a strong support zone. If BTC pulls back to one of the key support areas, shows a clear stabilization pattern, and the quant model gives a bottom signal, the article said a long position of about 30% could be opened. An initial stop-loss should be set. If price rebounds toward a key resistance area and model signals align, the position can be closed gradually for profit.
HYPE daily structure: trend still up, but overbought after a new high
The article said its previous weekly review had already applied a Chan theory framework to HYPE on the 4-hour chart to break down the daily (14-15) upswing. In that reading, the daily rally that started from "Point 14," the Aug. 2 low of $51.11, ended at "Point 15," the Sept. 6 high of $89.76, and a correction was expected after that.
Last week’s actual move, the article said, showed a daily (15-16) downswing in which price fell from the $89.76 high to a low of $75.10, for a maximum drawdown of 16.33% across the range. The author said that move fully validated the earlier view.
In this week’s daily analysis, the article said HYPE stabilized near "Low 16," the Sept. 15 low of $75.18, and then started the daily (16-17) upswing. That leg set a new all-time high of $94.52 on Sept. 19 and had not yet been confirmed as complete. With the new high in place, the article said the broader uptrend that began from the Jan. 21 low of 20.46 was still intact.
At the same time, the piece said its spread-trading model had repeatedly flashed top warnings near $94.52, marked by yellow and white dots plus green dots, while the momentum quant model entered a top dulling state. The article said that combination put HYPE in a deeply overbought zone, leaving limited room on the upside at current levels. Its trading conclusion was that chasing the move should be avoided and that traders should stay alert to the risk of a high-level pullback.
As for what comes next, the article said that once the (16-17) upswing is confirmed as complete, the market may shift into a high-level consolidation pattern. If price breaks effectively below the key support near $90 during a decline, the next supports to watch would be around $85 and then around $77.
HYPE outlook and short-term plan for the week
The article listed the following key levels for HYPE:
- Core resistance: around $100.
- First support: around $90.
- Second support: $84 to $85.
- Third support: $76 to $77.
Its main focus for the week was the end point of the (16-17) rebound leg and the strength of any correction that may follow.
For short-term trading, the article suggested trying light longs only after price shows signs of stabilizing at key support. If HYPE meets resistance and starts to pull back, and then shows a clear base-building signal at one of the support areas while the quant model also gives a bottom buy signal, the piece said a light long could be considered.
Review of the BTC short-term trade
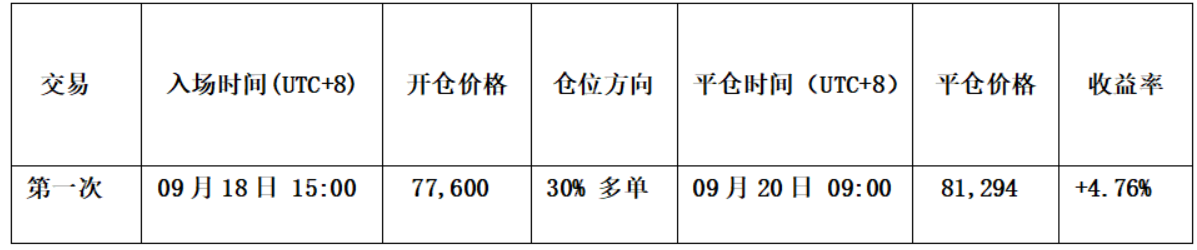
The article said it followed its trading plan closely and completed one short-term BTC long last week based on signals from its spread-trading model and momentum quant model, with a total profit of about 4.76%.
In the trade record section, it said the position used 1x leverage, with details shown in Table 1.
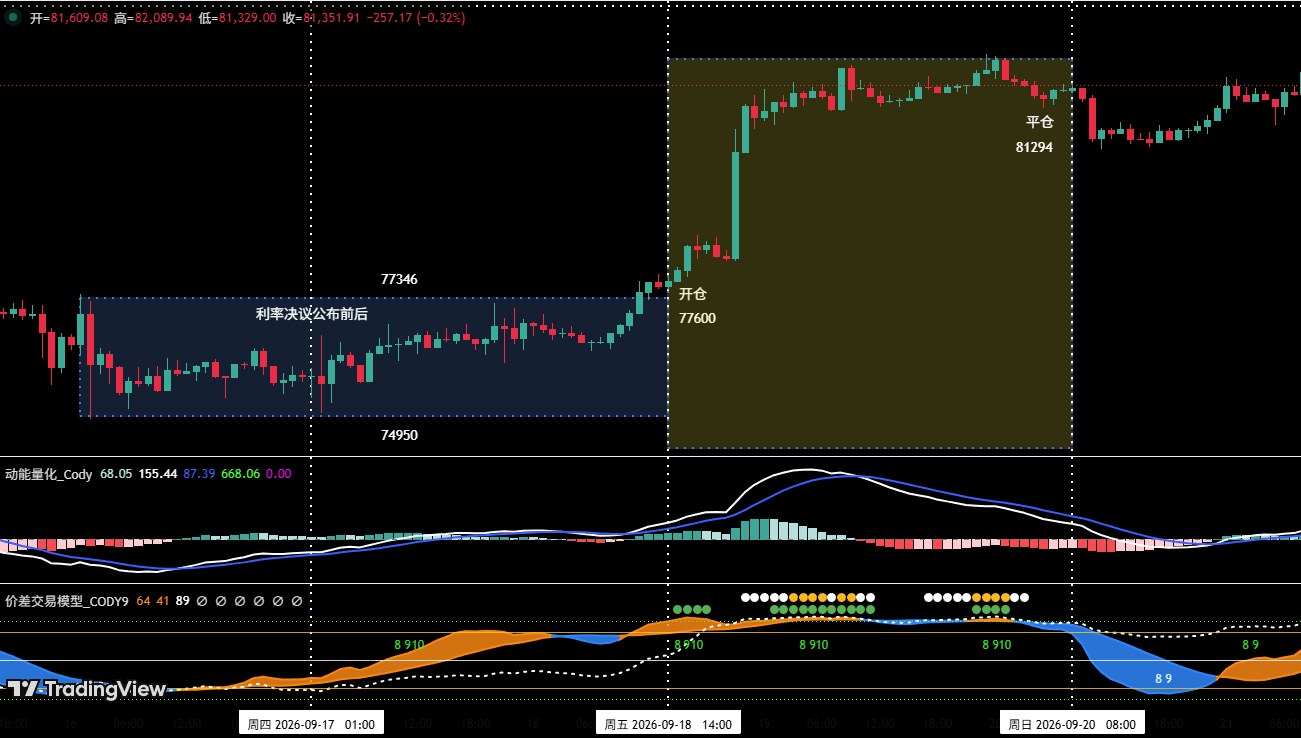
For the entry, the article said BTC traded in a $74,950 to $77,346 range around the Federal Reserve decision. After the announcement, the market digested the news briefly, then price broke above the upper edge of the range and continued higher. At the same time, the momentum quant model formed a golden cross in bullish territory and the spread-trading model also flashed a bullish signal. Based on that multi-factor alignment, the article said a 30% long position was opened at $77,600.
For the exit, the article said BTC stalled near $82,850 and formed a top fractal on the candlestick chart. The spread-trading model then released repeated top warnings, after which the signal band crossed below the skyline and aligned with the momentum quant model in a top confluence. Based on those signals, the article said the full position was closed at $81,294.
The article’s summary of the trade was simple: the position returned about 4.76%.
It also included a BTC 60-minute chart as a visual illustration of the short-term trade under the momentum quant model and spread-trading model.
Risk-control notes listed in the article
- Set an initial stop-loss immediately after opening a position.
- When profit reaches 1%, move the stop-loss to the entry cost to protect principal.
- When profit reaches 2%, move the stop-loss to lock in 1% profit.
- After that, for every additional 1% gain in price, move the stop-loss up by 1% as well to protect and lock in gains dynamically.
The article ended with a disclaimer that financial markets change quickly and all market analysis and trading strategies need to be adjusted dynamically. It said all views, analytical models and trading plans in the piece came from personal technical analysis and were intended only as a personal trading log, not as investment advice or a basis for trading decisions.