

This week's core focus: Bitcoin's daily structure has weakened—can the short-term rebound effectively break through the upper boundary of the descending channel? Has HYPE's seven-wave rally reached its end? The following systematically reviews current market formations from a multi-timeframe perspective and formulates intermediate and short-term trading strategies for the week ahead.
BTC Multi-Timeframe Structure Analysis
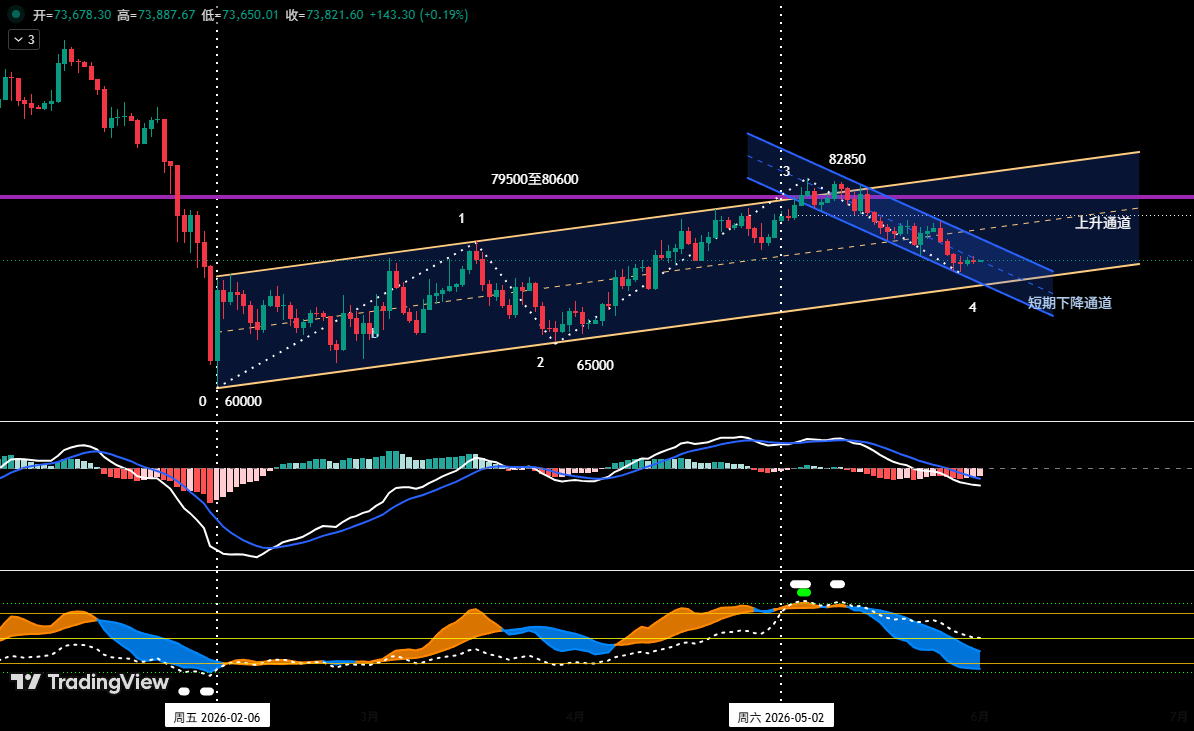
As shown in Figure 1, since the low of February 6, 2026, Bitcoin has oscillated upward within an ascending channel (yellow), with the lower boundary connecting the February 6 and March 29 lows and the upper parallel drawn through the March 17 high. Currently, price has lost the channel's midline and is seeking stronger support at the lower boundary. Concurrently, after peaking at $82,850 on May 6, Bitcoin entered a short-term descending channel (blue), defined by the upper boundary connecting the May 14 and May 26 bounce highs and the lower boundary joining the May 7 and May 23 correction lows. Having briefly held support at the channel's bottom near $72,500, the price is now in a weak rebound phase aimed at the upper blue boundary. Overall assessment: This rebound primarily repairs from oversold conditions and targets the short-term descending channel's upper rail; however, with the break below the ascending channel's midline, the broader structure has weakened, and after the bounce concludes, the price is likely to resume its prior downtrend to test the ascending channel's lower support.
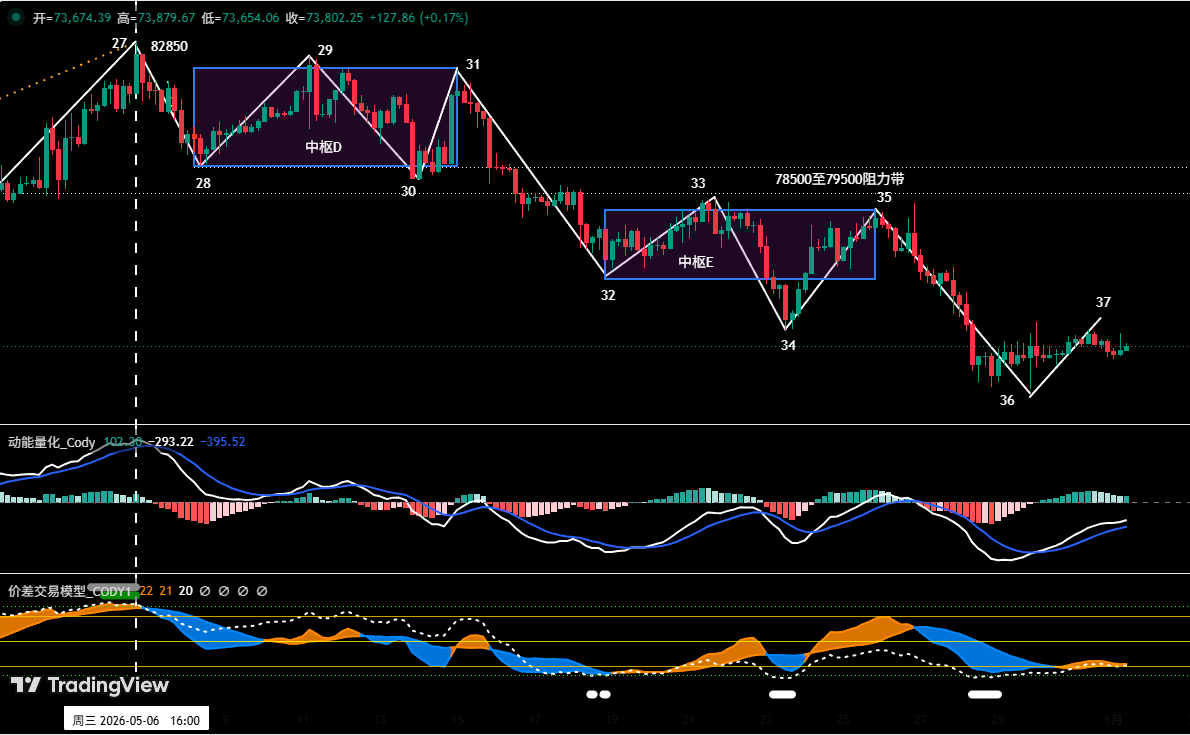
On the 4-hour timeframe (Figure 2), the correction from $82,850 can be subdivided into a ten-segment structure (segments 27-28 through 36-37), featuring two descending pivots: Pivot D formed by the overlap of segments 28-29, 29-30, and 30-31, and Pivot E formed by 32-33, 33-34, and 34-35. The ongoing segment 36-37 rebound faces resistance in the $75,000–$76,000 zone; failure to break above this area will likely extend the consolidative downtrend, targeting the $69,500–$70,500 support.
BTC This Week's Strategy and Contingency Plans
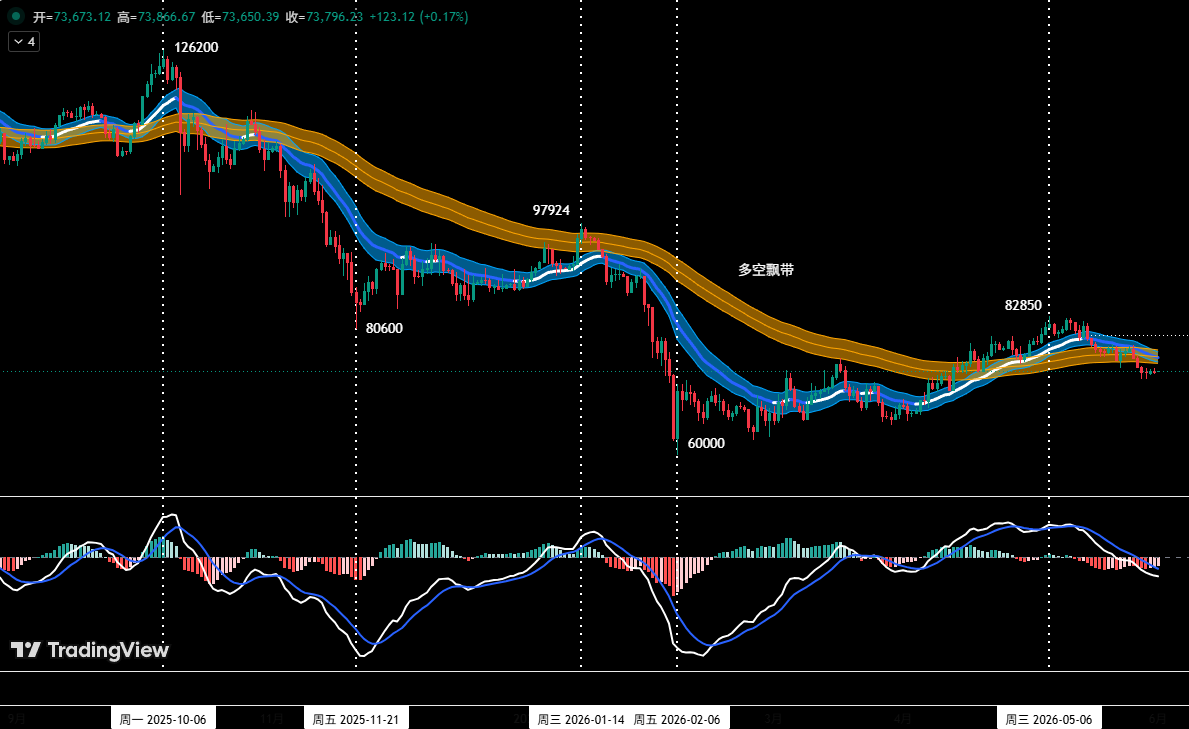
Key resistance levels: first resistance zone at $75,000–$76,000 (near the lower boundary of Pivot E), second resistance zone at $78,500–$79,500 (around the upper and lower edges of both pivots). Key supports: first support at $69,500–$70,500 (prior significant level), second support near $65,000. The short-term plan utilizes 30% of position size to exploit price swings between these levels, with two predetermined playbooks:
Plan A: If the price encounters resistance in the $75,000–$76,000 area and the quantitative model confirms a top signal, a short position of up to 30% can be initiated, with an initial stop-loss set above $77,000 and gradual profit-taking near key support levels.
Plan B: Should the price decisively break below the $69,500–$70,500 support zone accompanied by a model top signal, a short position of up to 30% may be established, with a stop placed above $72,000 and phased exit at subsequent support levels.
HYPE Technical Structure Analysis
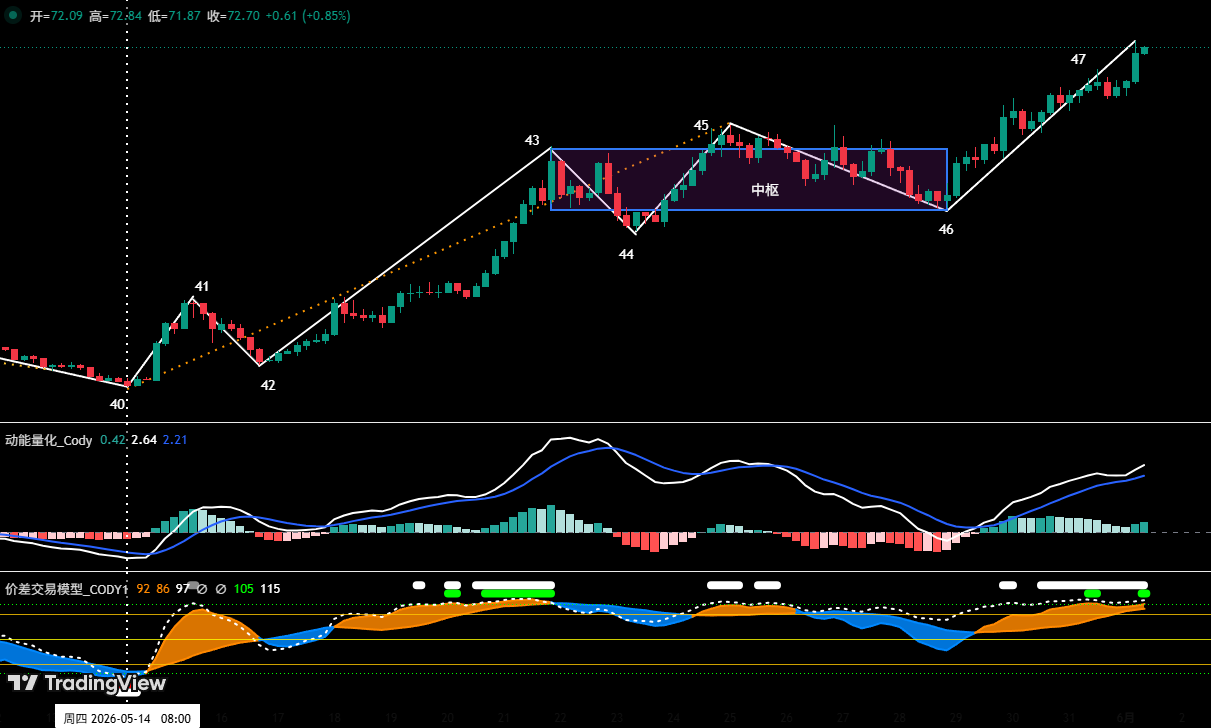
As illustrated in Figure 4, since its May 14 low of $38.14, HYPE has constructed a seven-wave structure (40-41 through 46-47) on the 4-hour chart that includes one ascending pivot, where segments 43-44, 44-45, and 45-46 overlap to form that pivot. Previously, "Endpoint 45" exhibited momentum divergence (bearish divergence) alongside a top warning from the spread trading model, triggering a decline from $64.75 to $56.30—a maximum drawdown of 13.05%. Currently, the pivot exit segment 46-47 shows dwindling momentum compared to the entry segment 42-43, signaling a potential momentum exhaustion. The proprietary spread trading model has issued a strong top alert at "Endpoint 47" (red dot + white dot). This week's critical observation: If Endpoint 47 confirms a clear peak and momentum exhaustion is validated, a subsequent decisive breakdown below the $62.5–$64.57 support region would mark the endpoint of the entire rally that began on May 14.
HYPE Short-Term Strategy
The approach is to "buy on dips and avoid chasing rallies." Monitor the pullback's test of the $62.5–$64.75 zone: if the price stabilizes and both models generate bottom signals in resonance, a light long position (≤30% of capital) can be attempted with strict stop-loss discipline. If the price breaks below this zone effectively, the correction will escalate to a larger degree (e.g., daily timeframe), with the next downside targets projected at the $54–$56.3 area.
Last Week's BTC Short Trade Review
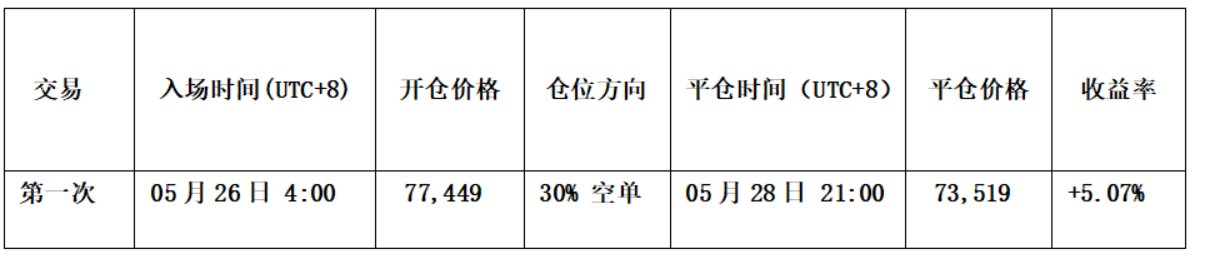
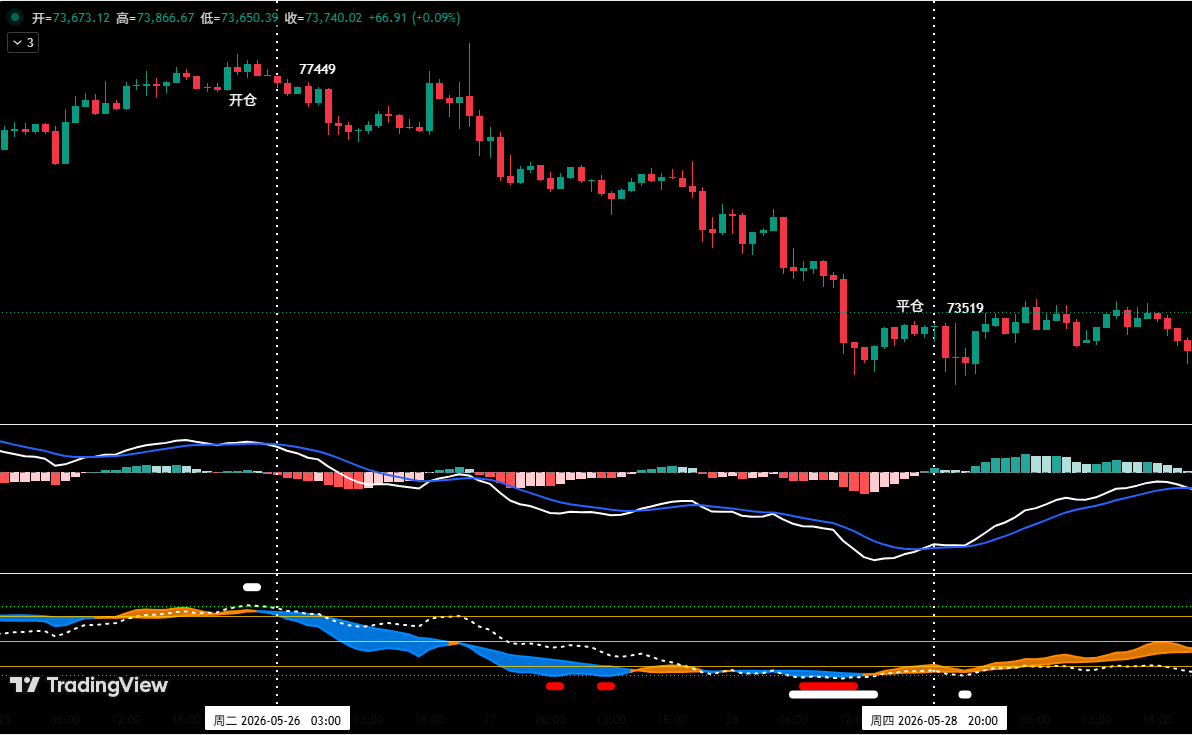
Following the predetermined playbook, one short trade was executed successfully last week, yielding approximately 5.07% profit. Entry rationale: the price faced resistance near $78,000, forming a bearish top-fractal candlestick pattern; the spread trading model triggered a white-dot top warning, while the momentum model signaled a bearish divergence, prompting an entry at $77,449 with 30% position size (Figure 5). Exit rationale: near $73,000, the price showed stabilization with a bottom-fractal pattern; the spread model issued a strong bottom alert (red dot + white dot) that resonated with the momentum model, leading to a full liquidation at approximately $73,519 and a realized gain of ~5.07%.

Risk Management Notes
Set an initial stop-loss immediately upon entry. When profit reaches 1%, move the stop to breakeven; at 2% profit, shift the stop to secure a 1% gain; thereafter, for every additional 1% profit, trail the stop by an equal 1%, dynamically locking in profits. Financial markets are highly volatile; all views, analytical models, and trading strategies expressed herein are derived solely from personal technical analysis and serve as a personal trading journal, not investment advice. Markets carry risk—trade with caution.