At the macro level, marginal shifts in Fed policy expectations continue to dominate risk asset pricing. After recent consolidation, the crypto market shows diverging views at critical price levels. This weekly review follows the established framework: multi-timeframe structural analysis combined with quantitative model signals to assess BTC and HYPE for this week and formulate specific short-to-medium-term trading plans. All content herein is a personal technical analysis record, serving solely as a reference and review basis for personal trading decisions. It does not constitute any investment advice. Markets are always more complex than predictions; strictly adhering to risk management and stop-loss discipline remains the top priority.
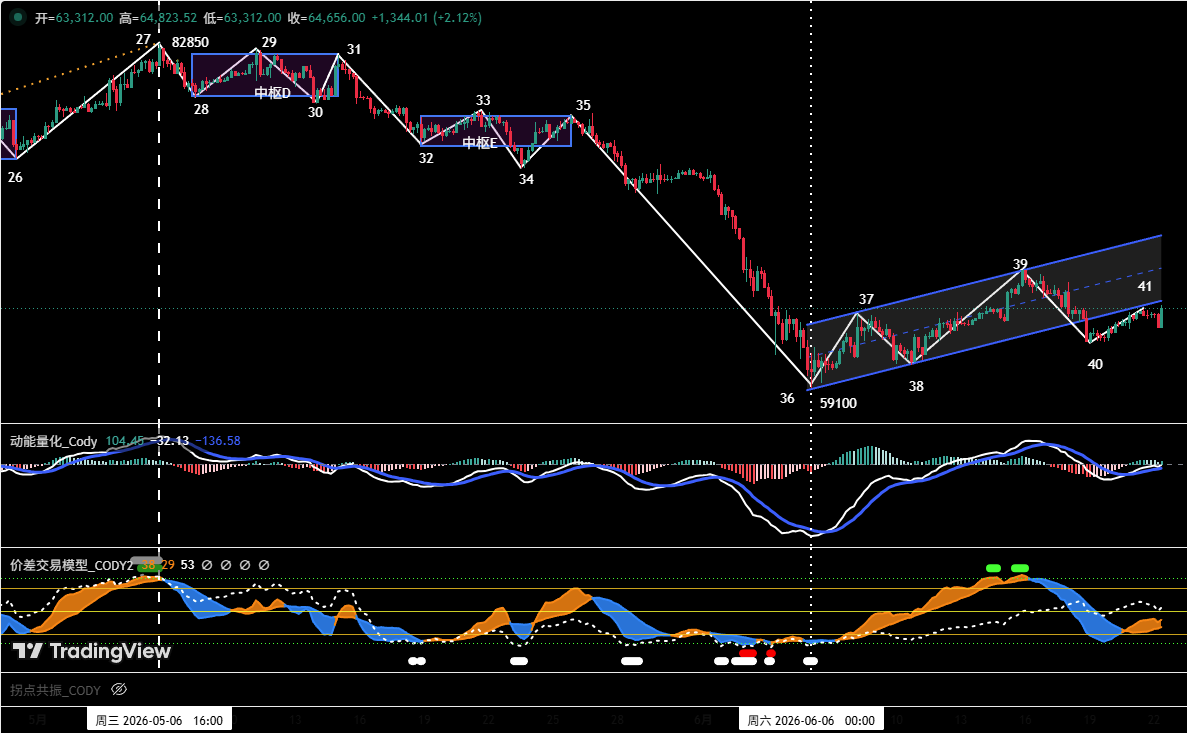
BTC Structure Analysis and Trading Strategy
On the 4-hour chart, BTC's rebound from the June 5 low of $59,100 can be divided into five segments: 36-37, 37-38, 38-39, 39-40, and 40-41. The overall structure formed an ascending channel (blue): the upper trendline connects 37 and 39, the lower trendline connects 36 and 38. Price broke below the channel at point 40, and the current 40-41 leg appears as a retest of that breakdown. If point 41 fails to reclaim the lower channel boundary, the probability of a retest of the prior low near $59,100 increases significantly.
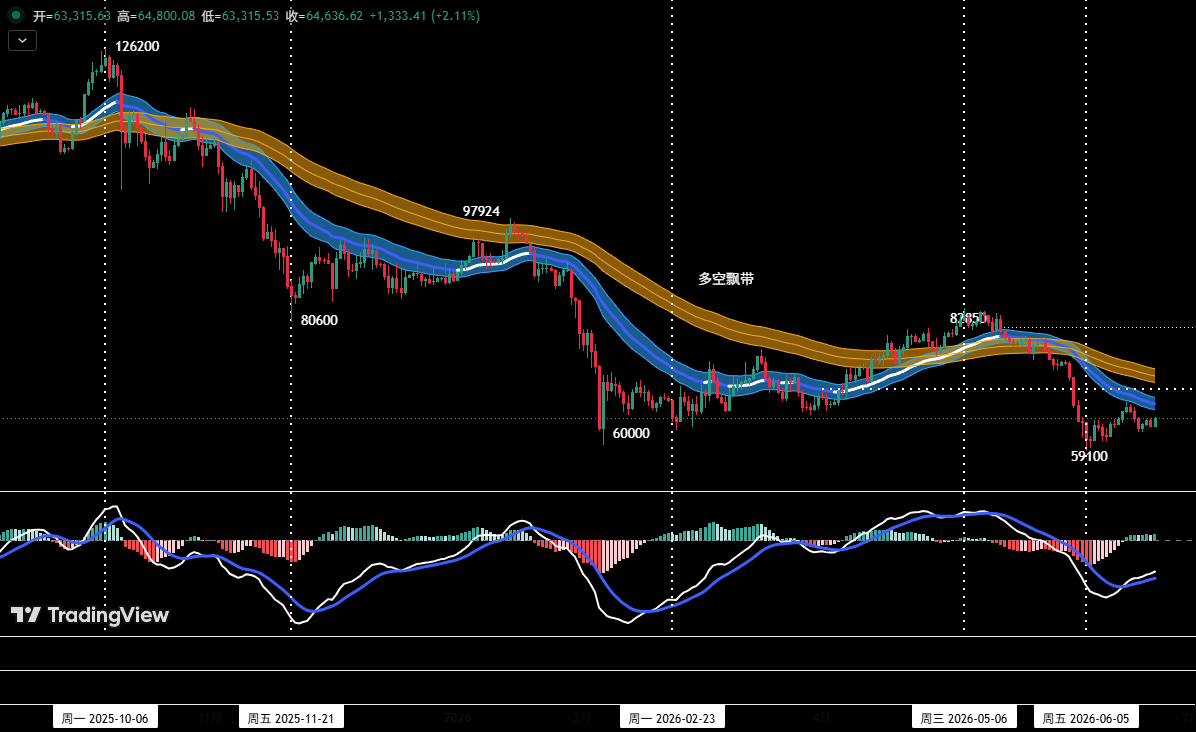
Key support levels: first support at $59,000–$60,000 (prior major support), second support near $55,000 (prior major support). The position monitoring model shows price has effectively broken below the “bull-bear channel,” confirming a bearish market structure. Last week, a short position was initiated near $64,500 with an initial medium-term position of about 20% of total funds, adhering to stop-loss discipline and waiting for further add-on opportunities.
For short-term trading, use 30% of capital with stop-losses, seeking spread opportunities within support/resistance zones (operating on 30- or 60-minute cycles). To dynamically adapt, three specific plans (A/B/C) have been prepared in advance.

HYPE Structure Analysis and Short-Term Strategy
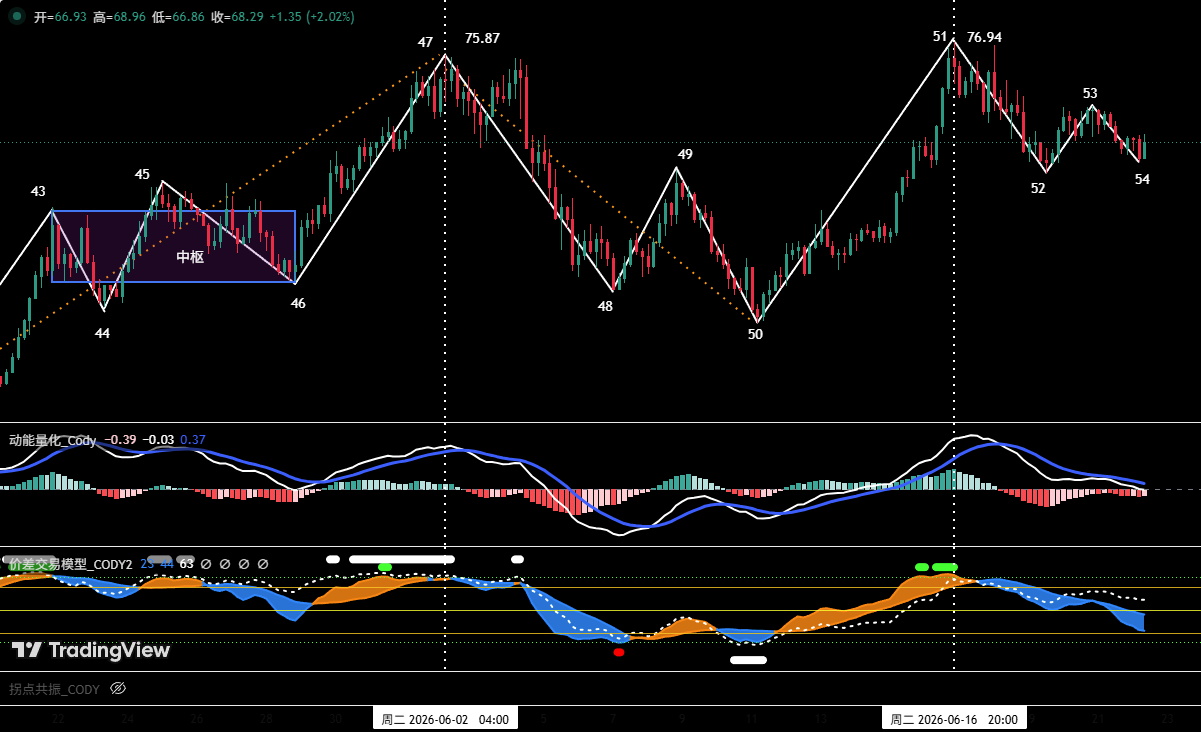
On the 4-hour chart, HYPE started its correction from the June 2 high of $75.87 (point 47) and found support near $52.62 (point 50) on June 10, lasting about 9 trading days. A strong bullish leg (50-51) followed, breaking the prior high in 6 days and reaching a new cycle high of $76.94, indicating robust bullish momentum. The decline from the new high formed a clear three-wave correction (51-52, 52-53, 53-54). Price is now retesting the key support zone of $64–$66.

Key resistance levels: first around $77, second at $80–$82. Key support levels: when HYPE retests the $64–$66 zone or deeper $52–$54 zone and shows signs of stabilization, combined with bottom signals from two models, a light long position (under 30% of capital) may be considered with strict stop-loss discipline.

Financial markets change rapidly; all analysis and trading strategies need dynamic adjustment. All views, models, and strategies herein are personal technical analysis records for trading journal purposes only, not investment advice. Market risk exists; invest cautiously. Do not act solely on this content.