
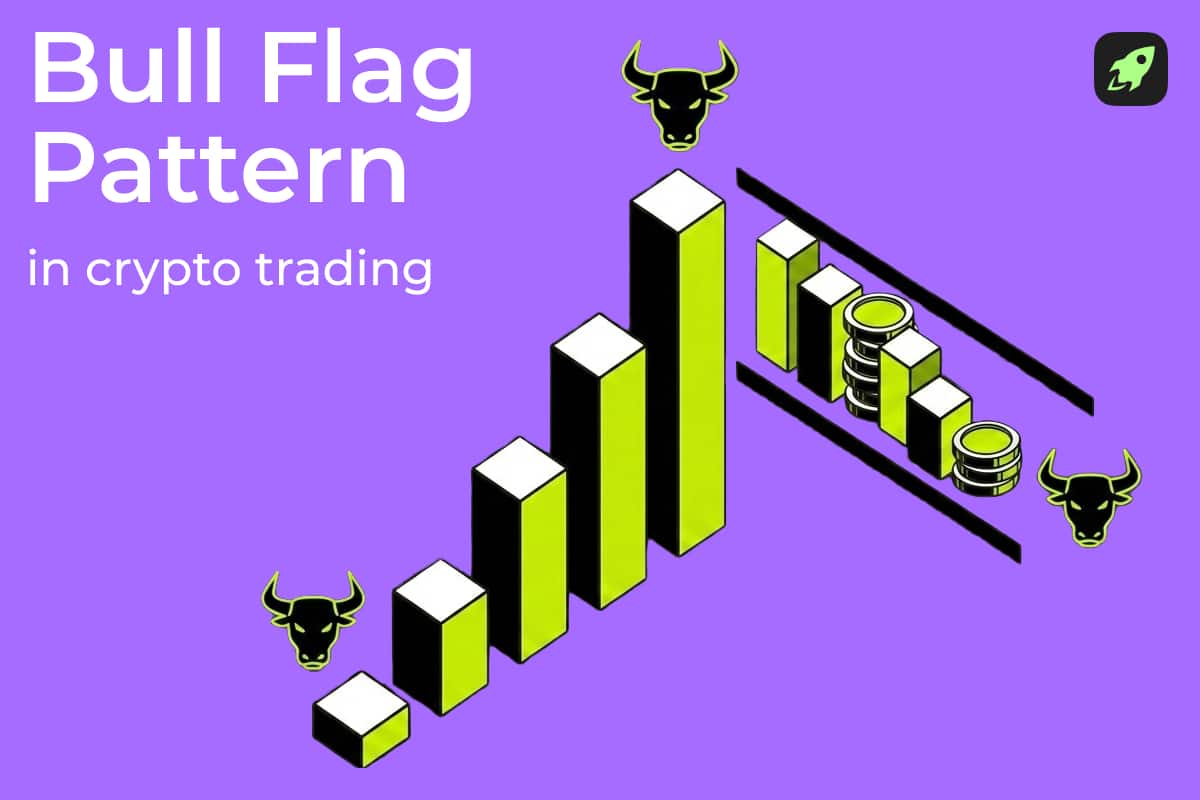
Crypto charts often look simple after a strong green candle. Then price stalls, candles shrink, and traders wonder: is the rally cooling off or just catching its breath? The bull flag pattern helps structure that uncertainty. It appears after a sharp upward move, followed by a tight consolidation, and often leads to a continuation higher. In the fast-moving crypto market, this pattern is widely used, but false breakouts are just as common.
Two Core Components: Flagpole and Flag
A bull flag has two parts. The flagpole is a steep, near-vertical rise with expanding volume. The flag is a consolidation channel that forms after the pole, usually slightly downward or sideways, with roughly parallel trendlines. The narrower and more orderly the channel, the more reliable the setup. If the flag is too wide, messy, or retraces deeply, the pattern likely won't hold.
Nine-Step Checklist for Spotting a Bull Flag
To identify a bull flag on a chart, run through this checklist: ① A clear upward trend exists; ② The flagpole is obvious; ③ Price consolidates in a controlled range; ④ The flag slants sideways or slightly down; ⑤ Upper and lower trendlines are roughly parallel; ⑥ Volume drops during the flag; ⑦ Price breaks above the upper trendline; ⑧ The breakout candle closes above resistance; ⑨ Volume expands on breakout. Not every item is mandatory, but if you have to force the lines, the pattern isn't clean enough to trade.
What Volume Tells You
Volume acts as the pattern's voice. A healthy bull flag shows this rhythm: high volume on the flagpole → low volume during consolidation → high volume on breakout. Low volume in the flag suggests sellers lack control. Expanding breakout volume signals fresh demand. If the breakout comes on weak volume, price often falls back into the channel—a classic false breakout. In crypto, spot, futures, and perpetual volumes don't always align, so read volume together with price action, liquidity, and broader market sentiment.
Three Entry Styles and Their Trade-Offs
Traders use three common entry methods. Aggressive entry near the flag's lower trendline offers a better risk-reward ratio because the stop-loss sits close, but the pattern can still fail without breakout confirmation. Breakout entry above resistance confirms the pattern but risks slippage, especially on low-liquidity altcoins. Retest entry waits for price to pull back to the breakout level and hold support, reducing false breakout risk—but you may miss the move if price never retests. No method is perfect; pick one that fits your timeframe and risk appetite.
Stop-Loss and Take-Profit: Plan Before You Enter
Set an invalidation level before placing any trade. Common stop-loss zones include: below the lower trendline, below local support, below a recent swing low, or below the entire flag channel. For profit targets, many traders use a measured move: measure the flagpole height and project it upward from the breakout point. That target is an estimate, not a guarantee. Always compare it with nearby resistance, market structure, and the trade's risk-reward ratio. If the target is too tight or the stop is too wide, skip the trade.
When Does a Bull Flag Fail?
Even a textbook-perfect bull flag can fail. Look for these failure signs: price drops below the lower trendline; price breaks out but quickly falls back inside the channel; weak or missing breakout volume; flag retracement exceeds 61.8% of the pole; the flag drags on for weeks into a rectangle; a news shock reverses momentum; or a low-liquidity altcoin produces a wick-heavy fakeout. Once the pattern loses structural integrity, abandon it rather than redrawing lines to fit.
Distinguishing Bull Flags from Similar Patterns
The bear flag is the bearish counterpart, forming after a sharp drop. The pennant uses converging trendlines rather than a parallel channel. A rectangle consolidation lasts longer and often lacks a strong flagpole. Not every pause is a bull flag—forcing the label invites overtrading.
Ultimately, the bull flag is a probability-based tool, not a prediction machine. It works best when the structure is clean, volume confirms the breakout, and the broader trend supports it. But regardless of how perfect the pattern looks, position sizing, stop-loss discipline, and respect for false signals are what keep traders alive in crypto's 24/7 volatility.