

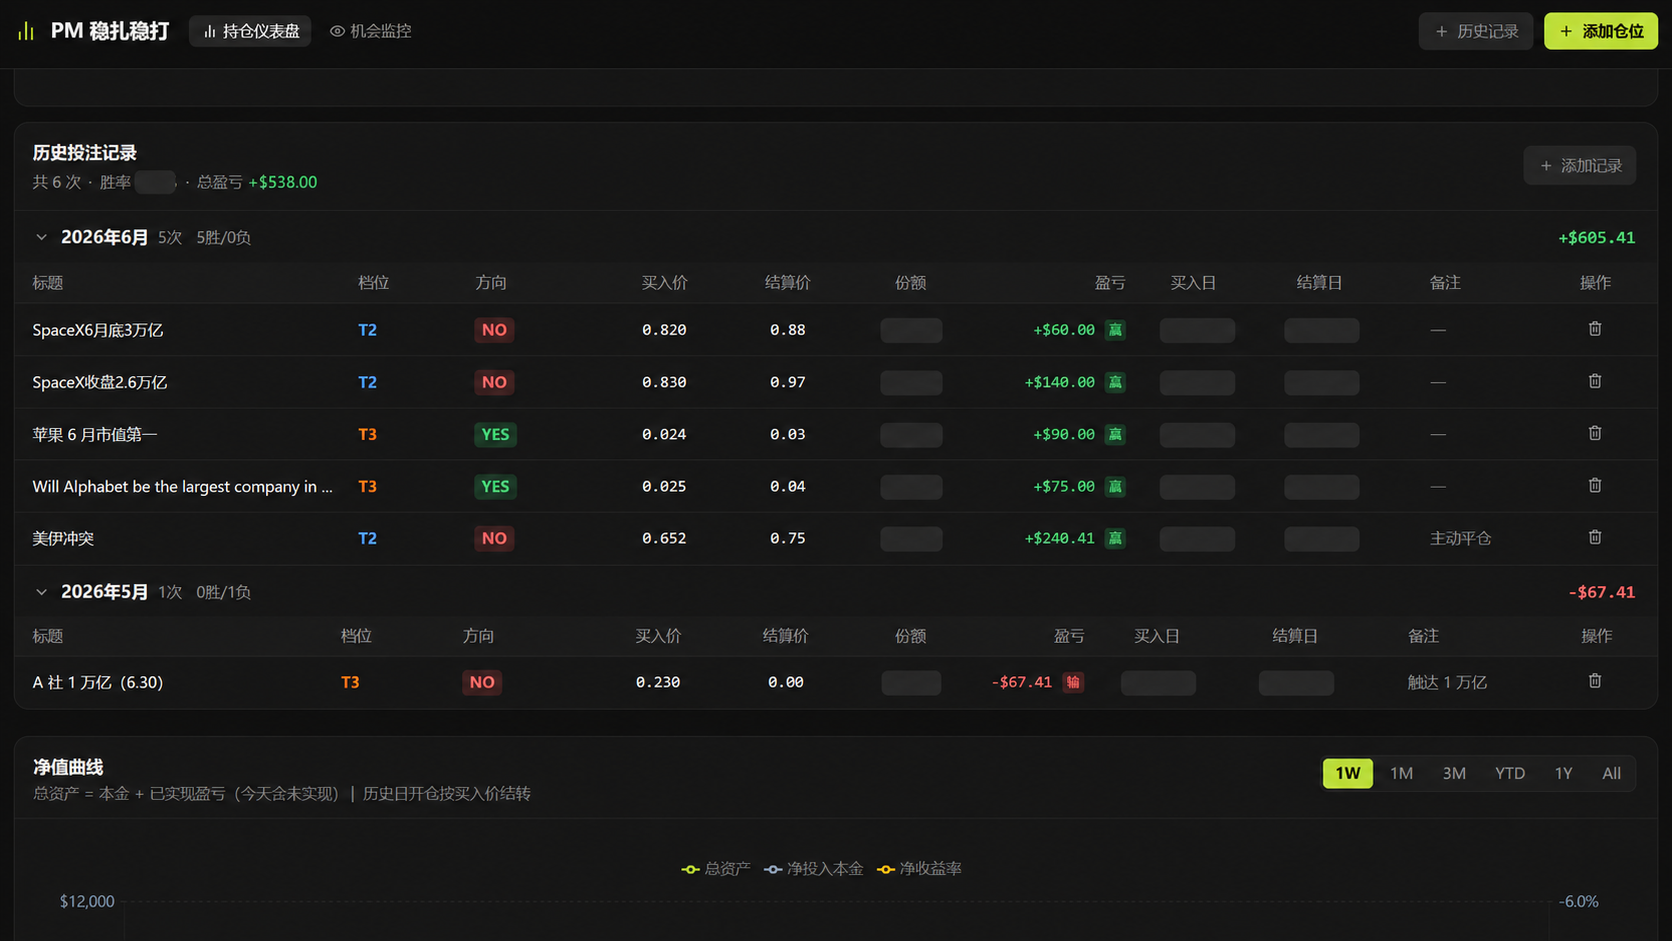
In a previous article titled “I Used AI to Build Myself an Investment Workbench,” the author introduced several tools created through Coding: a cross-market asset dashboard, an investment map, a personal content operations console, and a Polymarket betting-monitoring dashboard that has recently been used frequently. Over more than half a month of testing, the author put in around $1,600 of principal and recorded returns of more than 30%. The real-time statistics shown by the dashboard were broadly aligned with the final actual net profit, with a difference of only about 6U, mainly from details such as open orders and liquidity rewards.
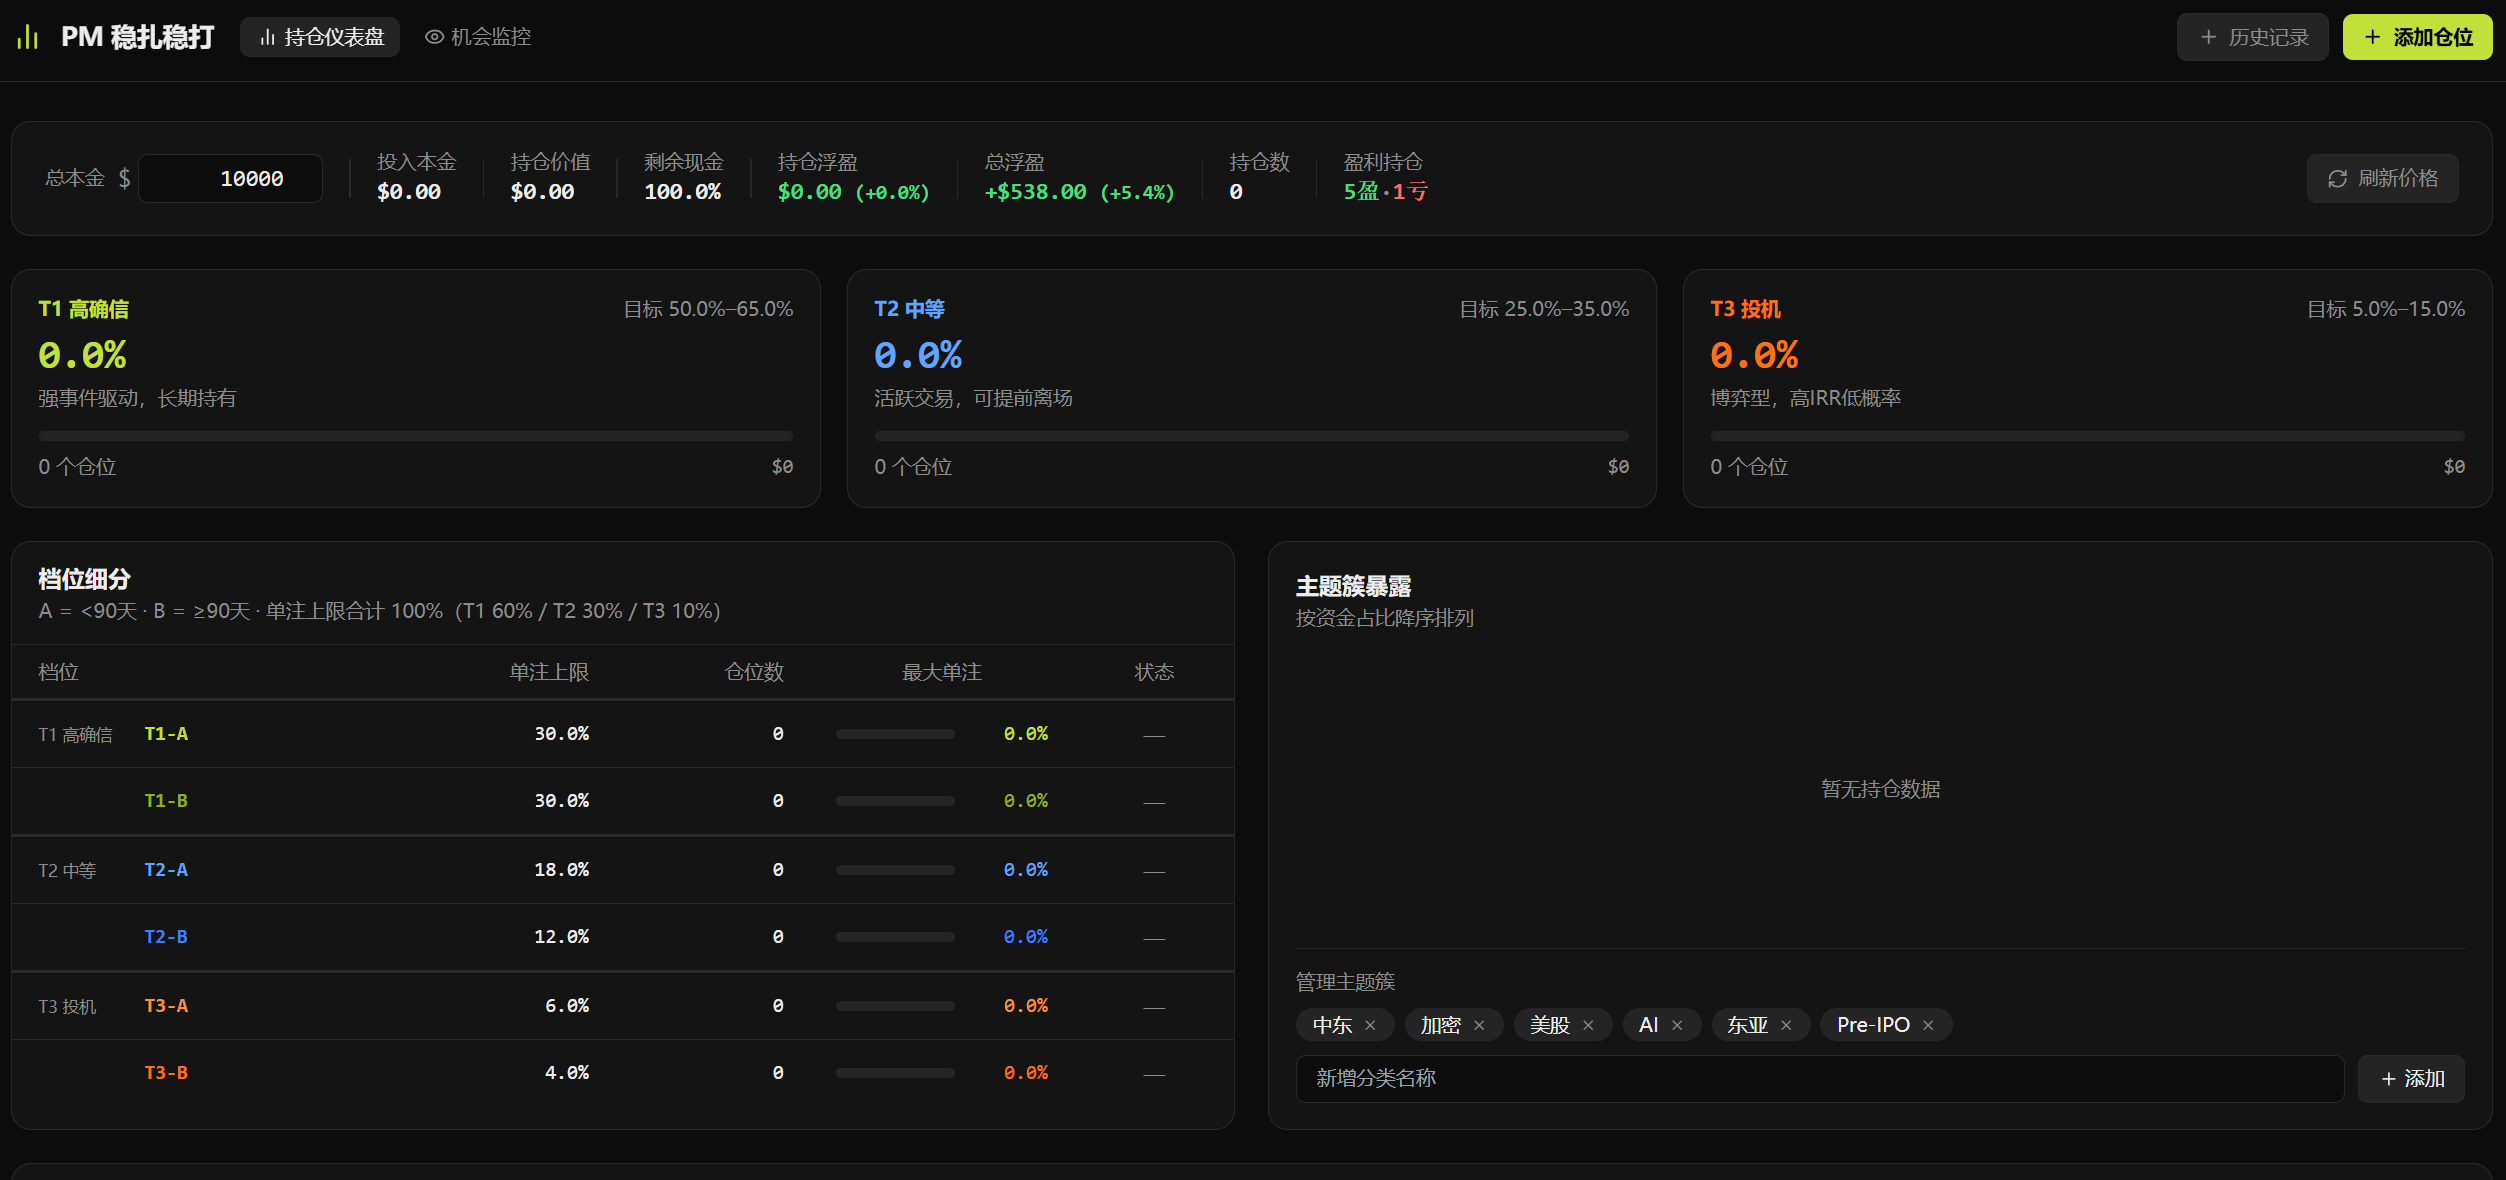
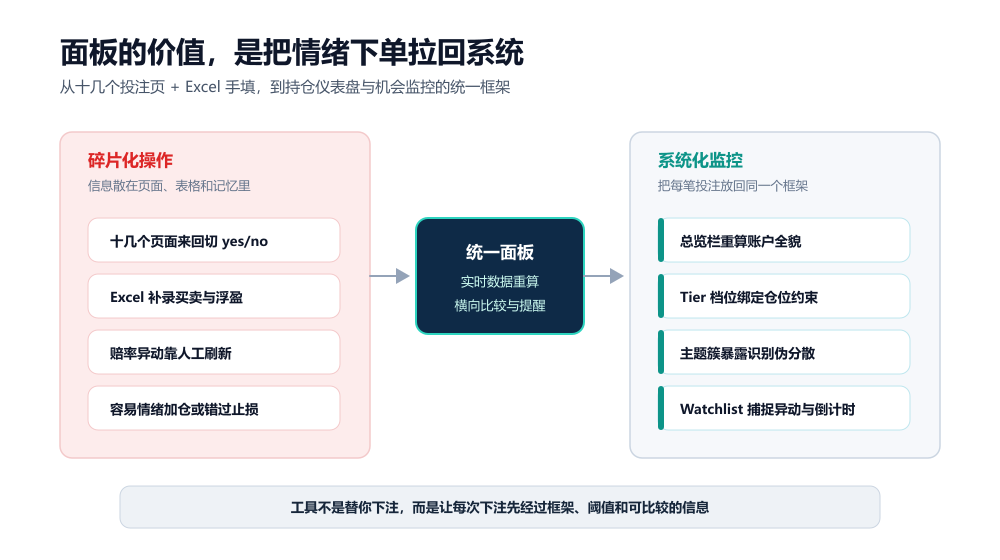
The point of the review, however, is not to present Polymarket as an easy place to make money, nor to package the dashboard as an arbitrage tutorial. After completing this round of testing, the author reached the opposite conclusion: Polymarket is not a venue suited to traders who rush in with an “arbitrage” mindset. The dashboard’s most important value was not simply profit tracking, but the discipline and risk-control structure it imposed on a market where a wrong call can lead to a total loss on a position.
From Excel Logs to a Real-Time Betting Dashboard
The author began building the dashboard by hand around May 21. The initial need was simple: avoiding the need to open more than a dozen betting pages repeatedly to check yes/no price changes, and avoiding manual Excel entries for buys, sells, unrealized profit and loss, settlement dates and event types. Before this dashboard, the author had been using Excel to track trades and event data. That approach was workable but clumsy. In live Polymarket trading, manual records quickly become inadequate: a user may start with a small position, then add more when the odds move because there is no intuitive view of the overall exposure; or an event may move sharply, and if the spreadsheet has not been updated in time, the user can miss a stop-loss or add-position window.
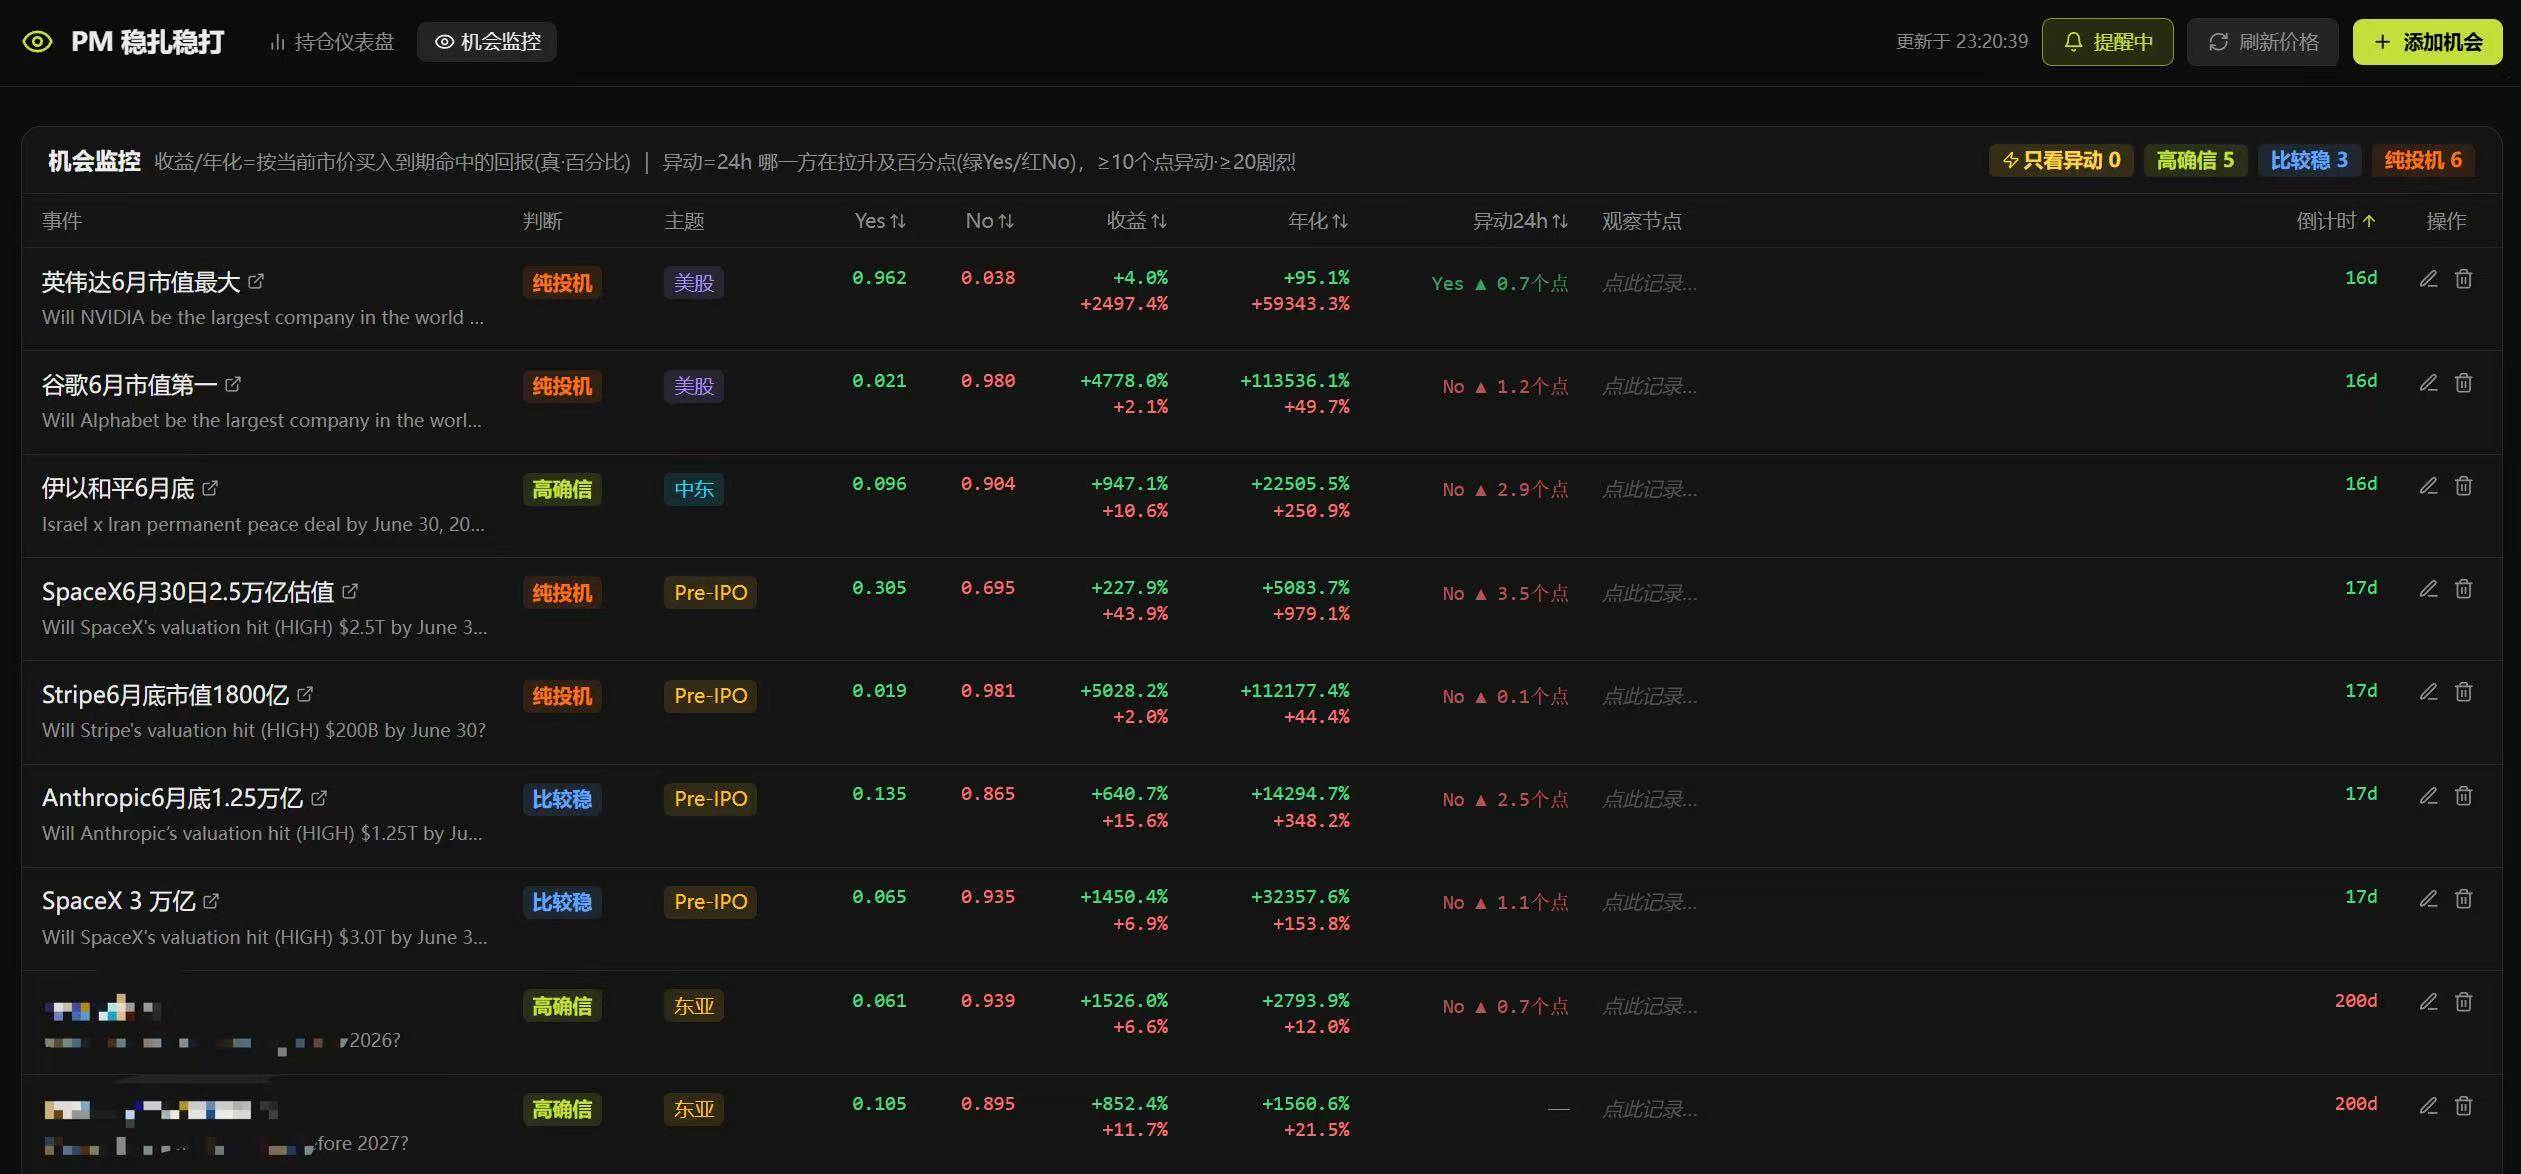
After several iterations, the dashboard was divided into two tabs: “Position Dashboard” and “Opportunity Monitoring.” The Position Dashboard became the core system. It can fetch live Polymarket data and recalculate position data dynamically. For each market, it records the event name with a direct hyperlink to the trading page, T1/T2/T3 tier classification, current yes/no price, profit, annualized return, abnormal movement alerts, observation checkpoints and a countdown to expiry. The abnormal-movement alert can be customized. For example, if the price changes by more than 20% within 24 hours, a pop-up appears as long as the web page remains open.
The author highlighted two design choices. First, after finding a suitable Polymarket interface, the dashboard can parse a betting event simply by receiving its webpage link. It then automatically displays the yes/no options, corresponding prices and categories under the same event, reducing manual input. Second, the tier assignment of the same position is automatically rearranged according to the remaining days before settlement. Before Anthropic released Mython, the watchlist showed a clear price movement. The author judged it as a high-probability event at that point; entering then could capture roughly 10 points of return. Without a watchlist, the author said such opportunities would be difficult to capture consistently.
The Tail Risk Behind Binary-Market Returns
After the test, the author focused on a structural trap in binary markets such as Polymarket. They are unfriendly to users who prefer single heavy positions, but more suitable for those who build a diversified “supermarket” of many positions. The author used a simple example: if the yes price c of an event is 0.80, the market is roughly pricing the event as having an 80% chance of happening. If the author’s own estimate q is 0.90, the expected return can be roughly calculated as EV = q / c - 1 = 0.90 / 0.80 - 1 = 12.5%. That looks attractive, but Polymarket is not a bond. Behind the 12.5% expected return is a sharp tail risk: if the judgment is wrong, the loss is not 12.5%, but 100% of that position.
For that reason, the author does not look only at expected return inside the dashboard. Two other metrics are monitored at the same time. One is the gap between the author’s probability judgment and the market price, q - c. The author also set an automatic take-profit reminder target at the midpoint between the purchase price and 100. This gap is the core of whether an edge truly exists. The other metric is the impact on the overall account if a single position goes to zero. That second concern is also the source of the T1, T2 and T3 classification system described in the article.
T1, T2, T3 and Position Limits
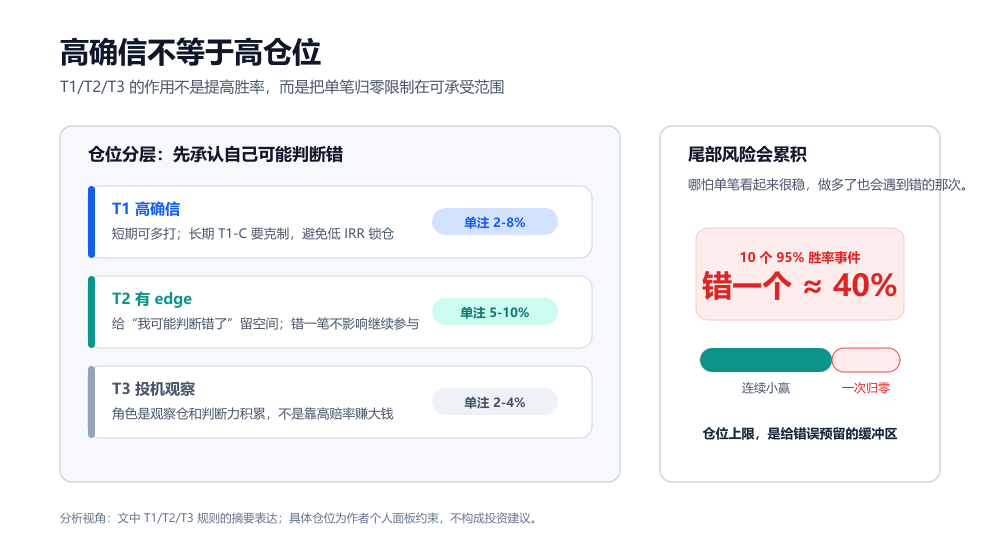
The author divides positions into three categories. T1 refers to high-conviction positions. For the author, the comfort zone lies in East Asia-related events and certain geopolitical topics where an information gap between Eastern and Western sources can exist, and positions are added only after repeated verification. T2 refers to relatively stable positions where the author believes the current implied probability is clearly higher than the yes or no pricing. T3 refers to pure speculation, usually in high-odds events. These are not meant to be held frequently or for long periods; they are used mainly for contrarian short-term moves and price reversion.
T1 still has hidden costs, especially in long-duration markets. A T1 position may show a static return of 18%, but if it settles after 180 days, the annualized IRR may be only 3–4%. During that period, principal is locked, and later opportunities with higher IRR can be missed. The author therefore further divides T1 internally by time buckets. Short-term T1-A positions can receive more allocation, while long-term T1-C positions require restraint. Allocating too much to low-IRR long-term markets creates an implicit loss of capital efficiency.
For T2 positions, even if an edge exists, room must be left for the judgment being wrong. The single-position cap is set at 8–10%, so even if the position loses entirely, total account loss remains within 10% and does not prevent participation in later opportunities. T3 positions may have attractive odds, but the author uses the smallest size to observe them. The goal is not to earn large profits from T3, but to keep tracking high-odds markets and build a feel for those order books and price moves. In the author’s view, a position cap is essentially a way to reserve an affordable cost for being wrong.
A key point emphasized in the review is that high conviction does not equal high position size. Even if a trader believes an event has a 95% chance of happening, the remaining 5% chance of going to zero still requires position limits. The author gives an extreme example: if a trader makes 10 independent bets that each seem to have a 95% win rate, the probability of at least one being wrong is about 1 - 0.95^10 ≈ 40%. The more trades one makes, the more likely one is to encounter that wrong outcome.
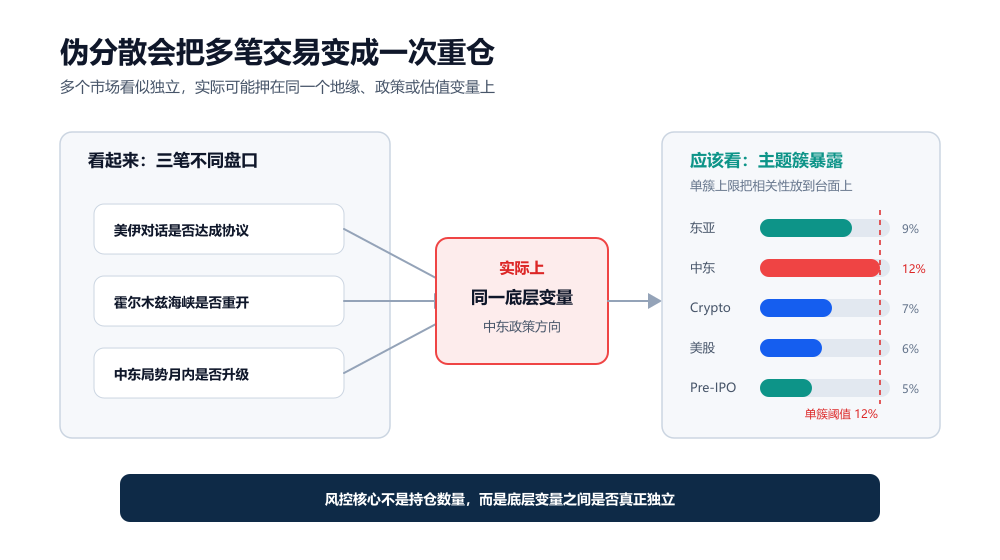
The situation is even more complicated because many Polymarket markets are not independent. They are often correlated. The author cites three examples: “whether U.S.-Iran talks reach an agreement,” “whether the Strait of Hormuz reopens,” and “whether the Middle East situation escalates within the month.” These may appear to be three separate markets, but their underlying variable is almost the same: the direction of Middle East geopolitical policy. If the underlying judgment is wrong, all three positions can bleed at the same time. For the author, this is where the dashboard helps most: not by raising the win rate, but by limiting large mistakes. Its core value is risk control rather than return statistics.
Information Advantage Is Not Risk-Free Arbitrage
After more than half a month of intensive testing, the author concludes that Polymarket does contain opportunities, but it is not the arbitrage venue many people imagine. In earlier on-chain arbitrage, the rules were generally clear and price dislocations could be locked in. Polymarket is different. It tests the user’s logical understanding of how the winds around a betting event shift. For example, Chinese users can indeed have some information-advantage opportunities in East Asia-related political and economic dynamics. That edge can be explored, but it does not guarantee winning.
Polymarket does not settle according to a trader’s understanding of reality. It settles according to the market’s rules and designated data sources. The author also notes that UMA manipulation issues have appeared repeatedly. In addition, something that feels settled in a Chinese-language context may not be defined the same way in an English rule set. The rules of each market often contain wording traps. Based on the author’s experience, there are not many true arbitrage opportunities on Polymarket. The main tools are information gaps and diversified position sizing, and even high-conviction trades can run into black-swan outcomes. When that happens, the principal in that position is gone.
The author quotes a friend: “In investing, even if there is only a 1% probability of going to zero, one should not rely on luck.” The author’s current understanding of Polymarket has therefore become more conservative. First, it should not be treated as a stable-income tool. Even with high-conviction positions, and especially after several consecutive wins, a trader should not assume they have found an ATM. A binary market can make a user feel omniscient after several wins, leading to an oversized final position that gives back earlier profits. Second, high win rate should not be equated with a good trade. An event with a 90% win probability is negative expected value if the market price is already 0.95. Conversely, an event with only a 40% win probability can have positive expected value if the market prices it at 0.20.
Third, tail risk cannot be ignored. Many people see 10% or 20% returns and regard them as stable, but if a wrong trade goes to zero, it is not low-risk income in the traditional sense. From this perspective, the author even says there are no truly low-risk opportunities on Polymarket; each one is high risk. Fourth, fake diversification should be avoided. Buying several different markets is not necessarily diversification if the positions share the same underlying variable, as in the U.S.-Iran talks, Strait of Hormuz and Middle East escalation examples.
The author now prefers to treat Polymarket as a training ground for judgment. It matches the author’s daily habit of reading political, economic, technology and financial information, and turns opinions that would otherwise remain at the level of “I think” into something that can receive feedback. The author believes those abilities are useful outside Polymarket as well. In addition to the Polymarket betting dashboard, the author also used Codex to build a dynamic monitoring dashboard for private-market valuations. It mainly tracks valuation changes of unlisted unicorn companies such as Anthropic, OpenAI, Stripe and Kraken, as well as the relationship between those changes and corresponding Polymarket bets.

Polymarket is essentially an expectations market. At times, signals in the private market have already changed while Polymarket prices have not moved. At other times, Polymarket prices move first while real-world data has not caught up. The mismatch between the two is an observation framework the author wants to keep watching. The author also stresses that this is not risk-free arbitrage. Private-market valuations are not fully transparent, and different data sources can diverge. As an observation framework, however, the author finds it interesting and plans to write about it separately when there is an opportunity.
The central message of the article is not “I made 30% with a dashboard, and you can too.” The more useful lesson, in the author’s view, is that a tool can turn feelings into a framework, and a framework into discipline. In many cases, making money does not prove that someone has discovered a secret method. It only shows that the judgment in that round happened to be correct.