

ETF inflows stayed positive during a week shaped by the Coldcard story
One of the biggest Bitcoin security stories of the year played out last week as a firmware exploit affecting certain Coldcard hardware wallets reignited debate around self-custody and operational security. At the same time, a separate data point kept building in the background.
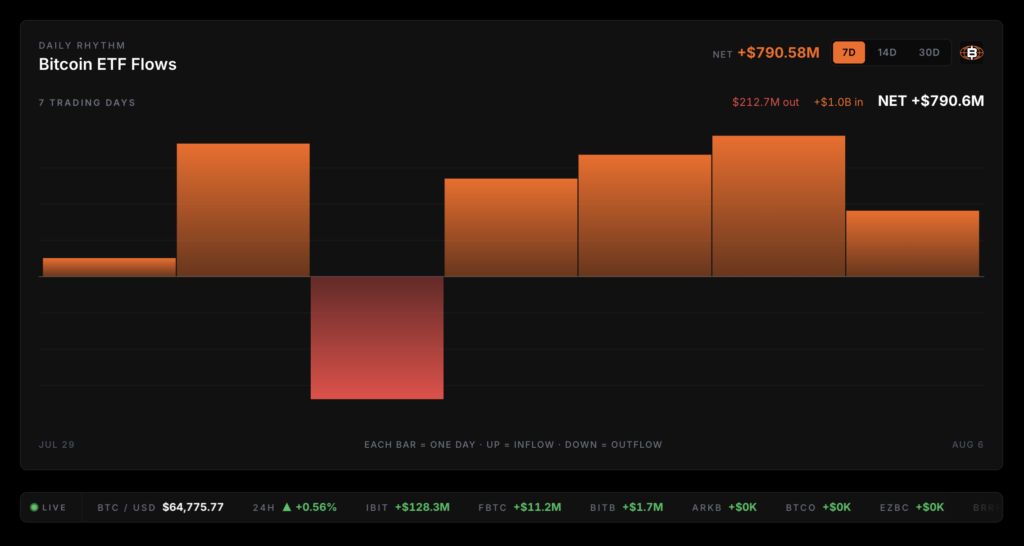
According to the Bitcoin For Corporations ETF Dashboard, U.S. spot Bitcoin ETFs recorded $790.6 million in net inflows over the same seven trading days. More than $1.0 billion entered the funds, while $212.7 million exited, leaving one of the strongest weekly stretches seen in recent months.
Bitcoin Magazine noted that the two developments are not necessarily connected. ETF flow data cannot tell investors why Bitcoin was bought. It can show what market participants actually did. During a week dominated by security headlines, institutional capital still moved into regulated Bitcoin investment products.
Only one negative session appeared in the seven-day window
The seven-day flow picture was straightforward. There was one notable setback: on July 31, U.S. spot Bitcoin ETFs posted $212.7 million in net outflows, the only negative trading session in the period.
Buyers returned quickly after that. The next four trading sessions all finished with net inflows:
- Aug. 3: +$170.1 million
- Aug. 4: +$207.8 million
- Aug. 5: +$241.6 million
- Aug. 6: +$99.4 million
By the end of the week, the positive sessions had more than offset the single selloff. The article argued that the broader seven-day view matters more than any single session because it shows where capital ultimately moved. In this case, it moved into Bitcoin.
BlackRock’s IBIT remained the main driver
As has been the case through much of the spot Bitcoin ETF era, BlackRock’s IBIT accounted for the bulk of inflows. Over the seven-day period, IBIT pulled in $757.5 million in rolling net inflows. The fund also extended its run to four straight inflow days.
On the latest trading day alone, IBIT added $128.3 million. Other issuers also posted gains. Fidelity’s FBTC brought in $11.2 million in the latest session, and Bitwise’s BITB added $1.7 million.
A small number of funds saw modest outflows, but none came close to offsetting IBIT’s continued strength. The result was a week in which overall ETF demand stayed firmly positive.
What the flow data shows, and what it does not
The report described ETF flows as one of the clearest ways to observe institutional participation in Bitcoin. The data shows where money went. It does not explain investor intent.

From one week of numbers alone, it is not possible to conclude whether buyers viewed the Coldcard exploit as insignificant, treated it as a buying opportunity, or simply continued long-term allocation plans that were already underway. What can be observed is narrower and more concrete: institutional demand held up during a week when Bitcoin security concerns dominated industry headlines.
The article also drew a distinction between a security incident tied to one custody solution and the broader investment case for Bitcoin. Based on the flow data, ETF investors appeared comfortable continuing to allocate through regulated products.
Bitcoin exposure now comes through several different channels
Bitcoin Magazine said Bitcoin is no longer accessed through a single route. Some investors choose self-custody. Others gain exposure through public companies. Many institutions use regulated ETFs. Each approach carries its own tradeoffs, operational requirements, and risk profile.
Events such as the Coldcard exploit naturally put more focus on custody practices. At the same time, ETF flow data offers a useful way to see whether institutional demand is changing underneath the headlines. For this particular week, the numbers suggested that demand remained intact.
The dashboard tracks daily flows, issuer rankings and ETF holdings
The article said daily ETF flow data has become one of the most important indicators of institutional participation in Bitcoin. The Bitcoin For Corporations spot Bitcoin ETF Dashboard tracks:
- Daily net inflows and outflows
- Rolling seven-day momentum
- Issuer-by-issuer rankings
- Estimated Bitcoin held by U.S. spot ETFs
- Market share and concentration trends
- Historical flow data across every issuer
The live dashboard link cited in the article is https://bitcoinforcorporations.com/bitcoin-etf-dashboard/ . Bitcoin Magazine said the dashboard updates each trading day as new flow data is published, giving investors and corporate decision-makers a real-time look at one of the market’s clearest institutional Bitcoin demand signals.
Disclaimer and byline
The article stated that the content was prepared on behalf of Bitcoin For Corporations for informational purposes only and reflected the author’s own analysis and opinion. It added that the material should not be relied on as investment advice and does not constitute an offer, invitation, or solicitation to purchase, sell, or subscribe for any security or financial product.
The piece first appeared on Bitcoin Magazine and was written by Nick Ward.