

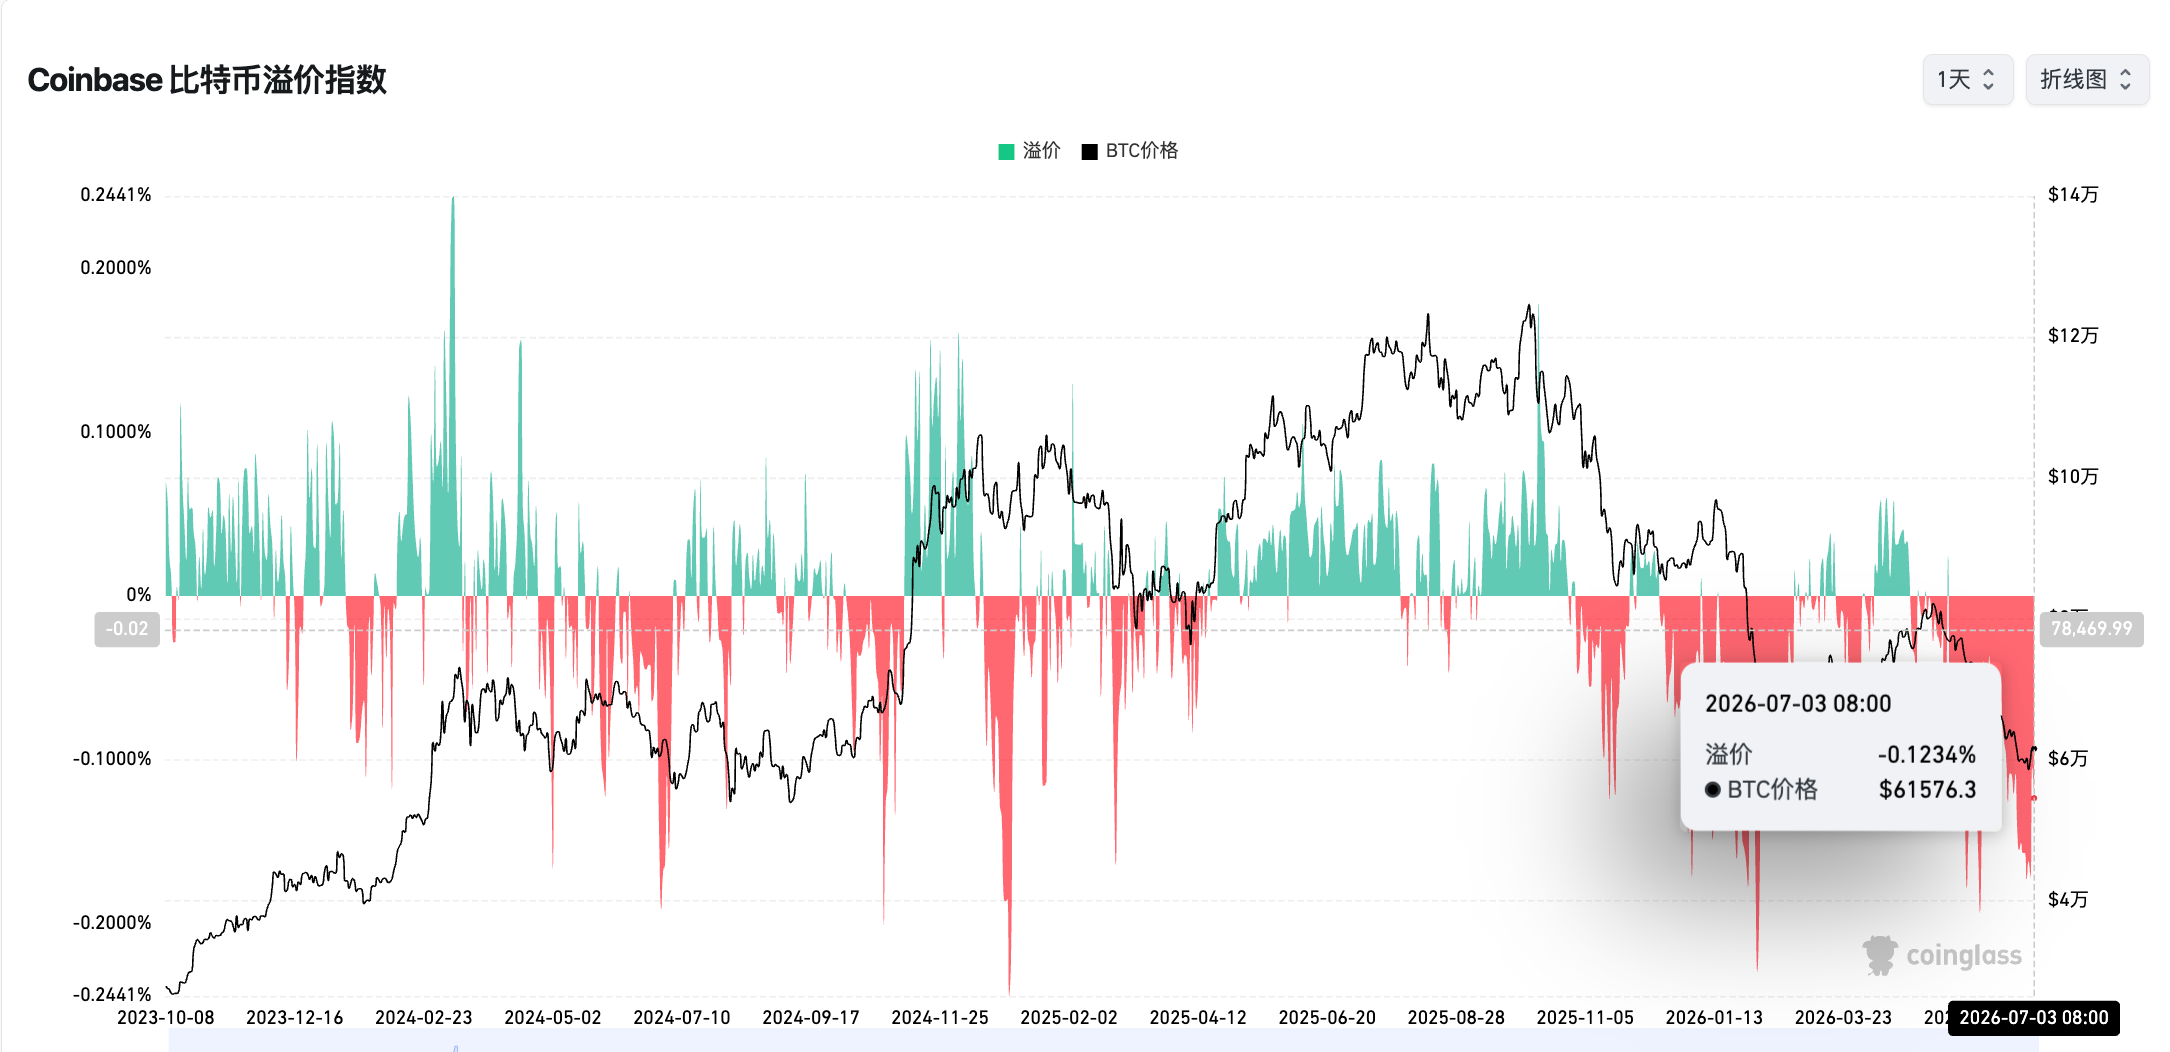
There is still no decisive signal that the current crypto bear market has ended. According to Coinglass, from May 19 to July 3, the Coinbase Bitcoin Premium Index remained in negative territory for 46 consecutive days, setting a new record for the longest negative streak since the metric was introduced. The previous record came earlier this year, when the index stayed negative for 40 straight days from January 16 to February 24. Before that, the market stress around last year’s “10/11 crash” produced roughly 30 consecutive days of negative premium. With BTC having briefly fallen below $58,000 and ETH below $1,600, investors are still searching for credible signs that the market has reached a durable bottom.
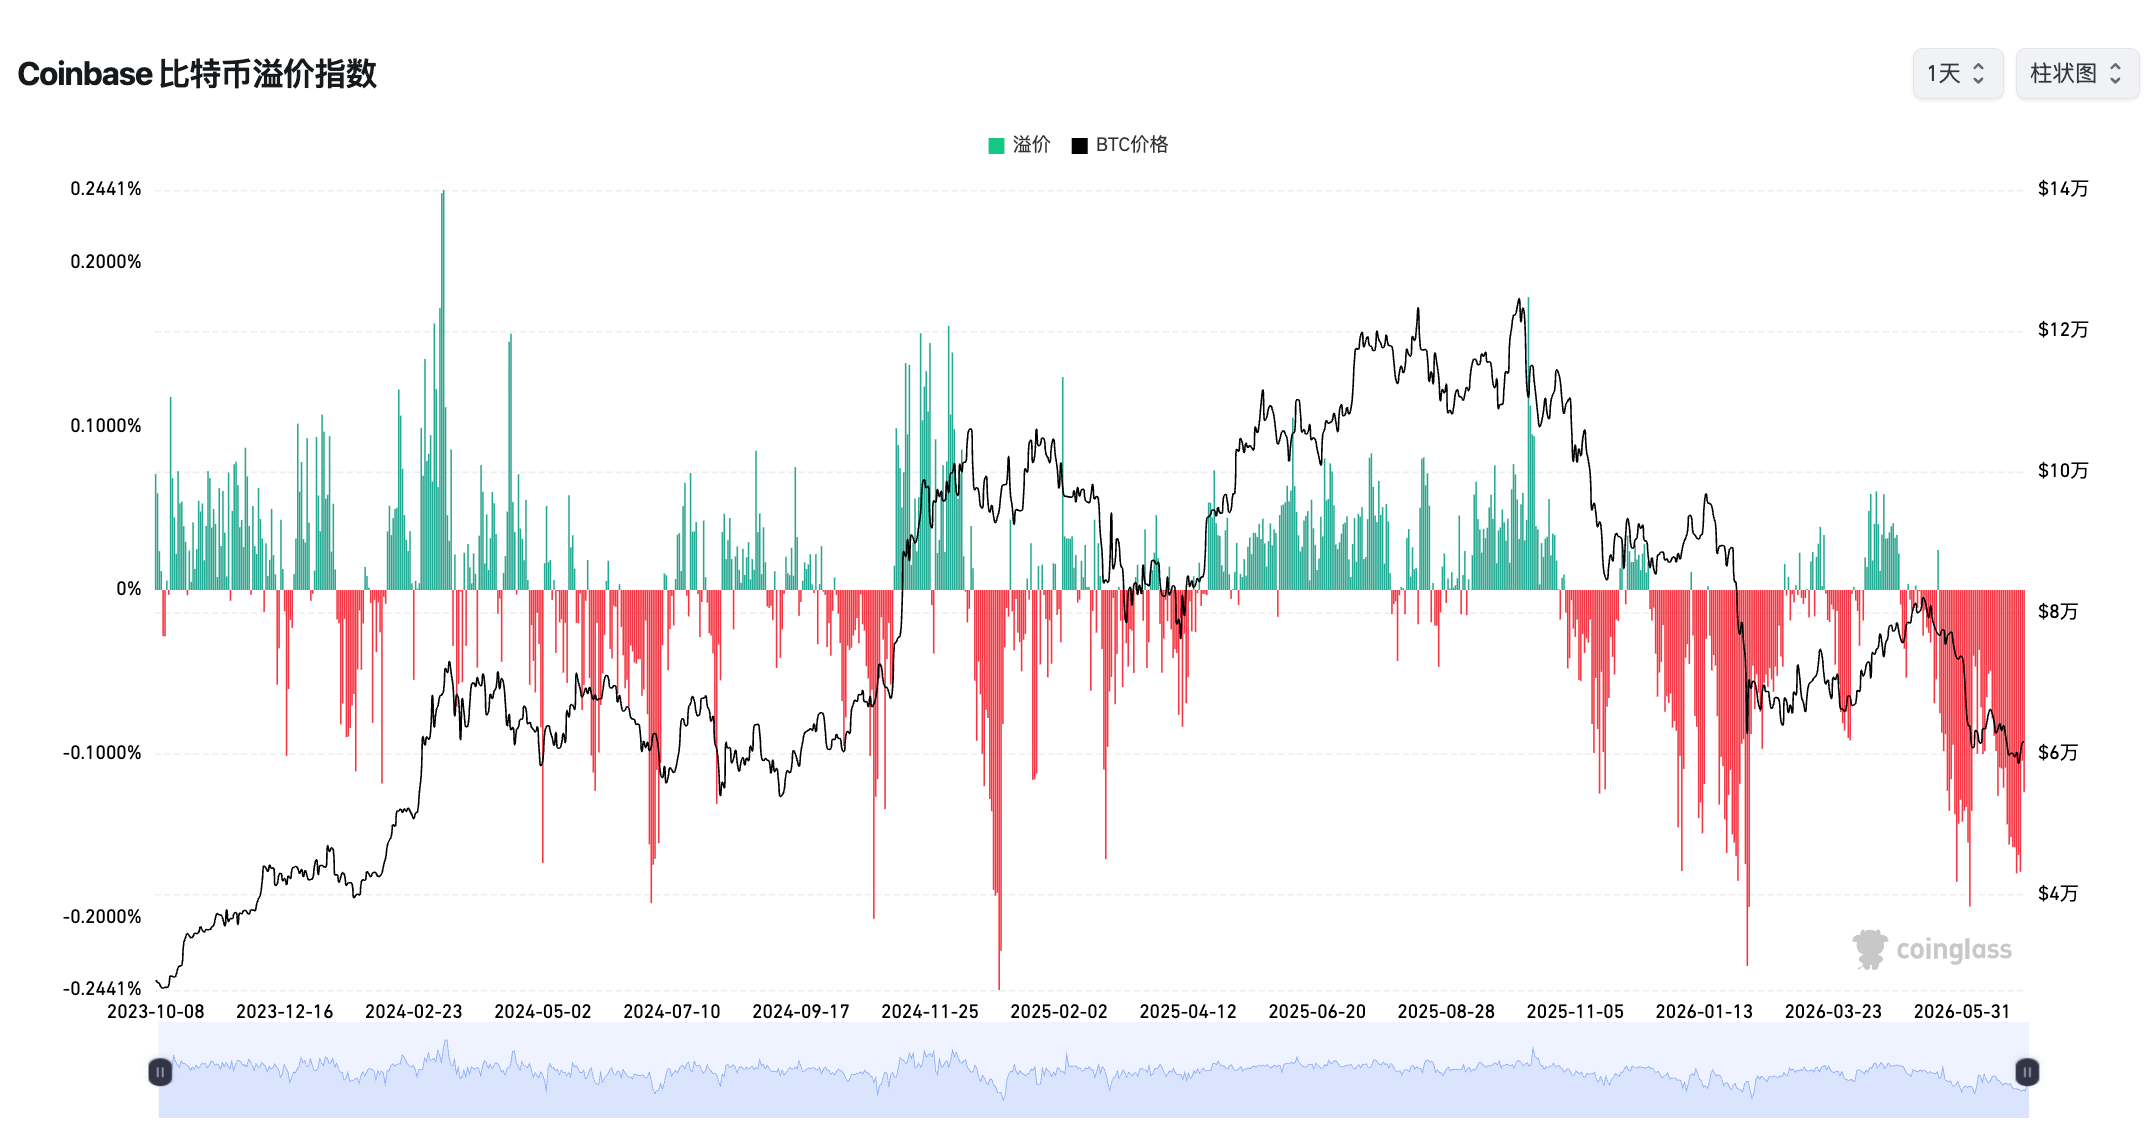
A prolonged negative Coinbase premium usually points to weak spot demand from the U.S. market, especially relative to offshore trading venues. In practice, that means the market is not only dealing with falling prices, but also with a lack of fresh demand strong enough to absorb supply. For traders and funds, this kind of environment is often more painful than a one-day crash, because it reflects a broader and more persistent deterioration in market structure. The central question now is not whether the market is under pressure, but what combination of signals would be strong enough to confirm that the bear phase is truly ending.
How Strategy’s BTC sale, ETF outflows, and the 200-week moving average break intensified the downturn
One of the most symbolic triggers came in late May and early June, when Strategy, the largest corporate BTC treasury company and a flagship crypto-linked stock, sold BTC again for the first time in three years. The transaction involved only 32 BTC, but in a fragile market it had an outsized psychological effect. Investors interpreted the move as a sign of stress rather than routine treasury management, and major assets including BTC, ETH, and SOL sold off sharply afterward.
This pressure coincided with persistent net outflows from U.S. spot Bitcoin ETFs. By June 7, spot Bitcoin ETFs in the United States had already recorded 13 consecutive trading days of net outflows, with cumulative redemptions reaching about $5.5 billion. During the first week of June, Bitcoin briefly fell below $60,000, marking its worst week since the collapse of FTX in 2022. Over the preceding seven-day period, BTC dropped 16%, and from its 2025 all-time high above $126,000, the drawdown exceeded 50%.
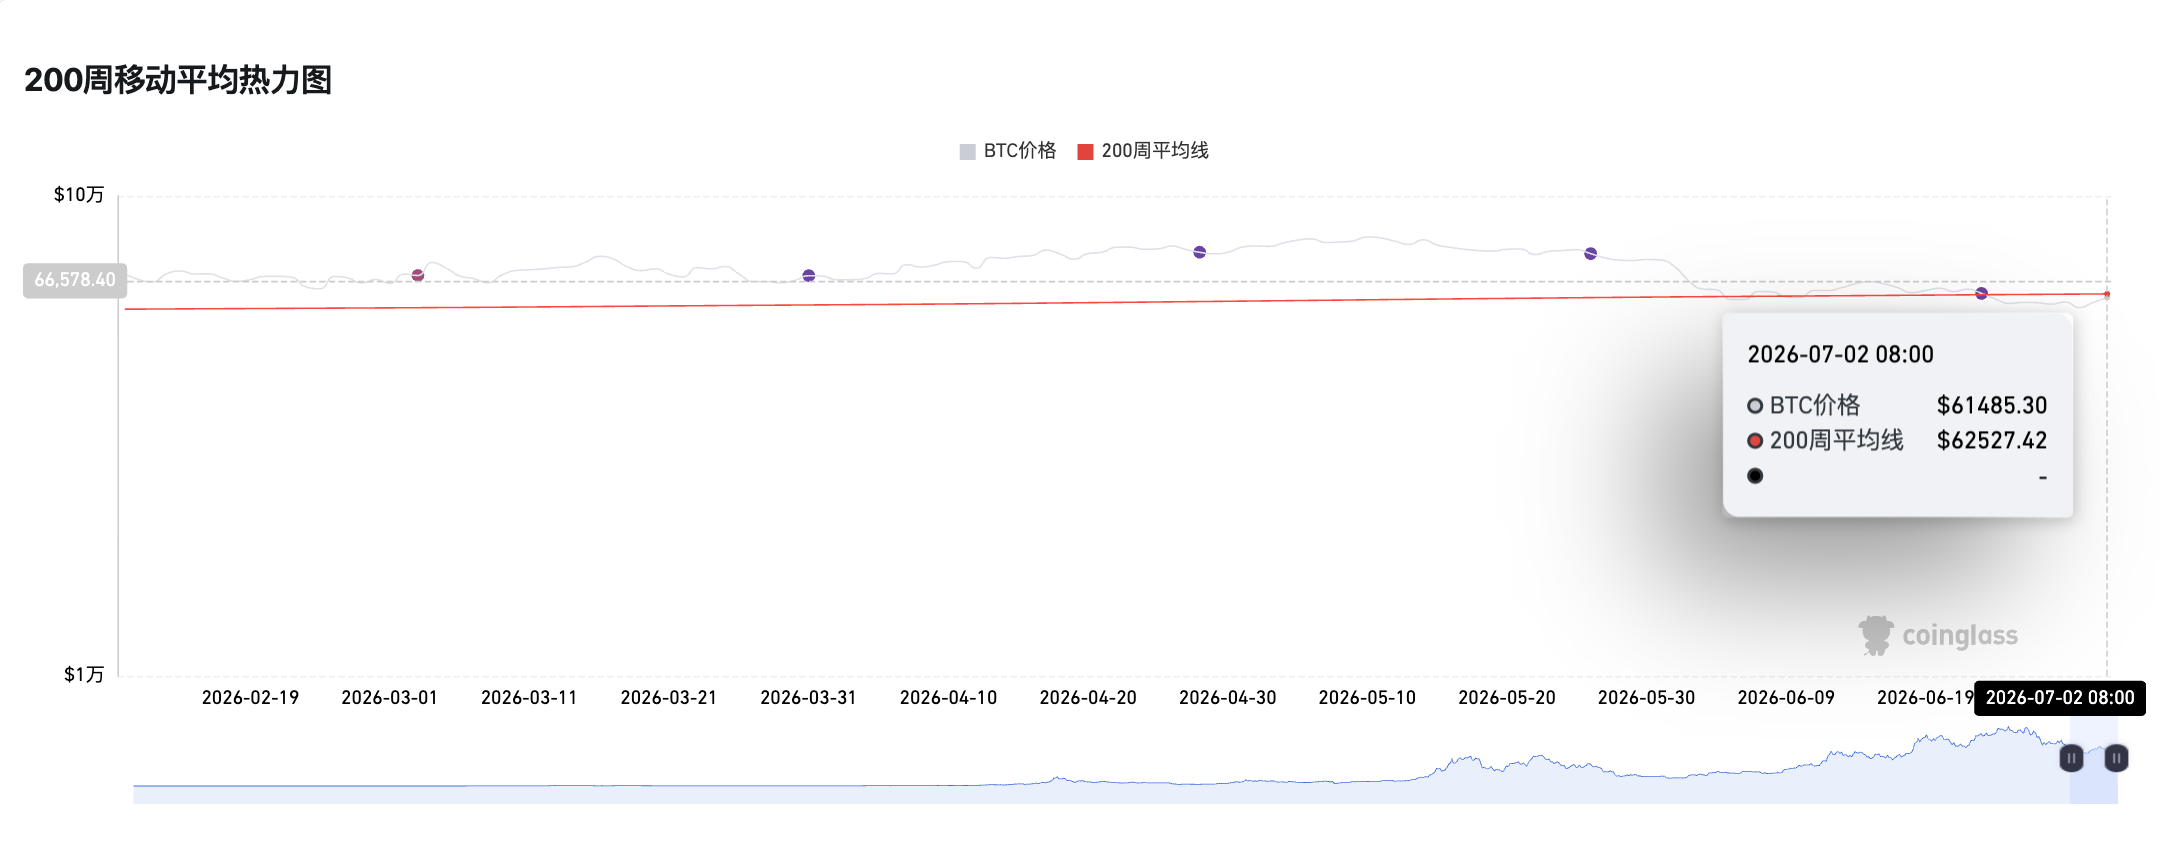
The technical damage was equally important. BTC fell below the 200-week moving average, a level widely regarded as one of the most important long-term support zones in prior cycles. Paul Howard, a senior executive at crypto trading firm Wincent, described the current environment as a “silent bear market” and argued that the loss of the 200-week average was a key confirmation that the market had transitioned into a bear phase. Although BTC later rebounded modestly toward $65,000, analysts such as Primal Fund co-founder Griffin Ardern warned that the recovery might not be sustainable and that the market could still be far from a true cyclical bottom.
What major research firms are watching: realized price, A-B-C structure, and long-term holder behavior
On June 11, CryptoQuant argued that Bitcoin could bottom around $53,600, a level tied to realized price, which represents the average on-chain cost basis of all market participants. In prior major bear cycles, BTC has often bottomed near or slightly below realized price. This approach does not depend on sentiment-based calls, but instead focuses on aggregate on-chain positioning and the cost level at which many holders become structurally underwater.
BIT offered a different framework in its June 12 weekly report, titled “Will the FIFA World Cup Mark the End of Bitcoin’s Bear Market?” The firm said the current market path remains broadly consistent with the outlook it laid out in early February 2026. In its view, the previously projected A-B-C corrective structure has now entered its final stage. After the A-wave decline pushed BTC into the $60,000 to $69,000 range, Bitcoin rebounded into the $80,000 to $90,000 zone and peaked near $83,000 before upside momentum gradually weakened. BIT added that the Fear and Greed Index has moved close to historically meaningful low levels and still shows similarities to the bottom structure seen in 2022. Based on that pattern, the firm continues to believe that the low-liquidity summer trading window during the 2026 World Cup period could mark the tail end of this bear market.
K33 added another perspective on June 17, focusing on long-term holders. The firm said the supply of BTC held by long-term holders has reached an all-time high, which may indicate that the bear market is approaching its final stage. It highlighted that in 2026, old coin reactivation activity has remained unusually subdued. As of June 6, only 218,421 BTC had been reactivated, compared with 1.18 million BTC over the same period in 2024. In K33’s interpretation, lower movement of older coins suggests that long-term holders are less willing to sell and that patient market participants are continuing to absorb supply. Even so, continued price weakness soon challenged the market’s confidence in that thesis.
Losses are spreading: STRC depegs, long-term BTC holders suffer, and ETH whales turn negative
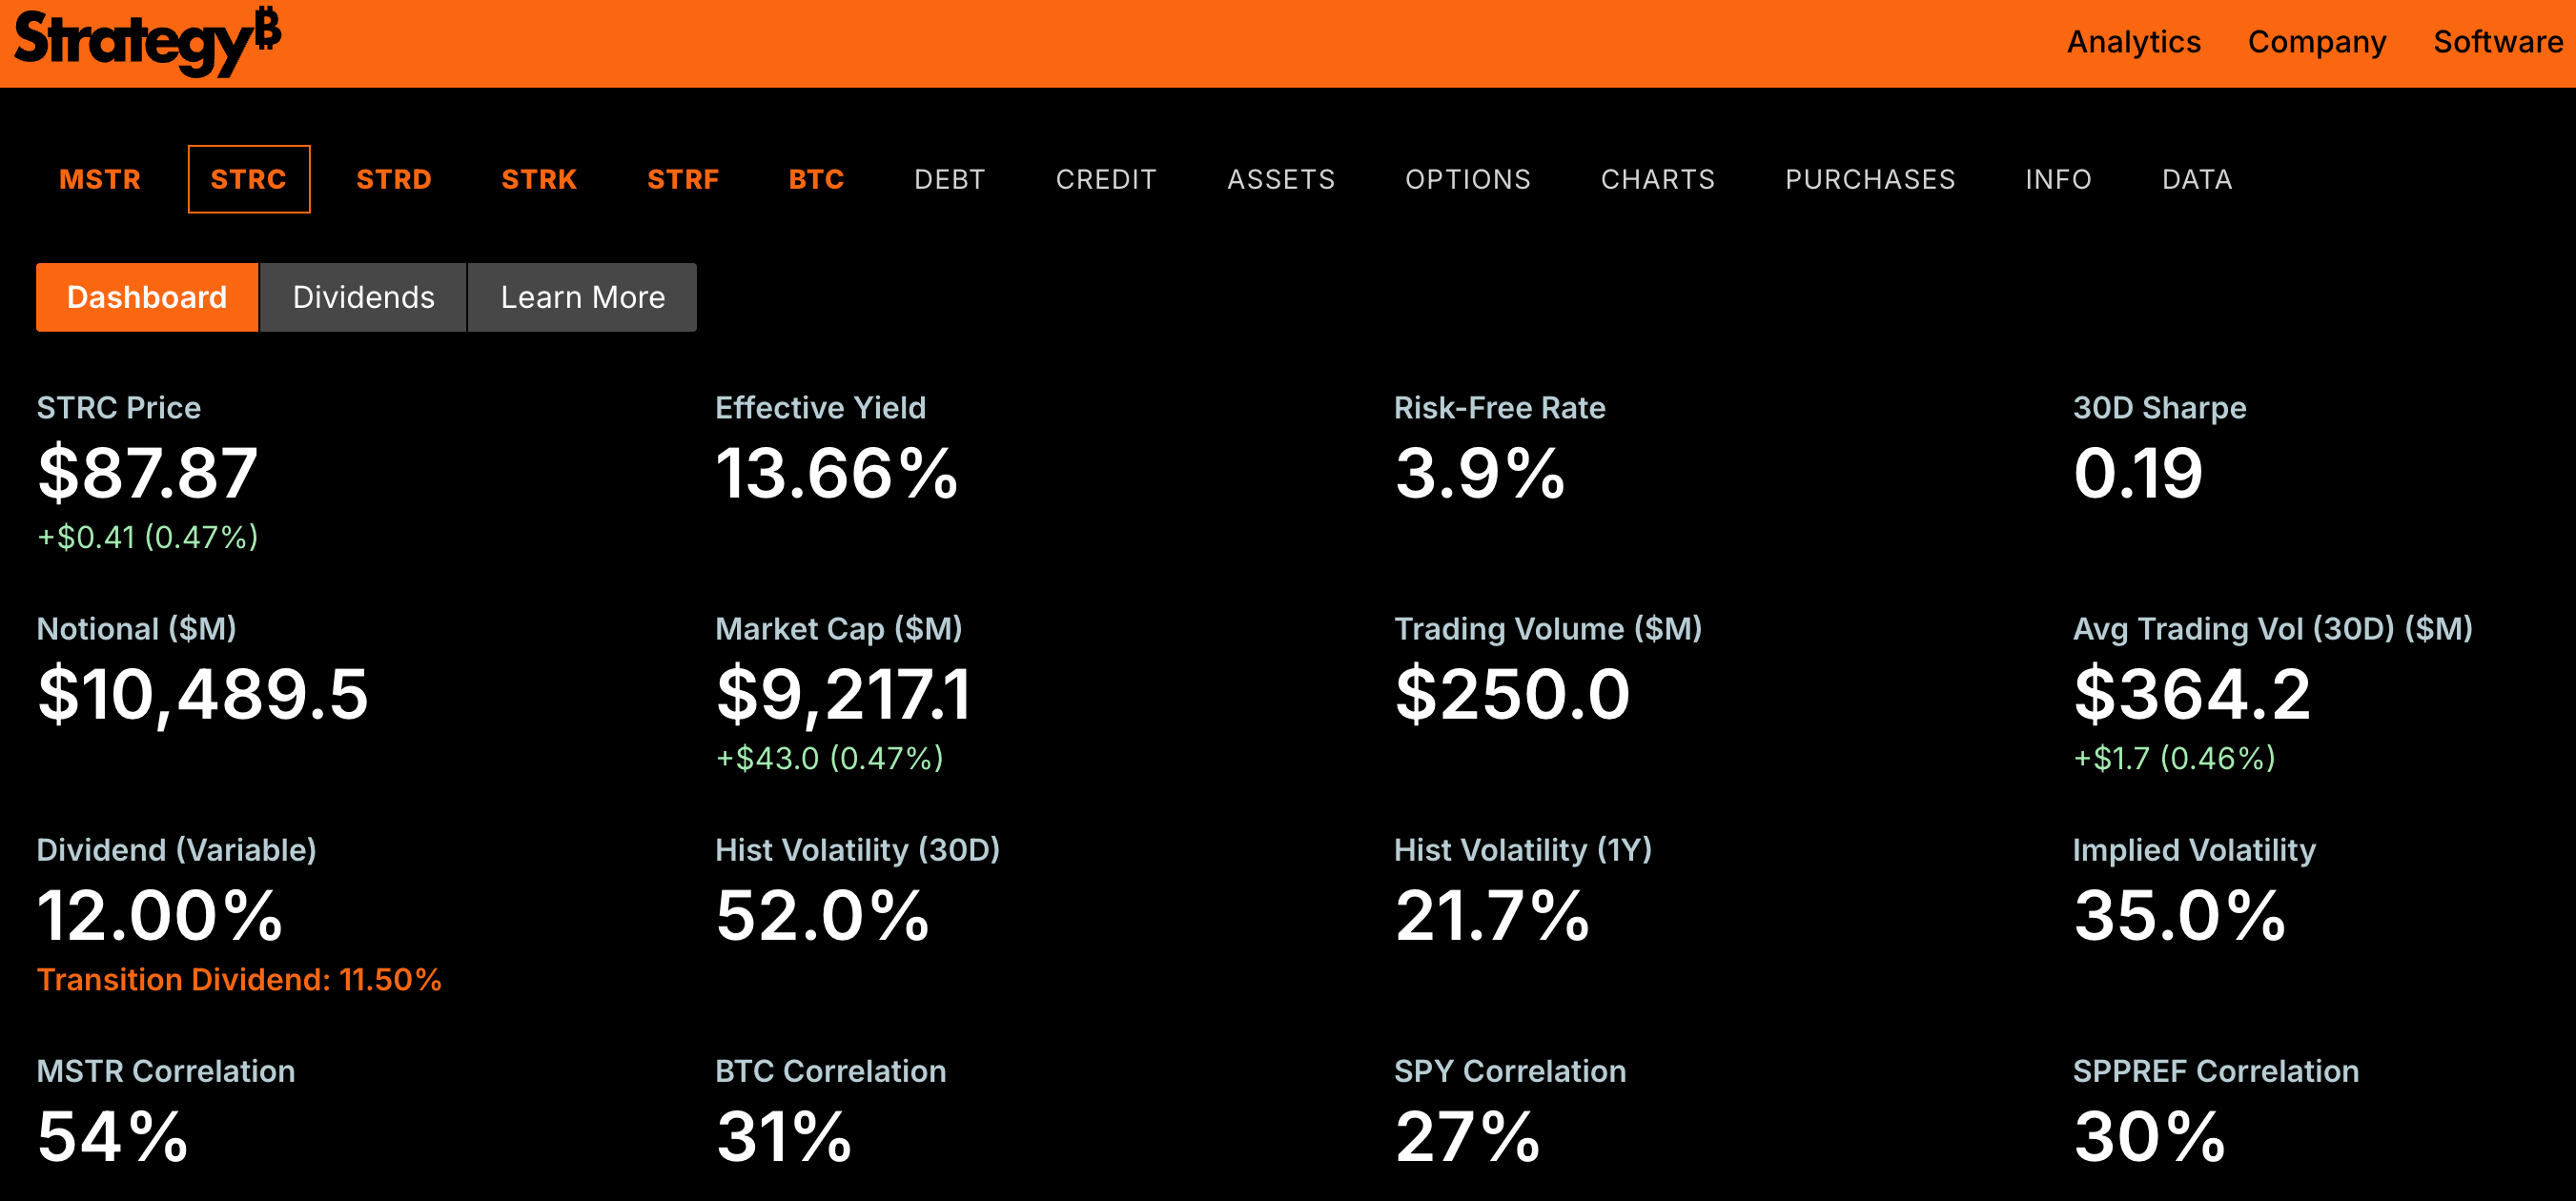
The deeper problem in this phase of the cycle is that losses have spread across more categories of market participants. On June 18, after already slipping below $95 earlier in the month, STRC, the preferred stock issued by Strategy, fell below $90 and closed at $89. That marked its lowest daily close since the IPO and its lowest dividend-adjusted close since last November. Then on June 26, STRC dropped to as low as $73 in pre-market trading, setting a new all-time low. At that point, the market focused on two issues: the June 30 ex-dividend date, under which eligible holders would receive a $0.48 dividend per share on July 15, and the monthly dividend rate reset. With the effective yield near 15% at the time, investors expected Strategy to raise the dividend rate from 11.50% to at least 12% or 12.50%.
Three days later, on June 29, Strategy announced a $1 billion digital credit securities repurchase plan and also introduced a board-approved “up to $1.25 billion BTC monetization plan.” As various funding initiatives progressed, the company’s U.S. dollar reserves rose to $2.55 billion, improving its ability to service preferred instruments such as STRC. That temporarily relieved the discount crisis, and STRC rebounded above $80, recently trading at $87.87. Even so, the stabilization of STRC did not offset the mark-to-market damage caused by continued declines in BTC and ETH.
On June 25, Bitcoin briefly fell to around $59,100, and the amount of BTC held at a loss climbed to 10.83 million coins, a new record and above the roughly 10.5 million BTC seen near prior bear-market lows. Long-term holders, defined here as investors holding for at least 155 days, were sitting on a record 14.8 million BTC. With total circulating supply around 20 million BTC, about 37% of those long-term holdings were underwater at that moment. The latest data show that long-term holdings have since grown further to 16.61 million BTC, while the average cost basis has declined to around $49,700.

Ethereum is showing similar stress. Data from June 26 indicated that ETH whales had fallen into loss territory for the first time since 2019. Even during the 2022 bear market, the largest whales holding more than 100,000 ETH remained profitable. Now, however, all three major whale cohorts show negative unrealized profit ratios: the 1,000 to 10,000 ETH cohort is at -0.26, the 10,000 to 100,000 ETH cohort at -0.21, and the over-100,000 ETH cohort at -0.05. This condition has persisted for weeks. Earlier, ETH’s market capitalization briefly dropped below $185 billion and was overtaken by USDT. After a rebound back above $1,700, ETH market cap has recovered to roughly $207 billion.
Capitulation signals and bottoming clues: which indicators matter most from here
On June 28, Bitcoin UTXO data showed that the ratio of loss-realized transactions to profit-realized transactions had fallen to the lowest level of the current bear cycle. That implies investors are entering a clearer capitulation phase. The last similar reading occurred during the deep mid-2023 bear market, when Bitcoin briefly traded near $26,000. Such readings often suggest that the market has undergone extensive stress and forced selling, but they do not automatically confirm an immediate reversal.

Based on the indicators cited in the article, there are several metrics worth tracking if investors want stronger confirmation that the bear market is ending. First is whether STRC can re-anchor closer to $100, which would indicate easing concerns around Strategy-related credit stress and financing pressure. Second is whether long-term holders of BTC and ETH can move back out of loss territory, reducing the incentive to sell into any rebound. Third is whether the Coinbase Bitcoin Premium Index can turn positive again. Based on the historical positive-premium range referenced in the article, BTC may need to rebound to around $77,000 for that to happen.
Additional cross-checks come from broader valuation and technical measures. According to Coinglass, the BTC four-year average price index fell to 0.95 between June 25 and June 30 as Bitcoin briefly moved below $59,000, then recovered toward 1 as BTC rebounded above $61,000. Meanwhile, the BTC 200-week moving average heatmap shows that since June 23, the market has remained below the 200-week average, and current prices are roughly in line with that long-term trend level. Historically, trading around or below this zone has often aligned with late-stage bear conditions, but on its own it still falls short of proving that a durable bottom is in place.
Timing and price targets from market participants: 7–8 months, late October, and the $42,000–$51,000 zone
There is still no market-wide consensus on the exact end date of this bear market. In late June, TrendResearch founder Yi Lihua said the current decline is the “third wave down since 10/11,” and argued that, based on wave theory and cyclical behavior, this may be the final major leg lower. Using Bitcoin’s peak of $126,000 as the reference point, a 60% decline would imply about $51,000, while a 66% decline would imply about $43,000. In his view, July to August could represent the final phase of the downturn and potentially the most attractive accumulation window of the next three years.

On June 25, Jiang Zhuoer, founder of Lebit Mining Pool, offered a more explicit bottom call. He predicted that this BTC bear market could bottom around October 31 this year at roughly $44,016. Incorporating the historical tendency for mNAV to bottom about six months before BTC price itself, he revised the likely bottoming window to October to December 2026, with a target range of $42,000 to $44,000. His framework is based on the mNAV of Strategy common stock MSTR, defined as the ratio of share price to BTC value per share. That ratio has fallen to 0.72, close to the prior-cycle low of 0.7 reached on May 11, 2022.
However, Jiang also emphasized that an mNAV bottom does not mean BTC price bottoms at the same time. In the previous cycle, mNAV reached 0.7 on May 11, 2022, when BTC was trading at $31,017. Bitcoin’s actual price bottom did not arrive until November 21, 2022, when BTC hit $15,476 and mNAV had already rebounded to 1.2. The lag between the two was about six months. Taken together, the data in this article suggest that without a strong external bullish catalyst, the current bear market may continue for at least another two to three months. That would make late September to early October the key window for judging whether BTC can mount a meaningful recovery.