
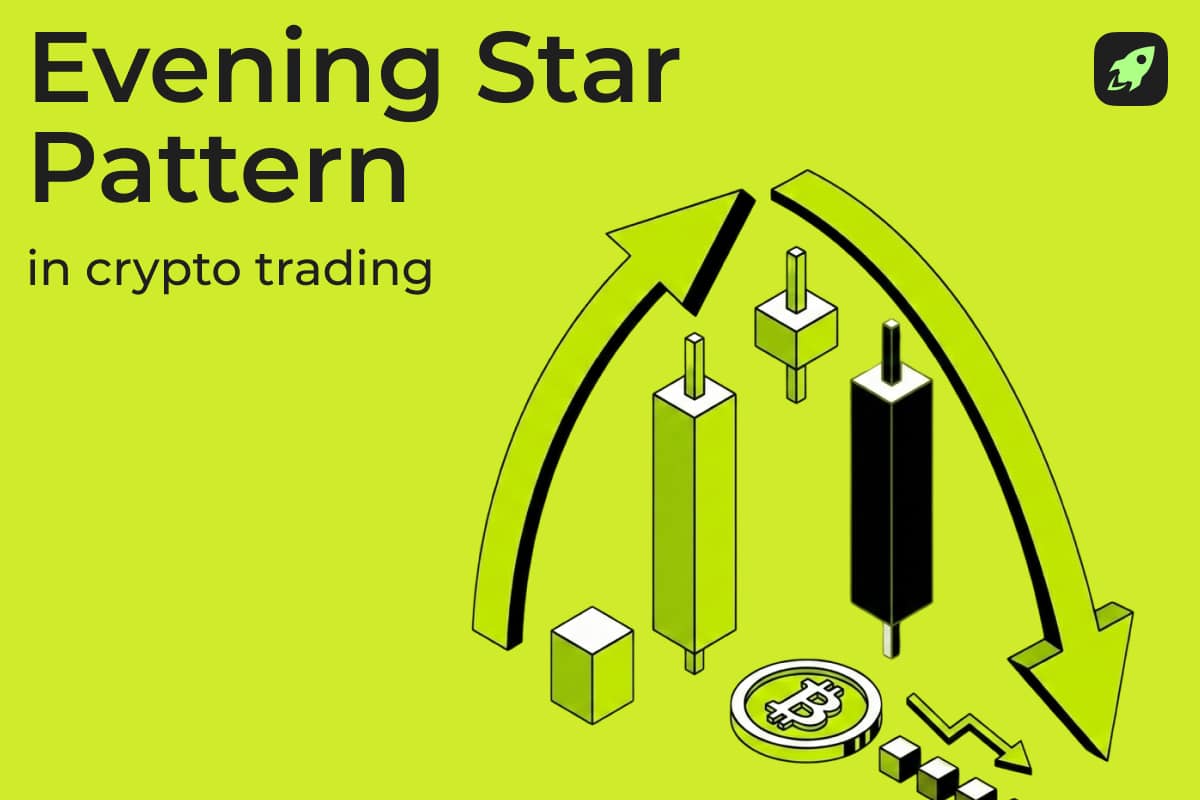
The evening star candlestick pattern is a bearish reversal formation that emerges after a clear uptrend. It consists of three consecutive candles that tell a story: strong buying, hesitation, and then selling pressure. In the volatile crypto market, recognizing this shift can help traders adjust positions before a deeper decline occurs.
Three Candles: Structure and Meaning
Candle 1 (Bullish): A large green candle that continues the uptrend. It closes well above its open, showing that buyers remain in control. However, after a prolonged rally, this strong move can also signal that the price may be stretched, creating the setup for a potential peak.
Candle 2 (Star): A small-bodied candle — can be a doji, spinning top, or a tiny green/red candle. Its key feature is indecision: neither buyers nor sellers dominate. The small body relative to the first candle shows that upward momentum has stalled. This candle alone does not confirm a reversal; it only warns that the bulls are losing steam.
Candle 3 (Bearish): A large red candle that confirms the reversal. Under the textbook definition, it must close below the midpoint of the first candle's real body. A strong close below that level means sellers have taken back significant ground. If the third candle is weak (small body or shallow close), the pattern is less reliable.
How to Identify an Evening Star on a Crypto Chart
First, check the broader trend: there must be a visible rally with higher highs and higher lows. Then look for the three candles in sequence. The star candle should have a noticeably smaller body than the first. Volume can add confirmation — the third candle should ideally trade heavier than the first, indicating real selling pressure. Resistance levels, overbought RSI readings, or bearish divergence strengthen the case. In crypto, gaps between candles are common (due to 24/7 trading) and not required for a valid pattern.
Trading Applications and Limitations
Traders use the evening star as a warning to exit long positions, a signal to avoid new buys, or a setup for a short trade after confirmation (waiting for the third candle to close). But false signals occur, especially in volatile low-timeframe charts. Reliability improves on daily or weekly timeframes, when combined with trendline breaks or support/resistance. The pattern is evidence of a possible shift, not a guarantee. Always manage risk with stop-losses and position sizing.
In essence, the evening star is a powerful tool — but its value comes from context, not the candles alone.