

Fed decision becomes the market’s main near-term variable
This week’s Federal Reserve rate decision is described as the key driver for crypto markets, with expectations for a clear pickup in short-term volatility. The analysis focuses on Bitcoin and HYPE, arguing that both assets have reached important technical areas ahead of the policy event.
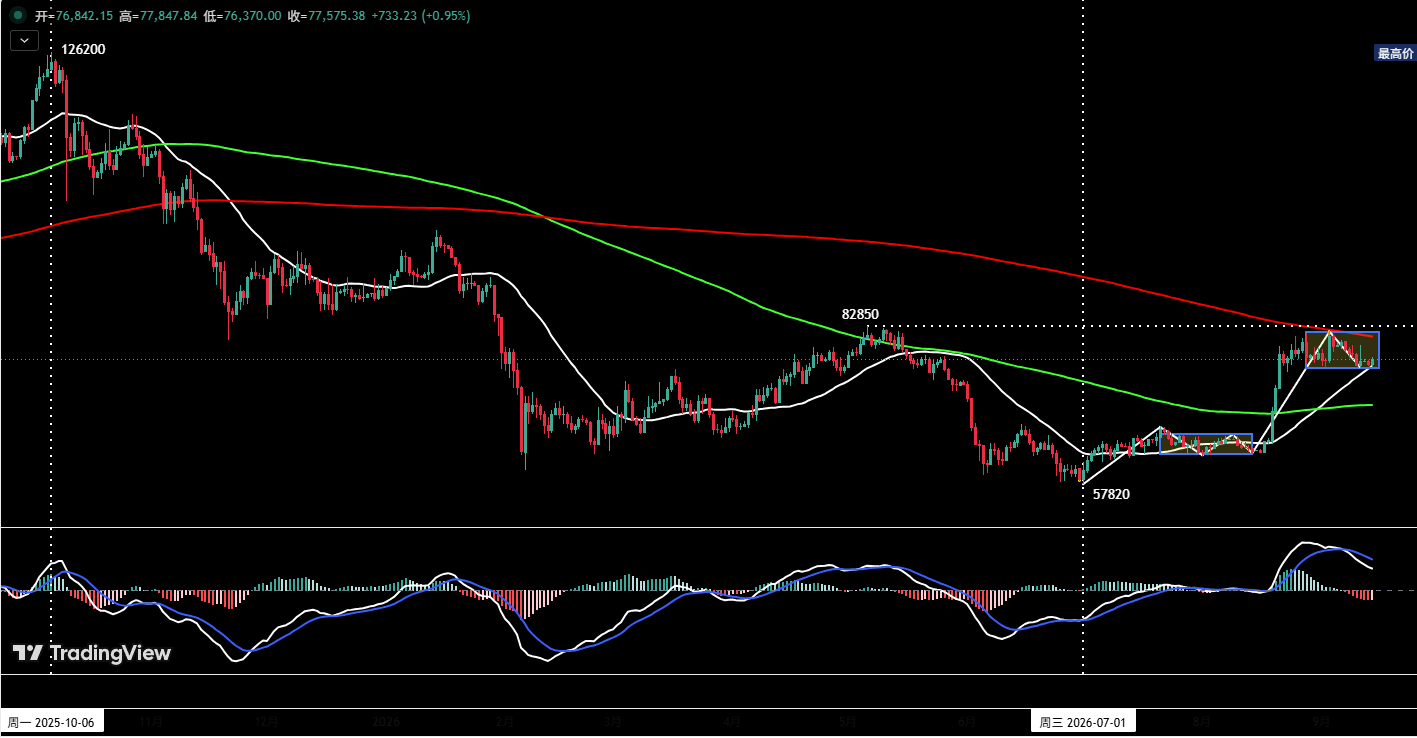
For BTC, the rebound that began from the July 1 low has entered a stage defined by range trading and center validation, with bulls and bears fighting around the 364-day moving average. For HYPE, the report says a multi-leg advance on the 4-hour chart has already shifted into a pullback, while signs of a top have become more visible near the prior high.
BTC daily structure: price still trapped between support and resistance
The report revisits an earlier call on BTC’s rebound from the July 1 low of $57,820. That view held that Bitcoin would stay in a box range between $75,500 and $82,850 while building a second upward center on the daily chart. According to the article, last week’s price action stayed inside that range, and the development of the structure largely matched that prior view.
From a broader perspective, BTC has remained under pressure since topping at $126,200 in October 2025. The article says the adjustment has lasted nearly 345 trading days. On Oct. 29, 2025, BTC first broke below the 182-day moving average, and two weeks later it also lost the 364-day moving average. The 364-day line, or the 52-week moving average, is treated in the piece as the dividing line between bull and bear conditions. A decisive break below it is used to define the start of a deep bear-market correction.
As of now, the report says BTC has traded below the 364-day moving average for about 307 trading days, meaning the medium- to long-term bearish structure has not yet shown a reversal signal. At the same time, it points to one positive change: after nearly 300 trading days, BTC climbed back above the 182-day moving average on Aug. 19 and then made its first upward test of the 364-day line on Sept. 3.
Two paths laid out for the days around the Fed decision
In the near term, the article says BTC broke above the 182-day moving average on Aug. 19 with higher volume, at roughly $68,940, before rallying toward the 364-day moving average near $82,200 and then stalling. That sequence pushed the market into a high-range consolidation phase.
The setup is described as one with overhead resistance and underlying support. Resistance is defined by the 364-day moving average and the key level at $82,850. Support comes from the 30-day moving average and the lower edge of the box near $75,500.
The report then sketches out two scenarios for the second half of the week:
- Path one: BTC keeps rebounding into the decision, then sees a fast upward move after the rate decision is released, potentially even breaking above both resistance layers for a short time. Even so, the article warns against chasing that move because upside may be limited and a reversal after the spike remains possible.
- Path two: BTC trades sideways or slips modestly before the decision while support at the box floor and the 30-day moving average holds. Once the decision is out, price could drop quickly and even pierce support on an intraday basis. The article says traders should avoid chasing the downside there as well, and instead watch whether BTC rebounds from the 182-day moving average and retests the recent high at $82,500.
BTC levels and trading plan for the week
The report’s core weekly view for Bitcoin is straightforward: stay mostly on the sidelines in the first half of the week, then make trading decisions after the Fed outcome is out and price location becomes clearer.
Key resistance levels
- First resistance zone: $81,700 to $82,850
- Second resistance zone: $84,500 to $86,500
- Third resistance zone: $90,000
Key support levels
- First support zone: $73,500 to $75,000
- Second support zone: $67,300 to $69,100
Positioning and execution
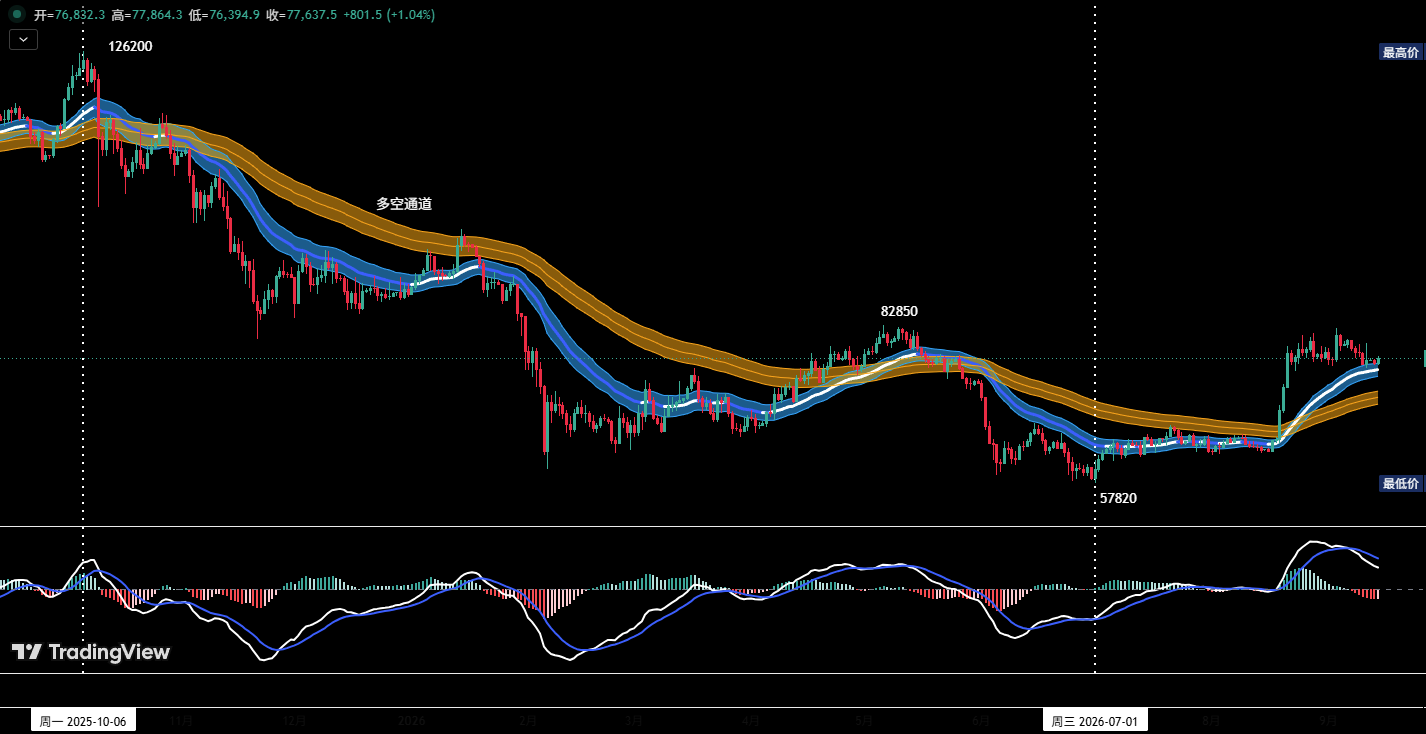
For medium-term positioning, the article refers to a position-monitoring model and says BTC has already broken through a bull-bear channel, changing the short-term structure. Even so, that breakout has not yet been confirmed by a pullback retest. Because of that, the suggested medium-term stance remains flat, with no position on.
For short-term trading, the piece suggests using a 30% position size, setting stop-loss levels in advance and looking for spread-capture opportunities around the stated support and resistance zones, using 30-minute or 60-minute charts as the operating timeframe.
It also presents two tactical plans for the period after the Fed decision:
- Plan A: If BTC falls back but holds above the second major support area after the decision, and if a clear stabilization pattern appears while the quantitative model flashes a bottom signal, traders may consider opening a long position of around 30%. The article says an initial stop-loss should be set, and profit-taking can be done gradually near major resistance if model signals align.
- Plan B: If BTC rises into the $82,850 to $84,500 zone after the decision, then shows a clear rejection while the quantitative model issues a top signal, traders may consider opening a short position of around 30%. An initial stop-loss is again required, and positions can be reduced gradually as price pulls back toward major support.
HYPE 4-hour structure points to a completed rally near $89.76
The article applies the same Chan-theory framework to HYPE and breaks down the rebound that started from the Aug. 2 low of $51.11. On the 4-hour chart, that advance is described as a 14-leg upward structure running from segment (72-73) to segment (85-86).
How the two upward centers were formed
The first upward center, labeled Center A, is built from the overlapping price ranges in segments (73-74), (74-75) and (75-76). In that structure, segment (72-73) is the entry leg and segment (78-79) is the exit leg.
The second upward center, Center B, is formed from the overlap among segments (79-80), (80-81) and (81-82), with segment (78-79) serving as the entry leg and segment (82-83) as the exit leg.
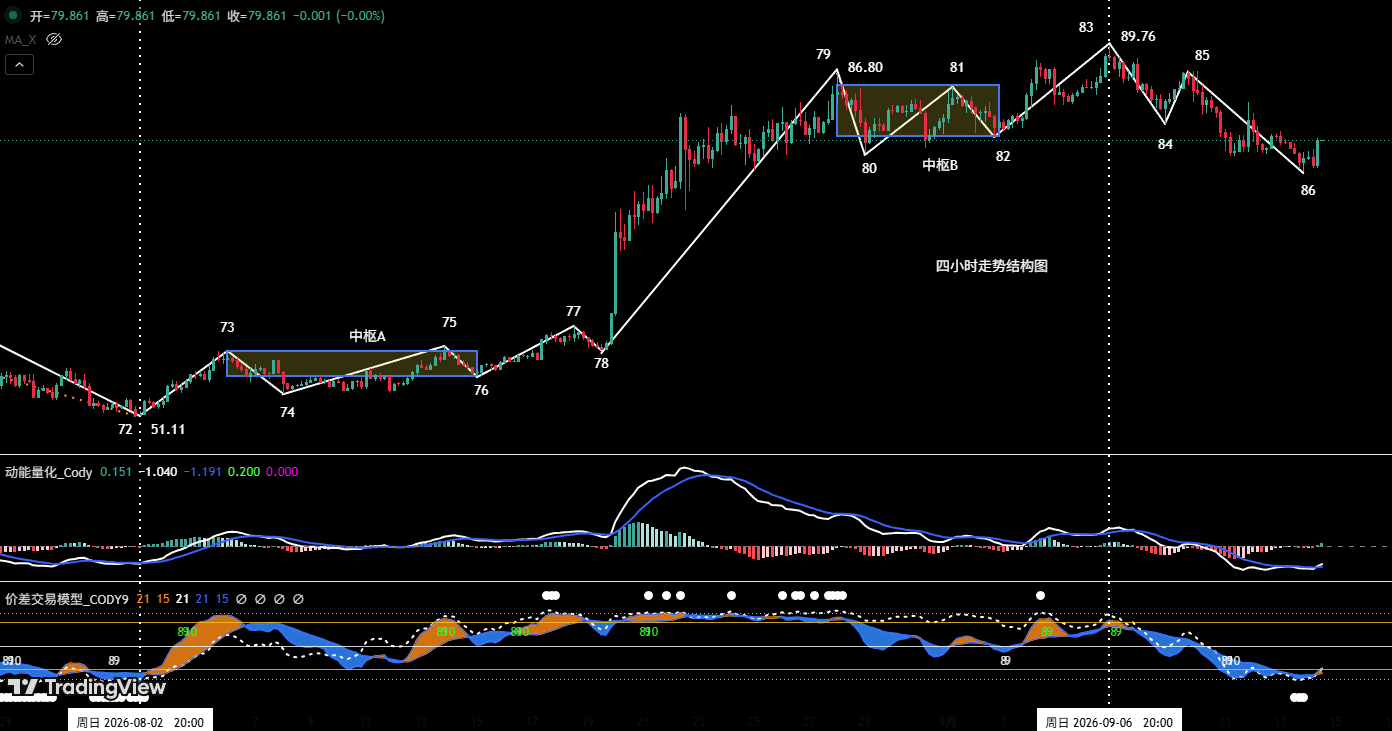
The key judgment comes from Center B’s exit leg. The article says HYPE set a record high of $89.76 during segment (82-83), then pulled back sharply. When that exit leg is compared with the entry leg, (78-79), the report sees a clear momentum divergence. Based on that, it concludes that the daily-level rally that began at $51.11 on Aug. 2 most likely ended around $89.76.
After that top, the market moved into a three-leg correction made up of segments (83-84), (84-85) and (85-86). The article notes that the ending point of segment (85-86) already fell below the key $80 support level, and that the strength of this correction was noticeably greater than the earlier pullback in segment (83-84). In the report’s framework, those features reinforce the view that the prior rebound has ended and a downward adjustment is underway.
HYPE weekly levels and short-term stance
For this week, the report lists resistance near $90 for HYPE. It identifies the first support zone at $76 to $77 and a second support zone at $71.5 to $73.
The main point to watch is whether HYPE can stabilize around $77 and how strong any rebound from that area turns out to be. According to the article, the strength of that bounce will be the key variable in judging how long the current adjustment cycle may last.
On positioning, the report says earlier long positions built in the $50 to $52 range under the prior plan were fully closed near $80 last week. With the market now approaching a critical rate-decision window, the suggested stance for this week is to stay flat and wait.
Risk controls and disclaimer
The article closes with a set of risk-management rules:
- Set an initial stop-loss immediately after opening a position.
- When profit reaches 1%, move the stop-loss to the entry price to protect principal.
- When profit reaches 2%, move the stop-loss to lock in a 1% gain.
- After that, for every additional 1% in profit, move the stop-loss higher by 1% as well.
The author also says market conditions can change quickly and all analysis and trading plans need to be adjusted dynamically. The views, models and strategies in the piece are described as personal technical analysis and part of a personal trading log only, not investment advice or a basis for trading decisions. The article ends with a warning that markets carry risk and that readers should act with caution.