
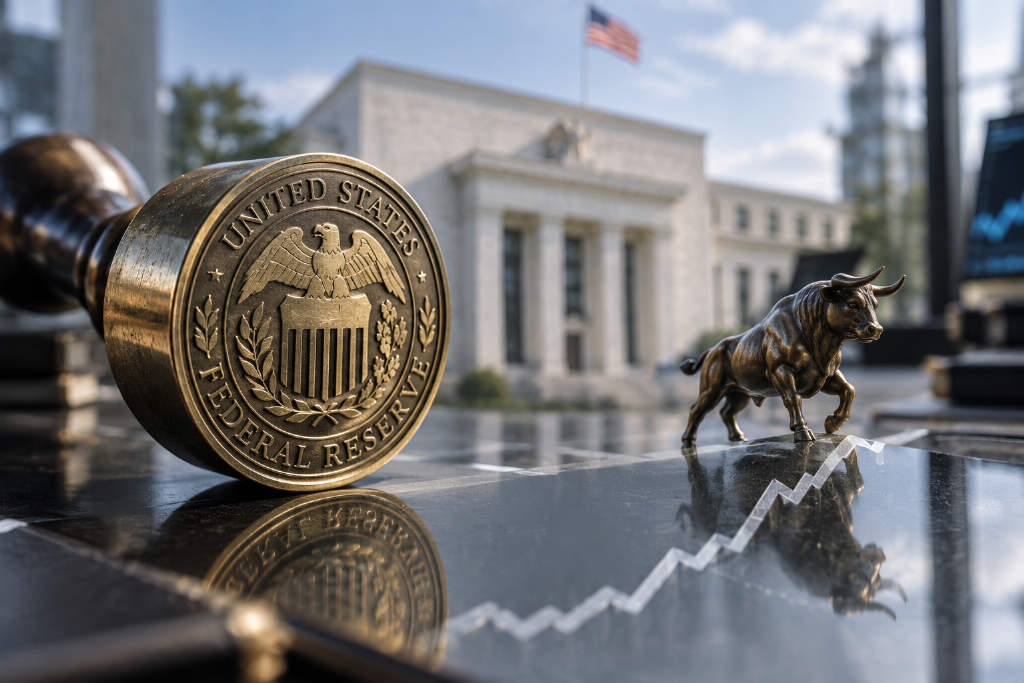
The Federal Reserve just raised rates, and U.S. stocks still pushed back to record territory.
On Sept. 16, the Fed lifted its target range for the federal funds rate by 25 basis points to 3.75%-4.00%. In its FOMC statement, the central bank said U.S. economic activity was expanding at a “solid pace,” household spending remained resilient, capital investment was strong, and inflation was still elevated.
Less than a week later, tech stocks regained momentum. On Sept. 22, the Nasdaq Composite set another all-time high. Reuters tied that rebound to gains in technology shares, a renewed AI trade, and easing oil prices.
At first glance, the mix looks contradictory. Tighter monetary policy is usually read as a headwind for valuations, while record highs often trigger concern that upside may be running out.
Phil Rosen, writing in Opening Bell Daily, argued that neither signal should be read in isolation. A rate hike and a market high only make sense when placed in the economic setting in which they occur.
Rate hikes are not a simple sell signal
Opening Bell cited data compiled by Charlie Bilello, chief market strategist at Creative Planning, showing that since 1982 the S&P 500 has gained an average of 14.9% in the 12 months after Fed rate hikes. After rate cuts, the average 12-month gain was 11.2%.
That runs against one of the most common market instincts. In a basic valuation framework, falling rates lower financing costs and reduce discount rates applied to future cash flows, which should support equities. Higher rates would point the other way.
Rosen’s point was that looking only at the policy move misses the more important question: why is the Fed hiking or cutting at that moment?
In many cases, the Fed is able to raise rates because the economy still has some capacity to absorb tighter policy. Corporate earnings, employment, and consumer spending may still be holding up, giving the central bank room to keep pressure on inflation.
Rate cuts, by contrast, often arrive in a very different macro backdrop, one marked by slower growth, worsening labor conditions, stress in the financial system, or rising recession risk.
That does not mean hikes cause stocks to rise. Rosen’s argument is narrower than that. Monetary policy is endogenous: rate decisions affect the economy ahead, but they also reflect the state of the economy at the time the decision is made.
If investors ignore the business cycle and treat every hike as automatically bearish for equities, they may be reading the causality backward.
The key question is the economy behind the hike
That framework matters in the current setup as well.
In this latest move, the Fed’s own description of the economy was not weak. The statement said the U.S. economy was still expanding at a solid pace, domestic spending remained resilient, productivity growth was strong, capital investment was steady, and job growth was broadly in line with labor supply. Inflation, at the same time, remained above target.
On that reading, this hike did not come in the middle of a clearly visible recession. It came while growth was still showing resilience and policymakers were continuing to respond to inflation.
That is why the phrase “the Fed hiked” is not enough on its own to map out the next move in stocks.
The more important issue is whether corporate profits, consumer spending, and employment can continue to absorb tighter financial conditions as rates stay elevated.
If they can, a hike by itself may not be enough to end the advance. If higher rates start to weigh clearly on demand and earnings, the usefulness of long-run average return data for the present market becomes weaker.
Record highs are not automatic exit points either
The article applies the same reasoning to another common concern: if the market is already at a record high, is it too late to buy?
Opening Bell, citing FactSet data, said that since 1950, buying the S&P 500 at an all-time high has been followed by an average 12-month return of about 9.5%. Buying on other trading days led to an average one-year return of about 9.3%.
The longer-term comparison in the article points in the same direction. Over five years, the average return after buying at an all-time high was 51.8%, versus 49.0% for purchases made on other trading days.
Separate research produced a similar result. Vanguard, using FactSet and Morningstar Direct data, found that as of September 2025, buying the S&P index at a record high also led to an average one-year return of 9.5%, compared with about 9.2% on other trading days. Across three-year and five-year periods, average cumulative returns after buying at record highs did not materially lag either.
The two data sets differ by 0.1 percentage point in the figure for “other trading days.” The article said that may reflect differences in sample end dates and data handling, but the overall direction is the same.
The more important point is not that record highs delivered a few tenths of a percentage point more in average return. It is that record highs themselves did not show a stable negative forecasting signal.
Rosen’s explanation is straightforward: market records often come in clusters. In a sustained uptrend, indexes can keep printing new highs, and the first, fifth, or even tenth record in that sequence does not by itself tell investors when the bull market will end.
Put differently, “prices are already high” and “prices are about to fall” are not the same claim. What the historical data suggests is simply that being at an all-time high is not, on its own, evidence that future returns must deteriorate.
What matters next is whether the macro backdrop changes
From that perspective, the market’s next direction will not be decided by the labels “Fed hike” or “Nasdaq at a new high.” The real issue is whether the macro conditions supporting those facts begin to shift.
One area to watch is whether U.S. corporate earnings, consumer spending, and employment can remain resilient. If the real economy continues to tolerate higher rates, the historical explanation that hikes often occur in stronger phases of the cycle still holds.
Another is whether tighter policy begins to show more visible lagged effects. If rate-sensitive sectors such as housing and autos weaken further and that weakness feeds into consumption, jobs, and corporate profits, the meaning of this hike changes.
The article also cautions against using long-run averages mechanically. The rate-hike cycles since 1982 did not share the same inflation backdrop, valuation levels, earnings environment, or financial conditions. Average gains after buying at record highs in the past cannot be turned into a promise of similar returns over the next 12 months.
So the historical data is better used to reject an overly simple rule than to create a new trading rule. A Fed hike does not inherently mean stocks should fall, and an all-time high does not inherently mean the rally is over.
The basic question remains the same: can the economy and corporate earnings continue to support current prices?