
The Federal Reserve raised its target range for the federal funds rate by 25 basis points to 3.75%-4.00% on Sept. 16. Days later, U.S. technology stocks regained momentum, and the Nasdaq Composite set another record high on Sept. 22. Put side by side, tighter monetary policy and a fresh market high look like a contradictory pair of signals.
But a MarsBit report, citing Phil Rosen in Opening Bell Daily, says neither signal should be read on its own. Historical data in the piece suggests that a Fed hike, by itself, has not been a reliable reason to turn bearish on equities, and neither has an index reaching a new high.
Fed hike followed quickly by another Nasdaq record
According to the report, the Fed lifted the target range by 25 basis points on Sept. 16 to 3.75%-4.00%. In its statement, the Federal Open Market Committee said U.S. economic activity was still expanding at a “solid pace,” domestic spending remained resilient, capital investment was strong, and inflation was still elevated.
Less than a week later, tech shares turned higher again. On Sept. 22, the Nasdaq Composite hit a fresh all-time high. Reuters tied that rebound to several factors, including strength in technology stocks, renewed AI trading enthusiasm, and lower oil prices.
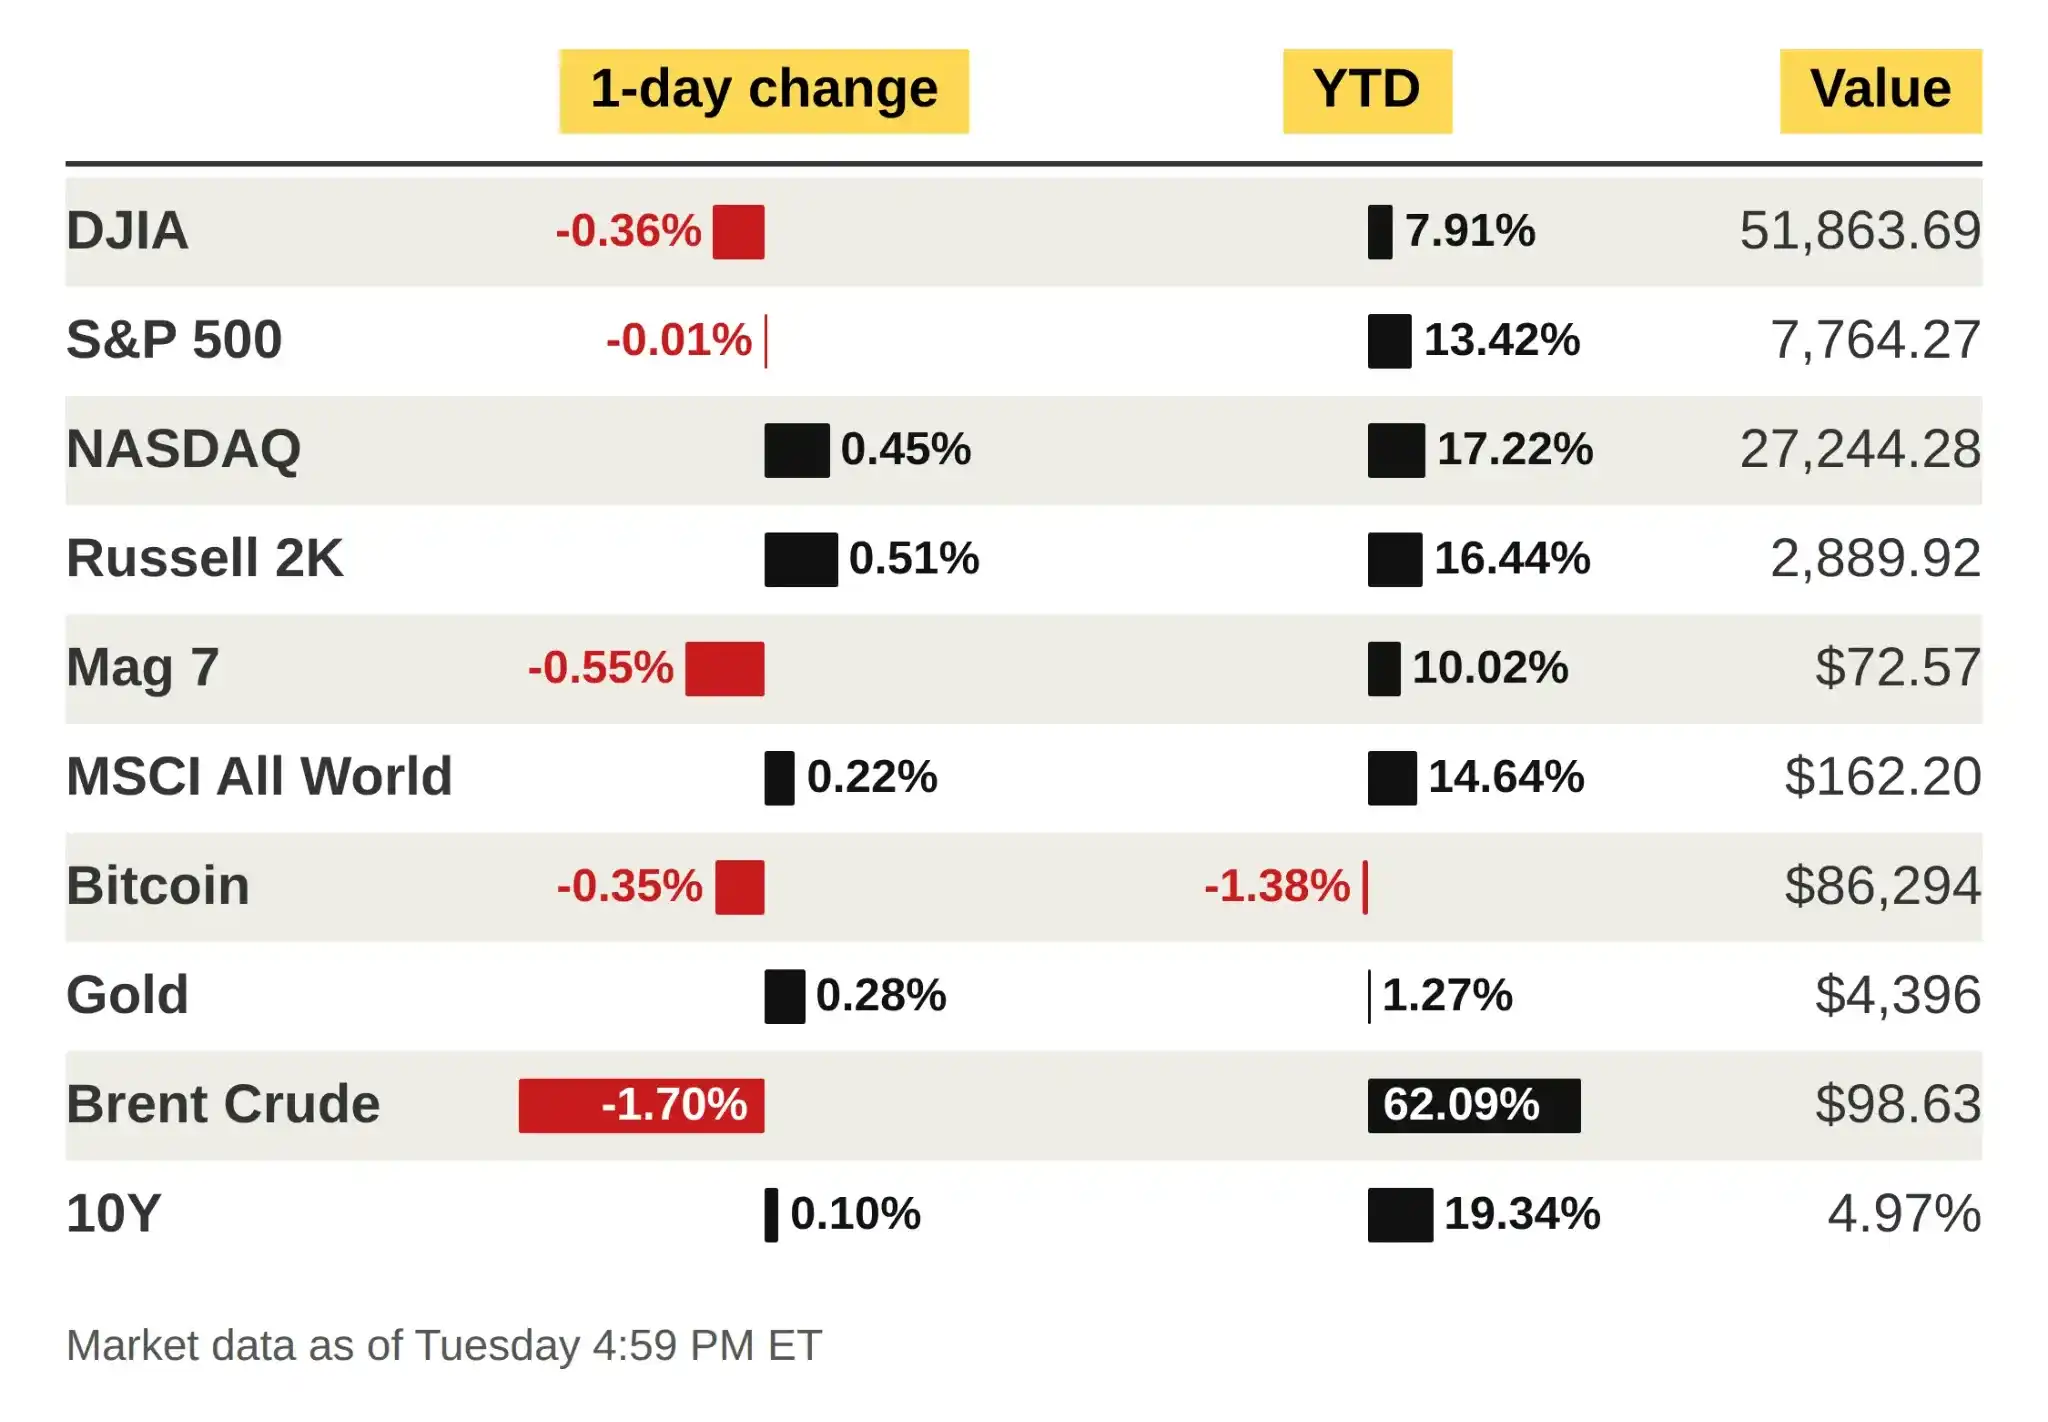
Opening Bell Daily’s snapshot of major asset performance for Sept. 22 showed the Nasdaq up 0.45% on the day and 17.22% for the year.
Since 1982, average 12-month returns after hikes have topped those after cuts
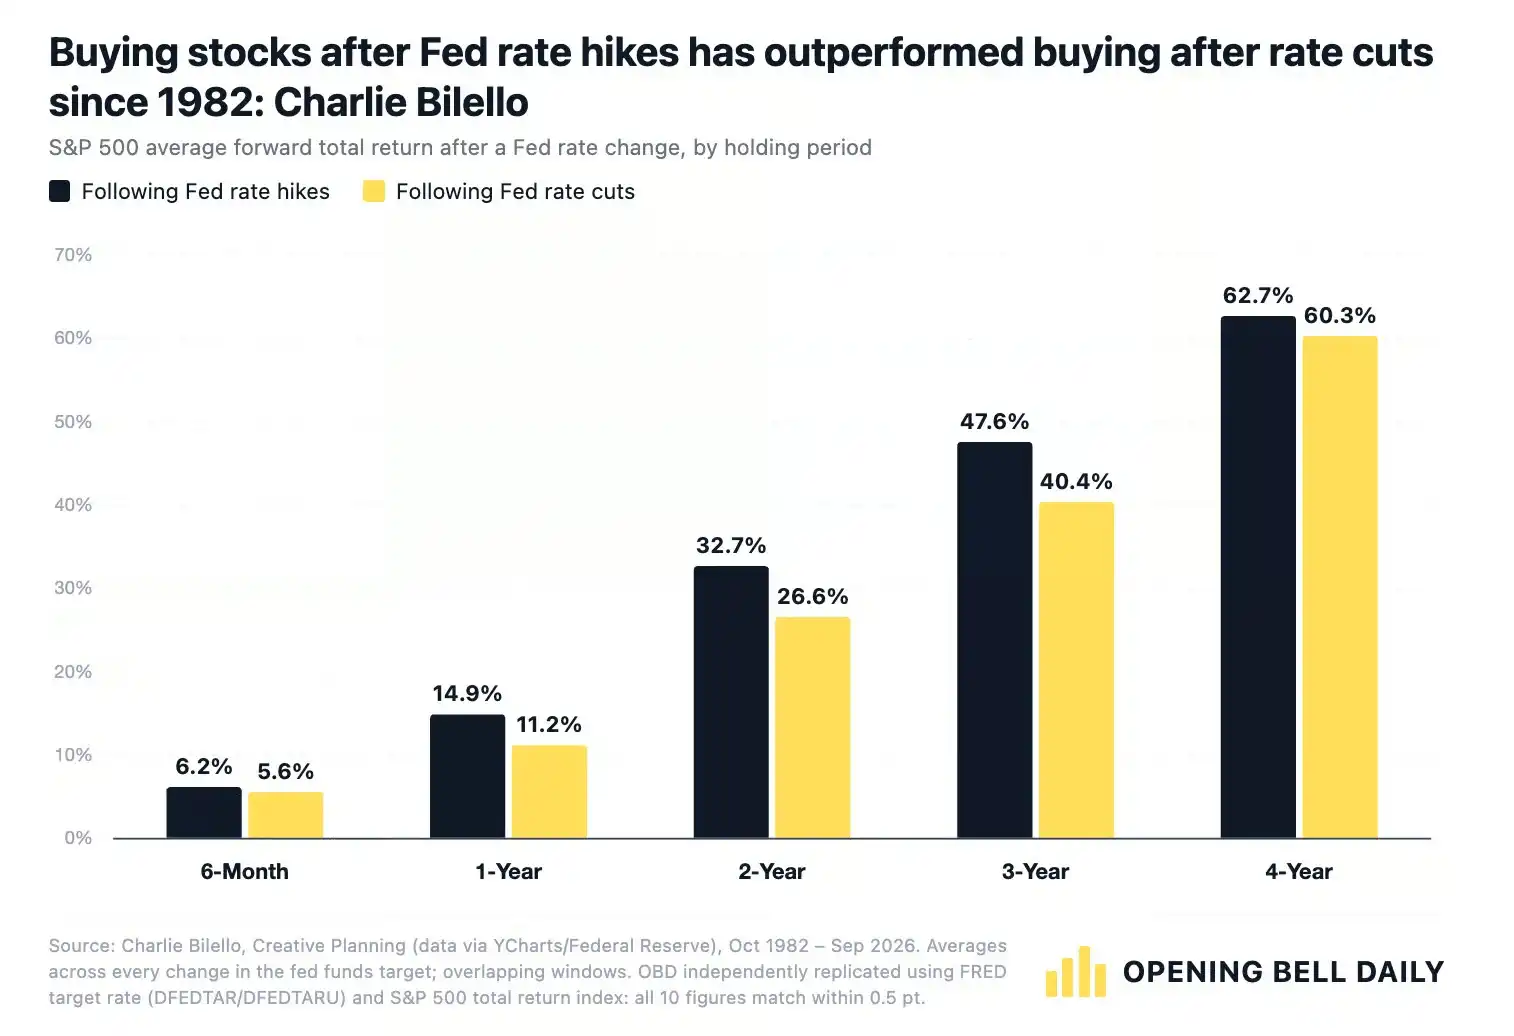
The article cites data compiled by Charlie Bilello, chief market strategist at Creative Planning. Since 1982, the S&P 500 has gained an average of 14.9% in the 12 months following a Fed rate hike, compared with an average gain of 11.2% in the 12 months after a rate cut.
That runs against a common market instinct. In a simple valuation framework, lower rates reduce financing costs and lower discount rates on future cash flows, which should support equities. Higher rates would suggest the opposite.
Rosen’s point is that focusing only on the policy move misses the more important question: why is the Fed hiking or cutting at that moment?
In the article’s framing, the Fed is often able to raise rates when the economy still has some capacity to absorb tighter conditions. Corporate earnings, employment, and consumer spending may still be holding up, giving policymakers room to push against inflation. Rate cuts, by contrast, often arrive in a weaker macro setting, when growth is slowing, the labor market is deteriorating, the financial system is under pressure, or recession risks are rising.
That is why Rosen’s core argument is not that rate hikes cause stocks to rise. It is that monetary policy is endogenous: rate decisions influence the economy ahead, but they also reflect the economy’s current condition. Ignore the cycle, and it becomes easy to reverse cause and effect.
The key question is the economic backdrop behind the hike
The report says that logic matters even more in the current setting. What investors need to assess is not the direction of rates in isolation, but the economic state behind this latest move.
In its latest statement, the Fed described the U.S. economy as still expanding solidly, with resilient domestic spending, strong productivity growth, steady capital investment, and job growth broadly aligned with labor supply, while inflation remained above target.
That suggests, at least in the Fed’s own assessment, that this hike did not come in the middle of an already obvious recession. The move was presented more as a continued response to inflation while growth still showed resilience.
On that basis, the article argues that seeing the words “Fed hike” is not enough to infer the next move in stocks. The more important issue is whether corporate earnings, household spending, and employment can continue to absorb tighter financial conditions while rates stay elevated.
If they can, a hike alone may not be enough to end the rally. If high rates begin to weigh clearly on demand and profits, the historical averages become less useful in explaining the current market.
All-time highs have not been a consistent sell signal either
The same framework applies to another common concern: whether investors should still buy when the market is already at a record high.
Opening Bell Daily, citing FactSet data, said that since 1950, buying the S&P 500 at an all-time high has produced an average 12-month return of about 9.5%. Buying on other trading days produced an average one-year return of about 9.3%.
Separate data pointed in a similar direction. Vanguard, using FactSet and Morningstar Direct data, found that as of September 2025, the average one-year return after buying the S&P at an all-time high was also 9.5%, versus about 9.2% on other trading days. On three-year and five-year horizons, average cumulative returns after buying at record highs also did not materially lag.
The report notes that the two datasets differ by 0.1 percentage point in the “other trading days” figure, which may reflect different sample end dates or data treatment, but the overall message is the same.
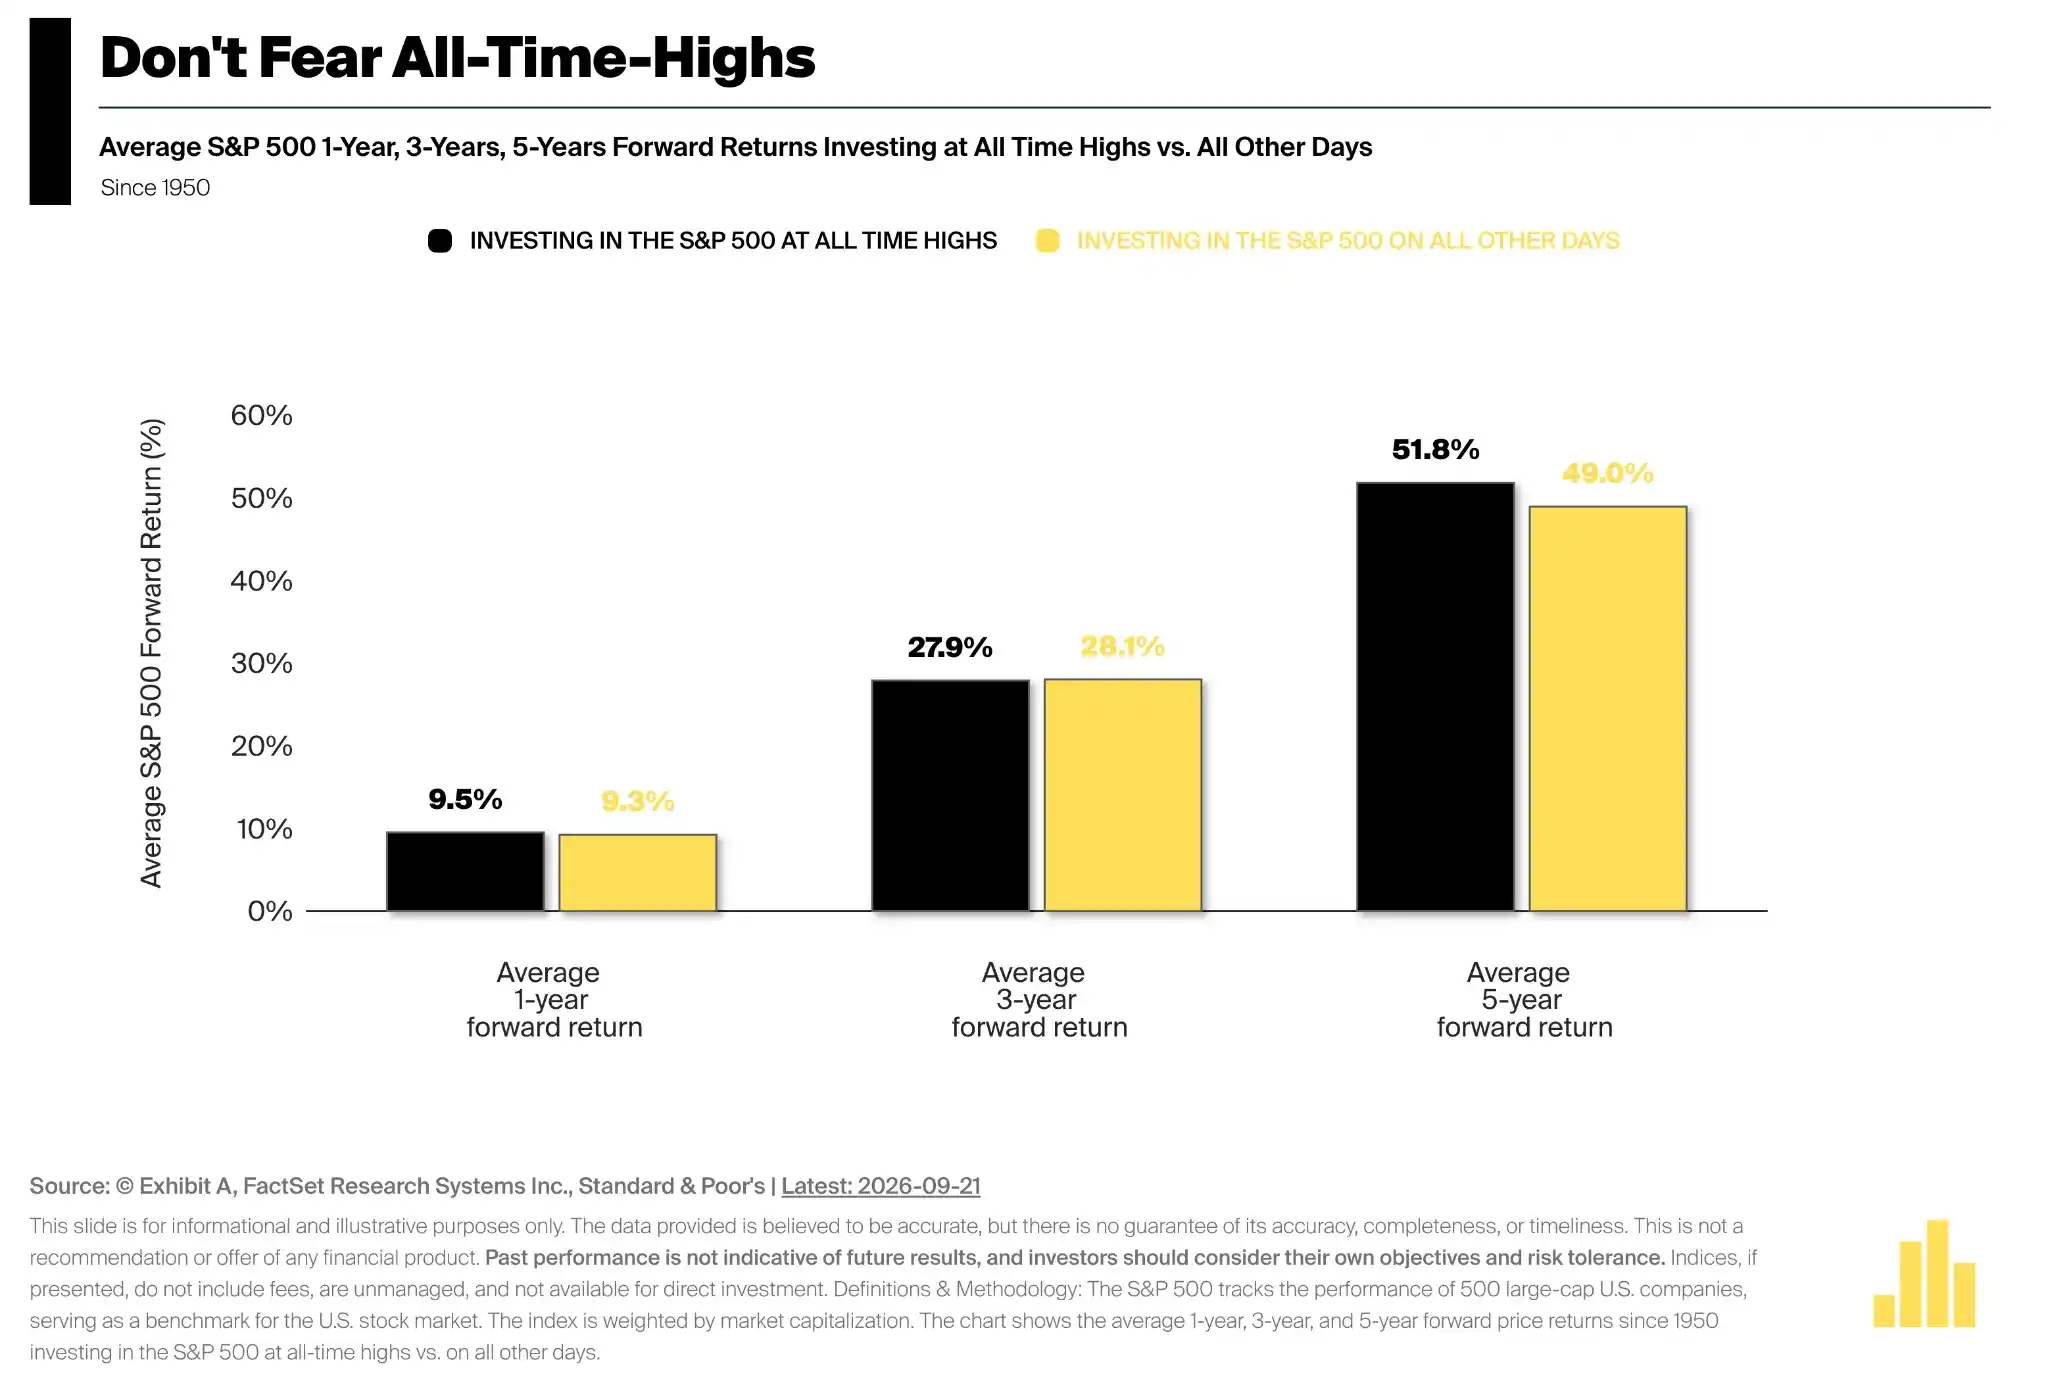
Opening Bell Daily also cited longer-horizon figures: since 1950, the average forward return after buying at an S&P 500 all-time high was 9.5% over one year and 51.8% over five years, compared with 9.3% and 49.0% when buying on other trading days.
The article says the real takeaway is not that record highs outperform by a few tenths of a percentage point. It is that all-time highs themselves have not shown stable negative predictive power.
Rosen’s explanation is straightforward: market records often come in clusters. In a sustained uptrend, indexes can keep setting new highs, and the first, fifth, or tenth new high does not by itself tell investors when a bull market will end.
In other words, “prices are already high” is not the same judgment as “prices are about to fall.” Historical data, at most, suggests that being at a record level is not enough on its own to prove that future returns will deteriorate.
What to watch next: earnings, spending, jobs, and lagged tightening effects
From that perspective, the report says the most important variables for U.S. equities are not the static facts that the Fed has hiked or that the Nasdaq has reached another high. What matters is whether the macro conditions supporting those facts begin to change.
On one side, investors need to watch whether U.S. corporate earnings, consumer spending, and employment remain resilient. If the real economy can still handle higher rates, the historical explanation that hikes often occur during relatively stronger phases of the cycle still holds.
On the other side, the lagged effects of tighter policy also need close attention. If rate-sensitive sectors such as housing and autos weaken further and that weakness spreads into consumption, employment, and corporate profits, the meaning of this hike changes.
The article also cautions against using historical averages too mechanically. Hiking cycles since 1982 have unfolded under different inflation levels, valuations, earnings conditions, and financial settings. Average returns after buying at record highs in the past cannot be used to conclude that the next 12 months will necessarily look similar.
Its conclusion is narrower than a trading call. The data is more useful for rejecting an overly simple rule than for offering a new source of certainty: a rate hike does not automatically mean U.S. stocks should fall, and a record high does not automatically mean the rally is over. The next phase still depends on the same basic question — whether the economy and earnings can continue to support current prices.