
The Federal Reserve raised its target range for the federal funds rate by 25 basis points to 3.75%-4.00% on Sept. 16 in a unanimous 12-0 vote, the first increase in three years and the first rate move since Kevin Warsh took over as chair in May.
In the following week, the spread between 2-year and 10-year U.S. Treasury yields, known as 2s10s, narrowed to 17 basis points intraday, the tightest level since early 2025. It stopped short of inversion, but only barely. An inverted curve, where the 10-year yield falls below the 2-year yield, has historically been treated as a warning sign for recession.
The debate now is whether this flattening is mainly the front end catching up with the expected policy path, or whether the bond market has started to mark down the "U.S. economy is very strong" narrative.
Front-end yields led the move after the rate hike
This round of flattening was driven by a rise in short-dated yields, not by a rally in the long end on recession fears. The 2-year Treasury yield was around 4.9% early this week, a part of the curve that tends to track policy rates and expectations for future hikes more closely.
The 10-year Treasury yield was around 5.2% over the same period, near its highest level since 2007. That yield reflects growth, inflation, term premium and Treasury supply at the same time. Federal funds futures have already priced in at least three more 25-basis-point hikes over the next year, which helps explain why the short end has moved so quickly.
Not every flattening carries the same message. In August, long-dated yields jumped as investors questioned Warsh’s anti-inflation credibility, producing a bearish steepening. After the September hike was delivered, the front end took over and the curve shifted into a bearish flattening.
In the framework laid out in the report, bearish flattening points to repricing around tightening and inflation, while bullish flattening is the pattern more closely tied to investors piling into long-dated bonds and betting on recession. This episode fits the former more than the latter.
Bond bears see a challenge to the strong-economy view
CreditSights head of macro strategy Zach Griffiths said a flatter curve would push markets to question the idea that the economy is "very strong." His concern is less about one day’s spread reading than about the possibility that short-dated yields keep rising as rate expectations move higher.
If that happens, bank net interest margins, richly valued growth stocks and other long-duration assets would likely feel the strain first.
Jamie Patton, co-head of global rates at TCW, said that if the curve does invert, the signal would be that the Fed has tightened too much and that deeper rate cuts would be needed later. In his view, that would not be a healthy macro outcome.
Ed Al-Hussainy, a portfolio manager at Columbia Threadneedle, went further. He said he is positioned for inversion trades in both 2s10s and 5s30s, arguing that a flattening curve that ultimately inverts is one of the clearest signs that monetary policy is getting tighter.
The counterview: much of the tightening is already priced in
TD Securities U.S. rates strategist Gennadiy Goldberg took the opposite side. He said the market has already priced in a significant amount of tightening, leaving limited room for the front end to rise much more versus the long end. In his view, 2s10s is more likely to steepen over the coming weeks than to flatten further.
Warsh said in both the statement and the press conference that the economy remains strong and that financial conditions are not obviously restrictive. The median path in the Fed’s Summary of Economic Projections showed policy rates at 4.1% at the end of both 2026 and 2027, while real GDP growth was projected at 2.3% and 2.4% for this year and next year. Only a small number of officials treated this hike as a one-off move.
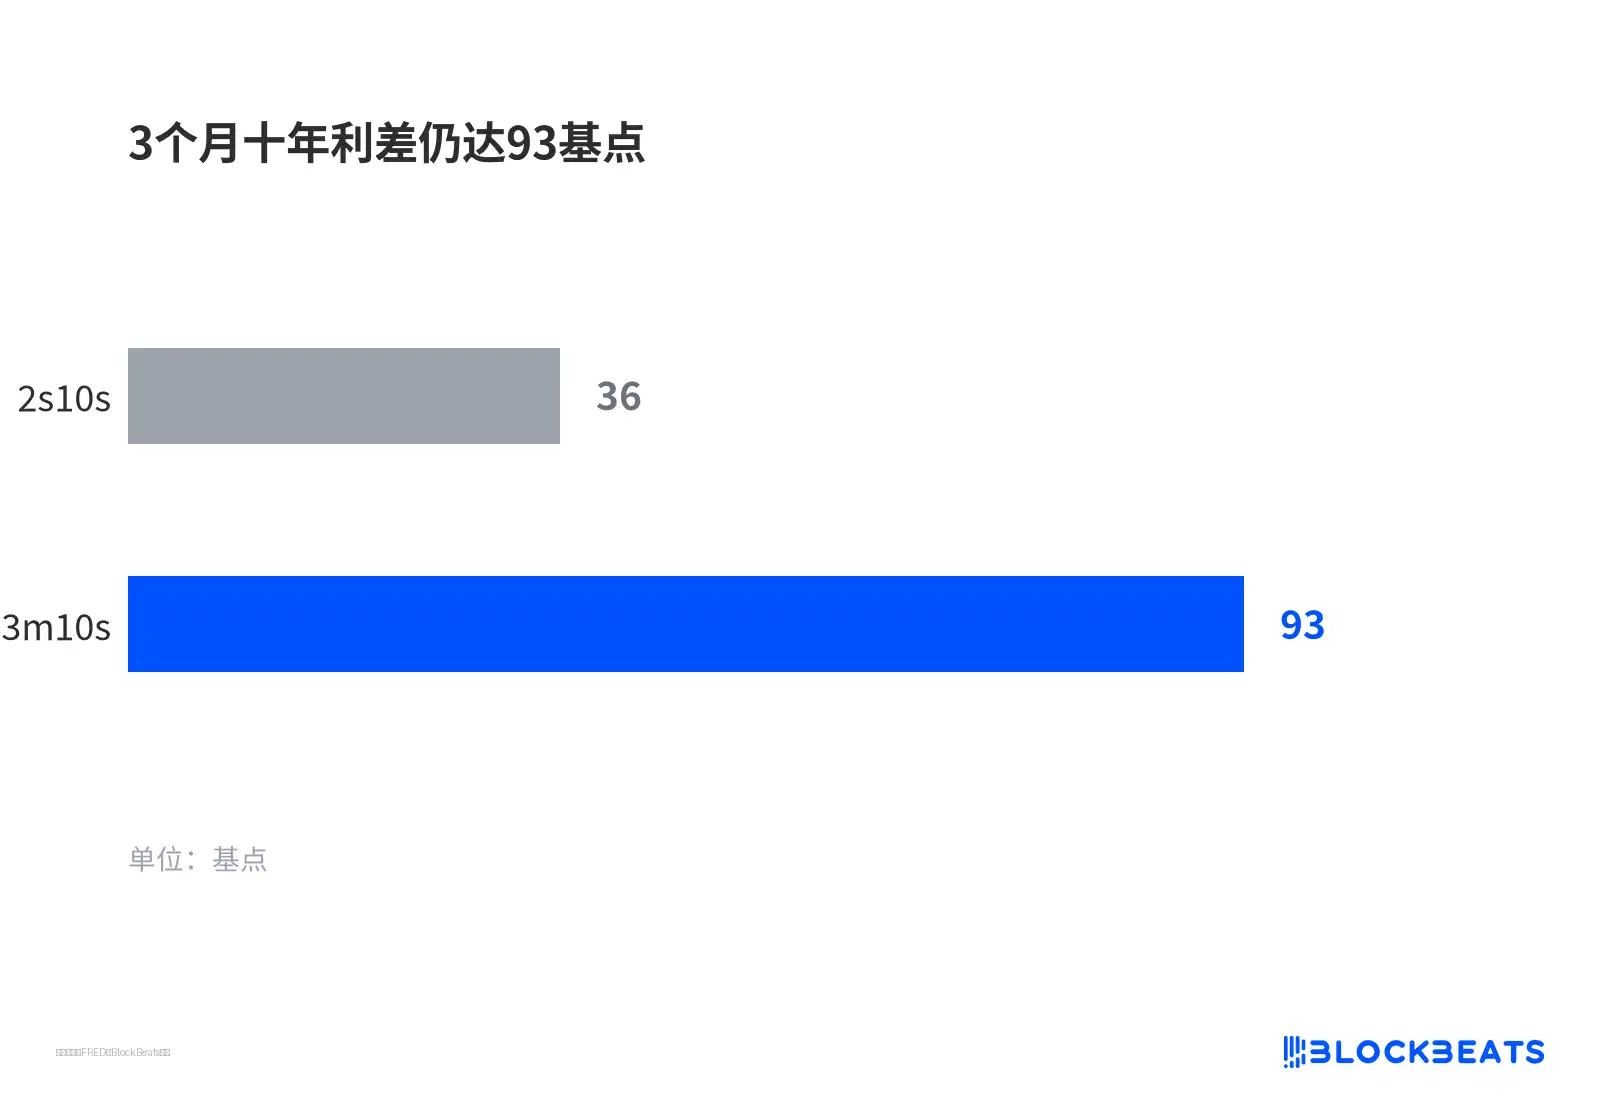
The harder counterpoint comes from the spread between 3-month bills and 10-year Treasuries, or 3m10s. As of Sept. 25, that spread was about 93 basis points and stayed in an 80-94 basis point range through the middle and later part of September. It has not flattened in any meaningful way, much less inverted. The report notes that the Fed has paid more attention to this gauge in recent years.
History also complicates any simple read-through from 2s10s alone. From 2022 to 2024, the spread between 2-year and 10-year Treasuries stayed inverted for roughly 25 to 27 months, the longest inversion in modern history, yet the recession many economists expected did not arrive on schedule.
Bank stocks have reacted first, broad equities have not
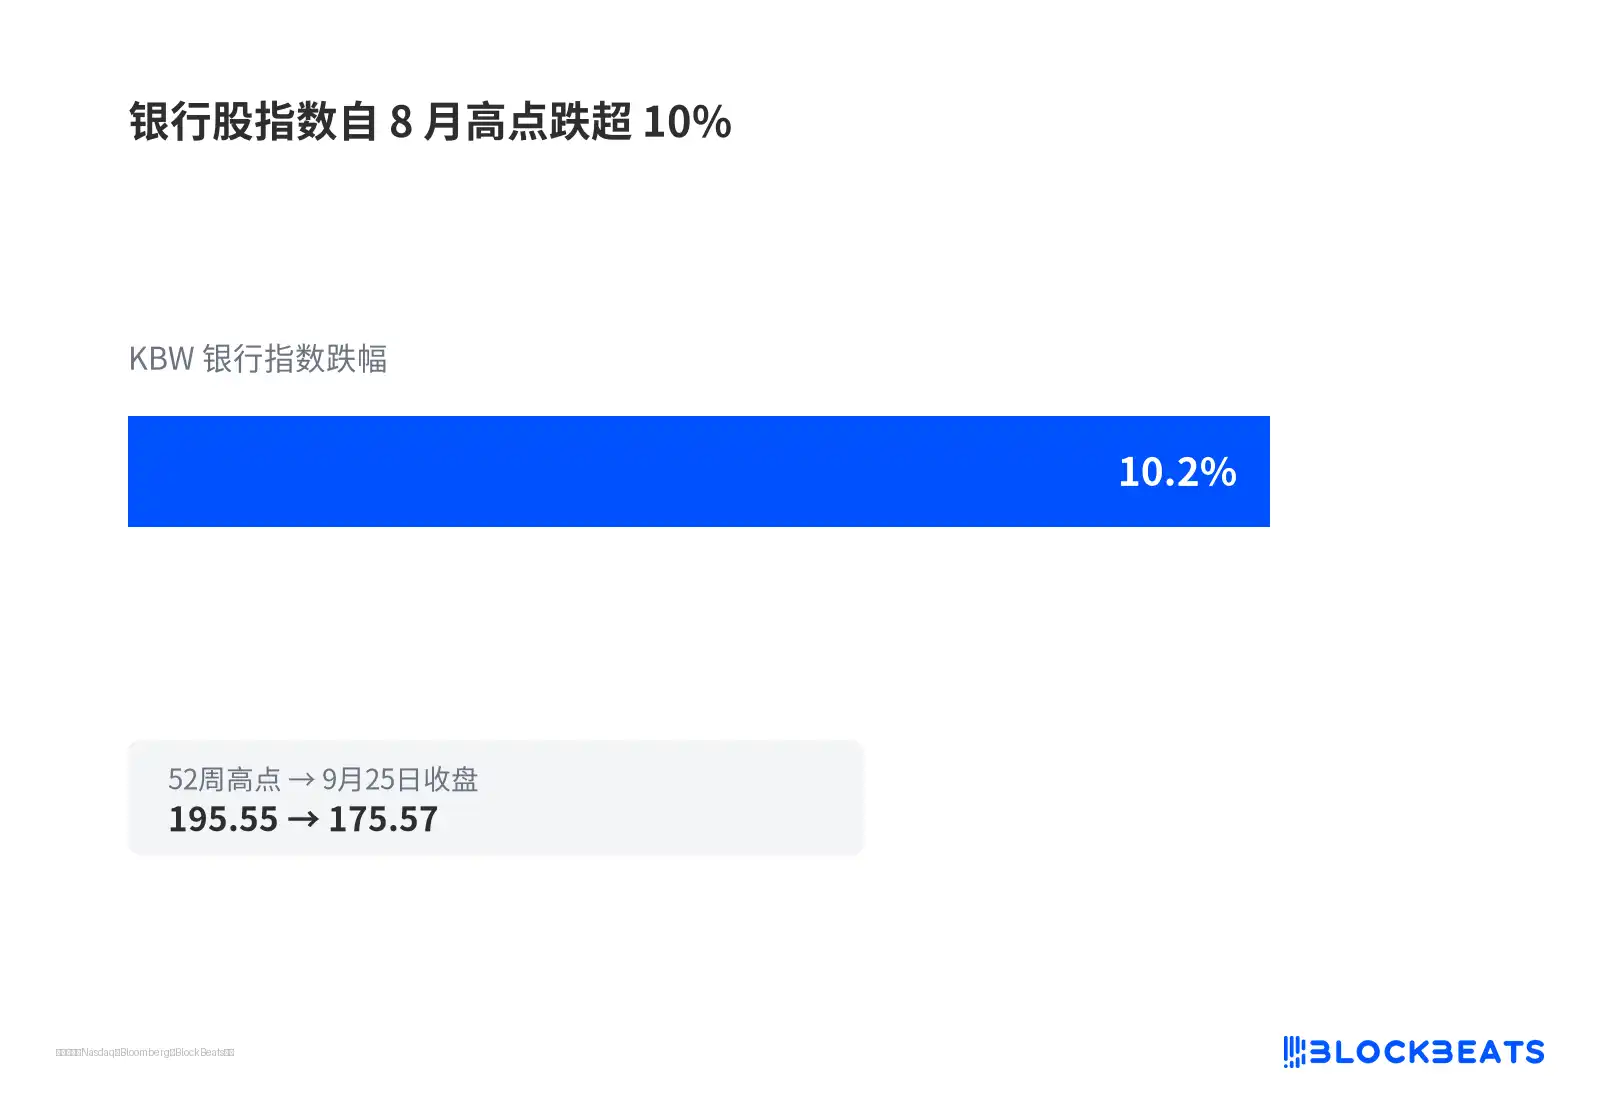
The clearest equity-market link to a flatter curve is the banking sector. The KBW Bank Index has fallen more than 10% from its August high, putting it in technical correction territory.
Banks borrow short and lend long, so a narrower spread can eat into net interest margins. Even so, the decline cannot be pinned on one curve measure alone. Regulation, the credit cycle and sector rotation are also part of the picture.
Broader equity indexes are telling a different story. By the market measure cited in the report, the S&P 500 was still rising over the past week and remained close to recent highs. Its forward price-to-earnings ratio was about 19, down from 22 at the start of the year.
At the same time, the 10-year real yield was around 2.82%, near the highest level since 2008. So far, higher rates have not clearly broken earnings expectations.
Globally, the evidence is still concentrated in the United States. Broader claims that this flattening could reverse a global return to normal curve shape are not well supported by the data cited in the report. The spread between 2-year and 10-year U.K. gilts remained positive at about 18 basis points, and the German Bund curve also kept a normal positive slope.
Growth data will decide whether this is repricing or a warning
For now, the evidence supports a narrower conclusion. Inversion risk has risen enough that markets need to price it, but it is too early to say the curve has already inverted, and even earlier to say a recession signal has been confirmed.
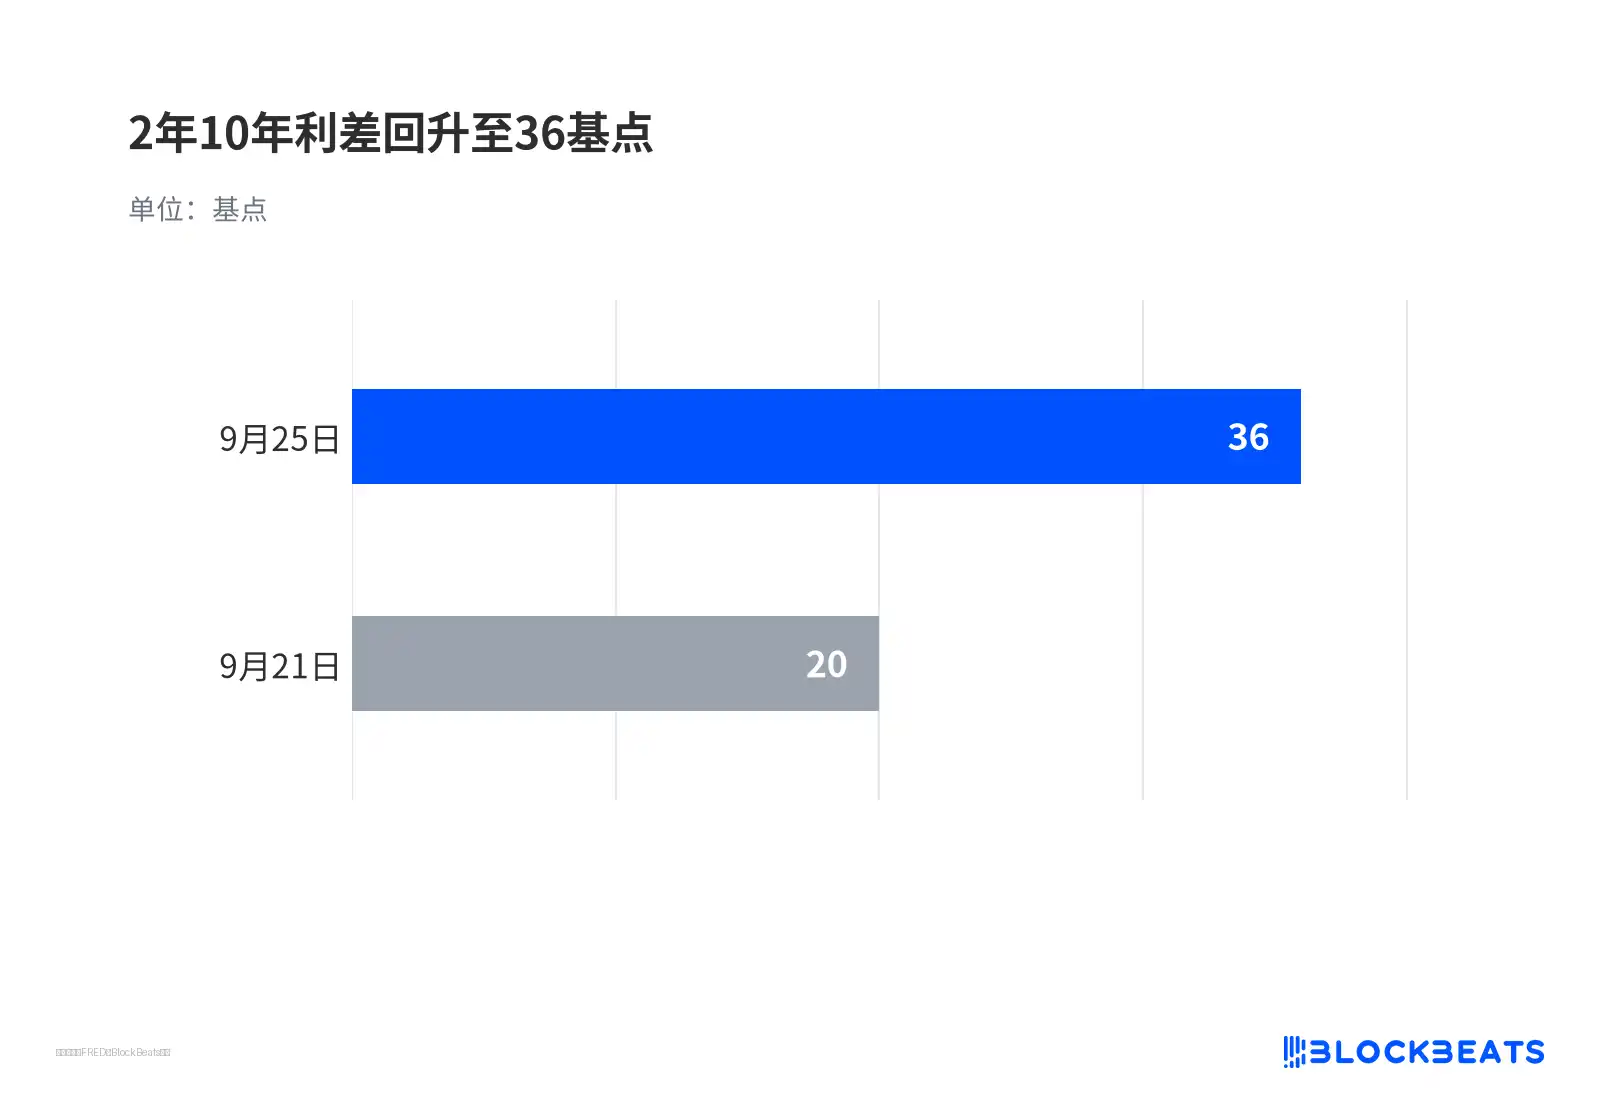
Intraday extremes and closing data also need to be separated. According to the Federal Reserve Economic Data database, or FRED, the daily closing 2s10s spread recovered from about 20 basis points on Sept. 21 to around 36 basis points on Sept. 25.
In that reading, the 17-basis-point intraday low looks more like a temperature check on crowded rate-hike expectations than hard proof that the economy is rolling over.
What comes next depends on growth data. If October data or the next Fed meeting pushes front-end pricing higher again while fourth-quarter growth, employment or inflation show a clear turn, the challenge to the strong-economy narrative could build quickly.
If 3m10s stays steep and earnings expectations remain intact, the curve could steepen again, leaving the latest flattening as another repricing move inside a bear market. Over the coming months, bank net interest margins and the rate sensitivity of highly valued assets will be the most direct areas to watch.