After June’s system-wide correction, crypto clawed back in stages through July 2026. CoinGecko’s Top 500 market cap time series shows total market capitalization rising from about $2.11T on July 1 to $2.28T on July 31, for a monthly gain near 8.31%. The low for the month came on July 1. The high hit on July 22, when total market cap briefly touched $2.33T. Fast rebound first, then consolidation near the highs through the back half of the month.
Bitcoin rebounded from roughly $58,551 at the start of July, climbed to about $66,507, and finished at $64,722, up 10.54% on the month. That move put BTC back above $60,000 and erased most of June’s damage. Ethereum did better. It moved from $1,570 to $1,917, good for a 22.13% monthly gain, with a peak near $1,953. ETH’s relative strength lifted risk appetite across DeFi, on-chain apps, and high-beta names. UNI (+59.32%), AAVE (+17.02%), LINK (+17.76%), and ONDO (+35.07%) all bounced as capital rotated out of BTC defensive positioning and back into application-layer and DeFi tokens.
Macro conditions changed course. June was about “high interest rate expectations, geopolitical risks, and risk asset repricing.” July shifted to “cooling inflation, falling rate hike expectations, and risk appetite recovery.” Mid-July US inflation data came in below expectations, trimming bets on another near-term rate hike, pushing BTC toward $65,000 and helping risk assets. The Fed left rates unchanged at the end of July, and markets turned their attention to the policy path and tech earnings, while BTC consolidated around $64,000. Fund flows improved too. Spot BTC ETFs went from steady outflows to modest net inflows. TFTC data shows US spot BTC ETFs posted total net inflows of $222.3M across the first 18 trading days of July, with 11 inflow days and 7 outflow days. That points to institutional money shifting from consistent reduction to a slight recovery, though not at a scale big enough to fuel a full rally.
Early-August on-chain data from DeFiLlama showed total DeFi TVL at $77.1B. That’s up from the $70B range at the end of June, though still below the May recovery high. Stablecoin market cap stood at $309.7B, with USDT dominance at 59.5%, a sign that cash levels stayed high as funds remained parked in stablecoins instead of leaving the market. DEX spot trading volume came in at $39.6B over 7 days and $6.0B over 24 hours. On-chain perpetual volume reached $120.5B over 7 days, far above DEX spot, which says derivatives and leverage were still the main engines of activity during the rebound. So yes, the market moved from “panic selling” to “risk appetite replenishment.” But the on-chain capital mix still looked careful, and this recovery looked more like structural rotation than the start of a fresh bull market.
Full Price Data Panorama
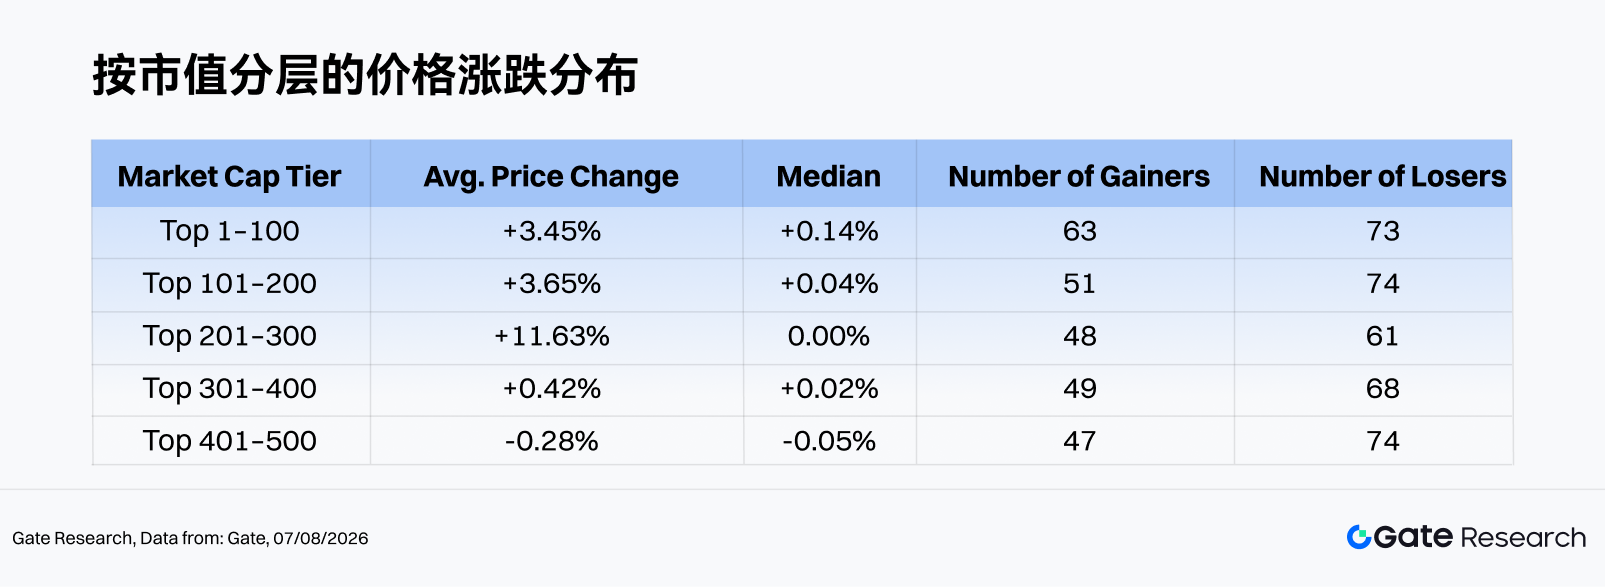
Of the 493 valid samples in the Top 500, 258 moved higher, 218 moved lower, and 17 were flat. The winner ratio hit 52.33%, a solid improvement from June and enough to push market breadth back into slightly bullish territory. Average return was +3.78%. Median return, though, was only +0.02%. That’s not a broad rip higher. It’s a mild and patchy recovery.Market cap tier analysis shows a pretty clear pattern: “head stable, middle elastic, tail fragile”:
- Top 1-100: 63 up, 36 down, 1 flat; 63% positive; median +0.14%; mean +3.45%. UNI (+59.3%), PUMP (+40.3%), ONDO (+35.1%), M (+32.7%), BEAT (+32.4%), and DAI (+30.6%) led the upside. ETH (+22.1%) and BTC (+10.5%) also helped sentiment. On the losing side were PI (-28.1%), WLD (-24.7%), RAIN (-15.3%), ATOM (-15.2%), and CC (-14.3%), pointing to fading narratives even among top caps.
- Rank 101-200: 51 up, 46 down, 3 flat; 51% positive; median +0.04%; mean +3.65%. US (+291.7%), BC (+119.2%), KAITO (+97.8%), UB (+61.6%), BTW (+59.9%), and META (+54.2%) showed mid-cap resilience. But JW7 (-98.4%), VELVET (-74.9%), NIGHT (-39.6%), GRASS (-31.4%), and JTO (-29.5%) were reminders that project-specific risk can still get ugly.
- Rank 201-300: 48 up, 43 down, 7 flat; 49% positive; median ~0%; mean +11.63% thanks to outliers such as AKE (+1,061.7%), MWC (+84.3%), ZAMA (+60.5%), EDGE (+44.9%), and FLUID (+42.5%). Losers including DEXE (-89.9%), DYDX (-39.1%), SPCXB (-34.4%), CHZ (-28.0%), and BP (-27.2%) show how exposed mid-caps are when narratives cool off.
- Rank 301-400: 49 up, 43 down, 4 flat; 51% positive; median +0.02%; mean +0.42%. DGB (+70.0%), PRL (+53.9%), XPR (+40.3%), UPUMP (+40.1%), and XNO (+29.9%) led gains. Losers BILL (-45.1%), BAS (-42.0%), SNDKB (-39.9%), and RE (-31.5%) show just how jumpy lower mid-caps stayed.
- Rank 401-500: 47 up, 50 down, 2 flat; 47.5% positive; median -0.05%; mean -0.28%, the only tier with negative averages. UTYA (+166.4%), HDX (+124.4%), SENTIS (+89.0%), REKT (+76.0%), and FUN (+66.5%) showed how explosive the tail can get. But PRN (-99.7%), LAB (-98.9%), SKYAI (-75.6%), EXOD (-38.4%), and PMUSD (-37.7%) posted brutal losses, confirming that liquidity and project fundamentals are weakest at the tail end.
Gainers and Losers
Gainers: Meme, AI/InfoFi, and DeFi Lead
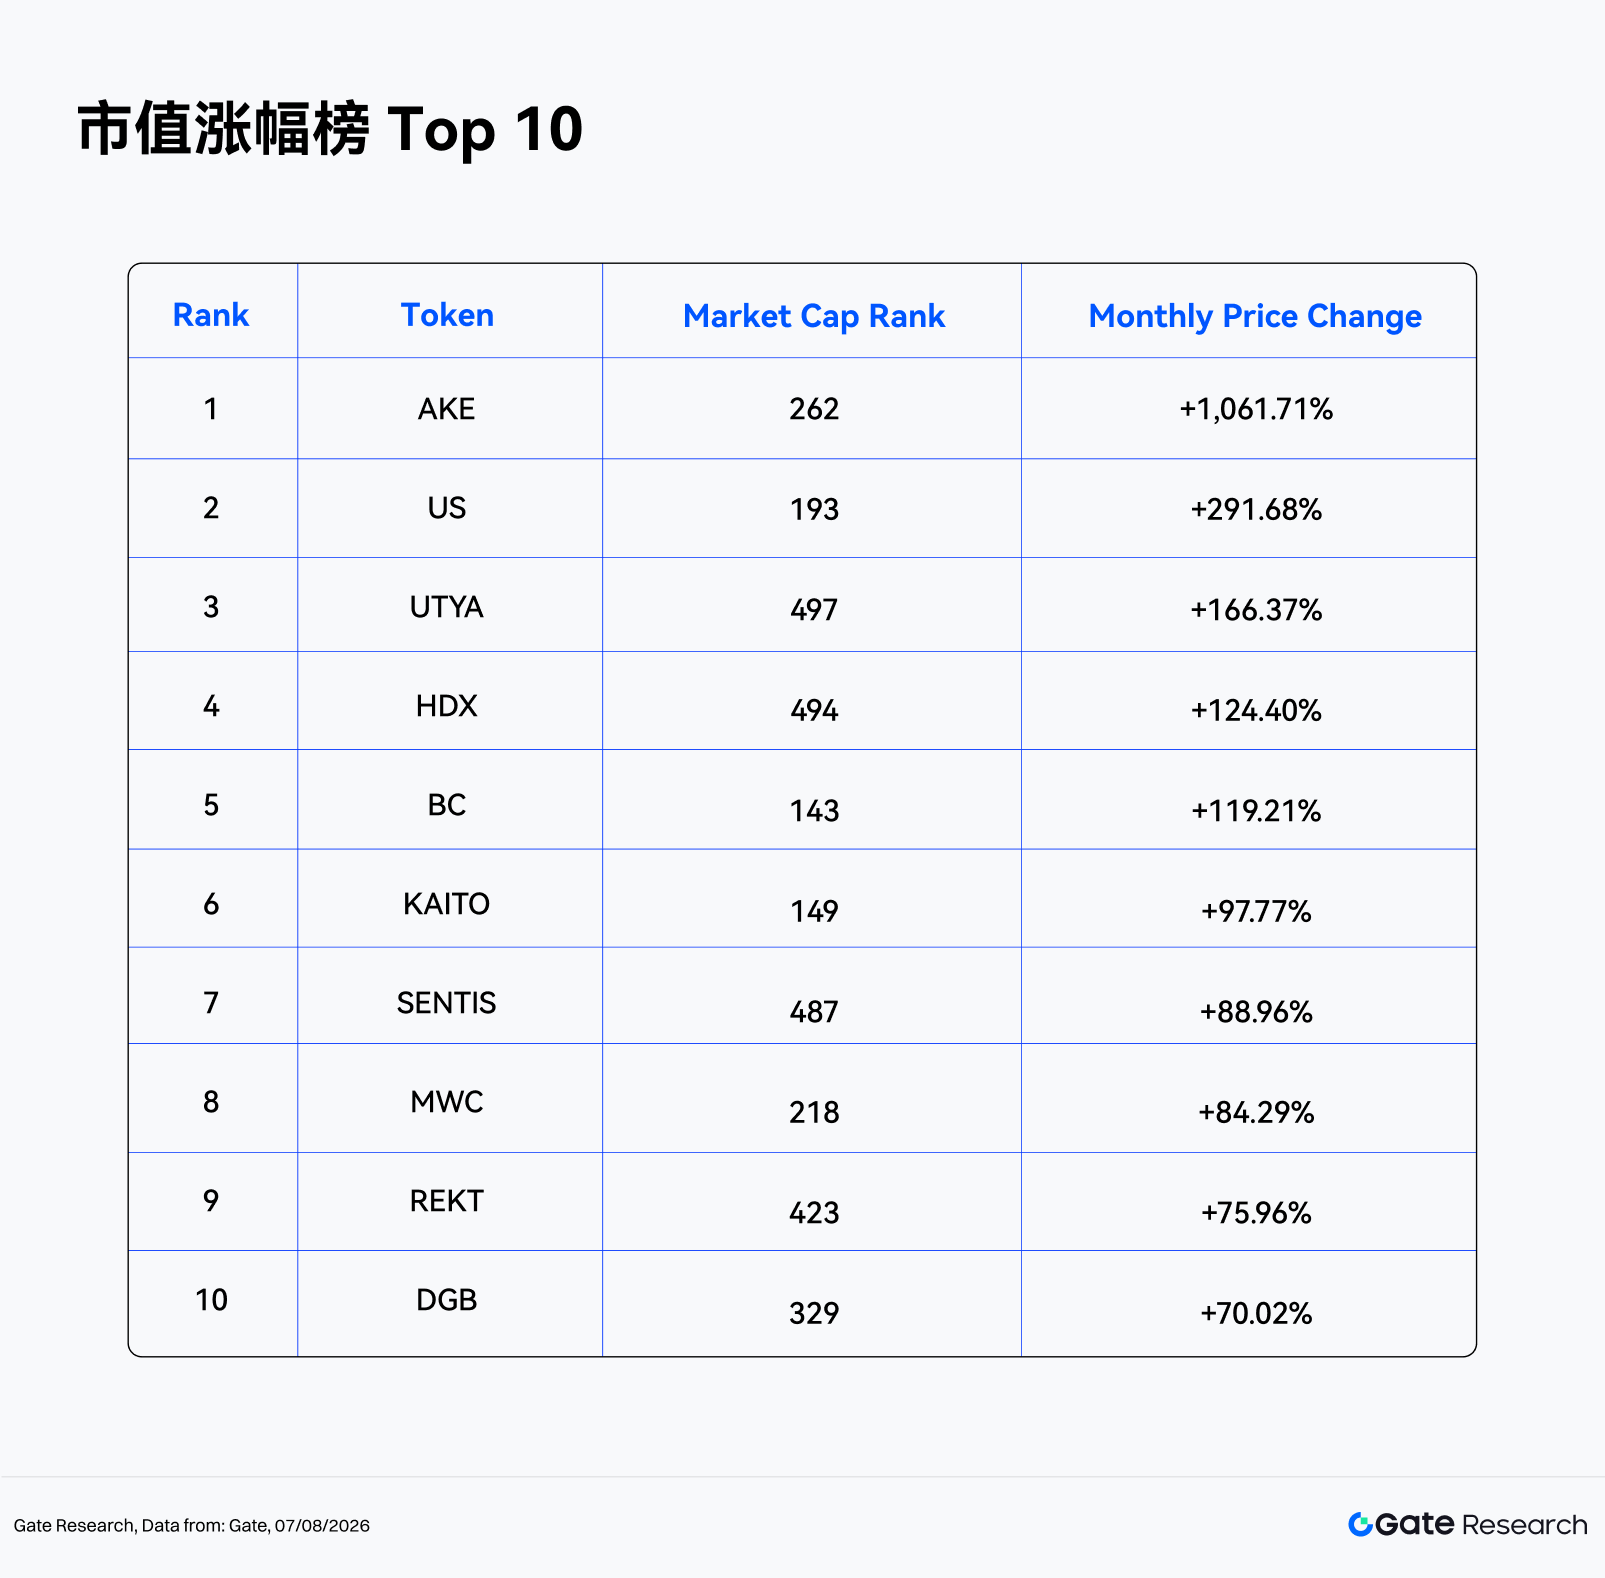
The top gainers list was packed with Meme/community tokens, AI/InfoFi names, DeFi blue chips, and gaming/ecosystem plays. AKE (+1,061.71%) was the month’s biggest winner, followed by US (+291.68%), UTYA (+166.37%), HDX (+124.40%), and BC (+119.21%). Note: CASHCAT was excluded because its initial price was near zero liquidity; the calculation used its effective trading price from July 9.AKE (Rank 262) was the standout dark horse. It’s a gaming/ecosystem token, and its low market cap gave it plenty of elasticity. Volume surged 15.0x, creating the classic “low-cap + volume breakout” setup. Short-term capital drove the move. Whether it lasts depends on ecosystem activity and whether the volume holds up.
KAITO (Rank 149) sits in the AI/InfoFi and attention-finance camp, and it benefited from renewed interest in crypto data, social influence pricing, and research distribution infrastructure. Volume rose 3.3x alongside the price move, which suggests capital wasn’t just blindly chasing Memes. It also went after mid-cap projects with clear product narratives and community virality.
UNI (Rank 38) didn’t make the top 10 overall, but it did lead the Top 100 and stood out as a DeFi blue-chip valuation rebound. ETH’s 22.1% gain improved on-chain risk appetite, and the beta recovery in DeFi trading, liquidity, and governance assets made UNI one of the cleaner rebound trades among large caps.
Losers: Extreme Retracements and Profit-Taking
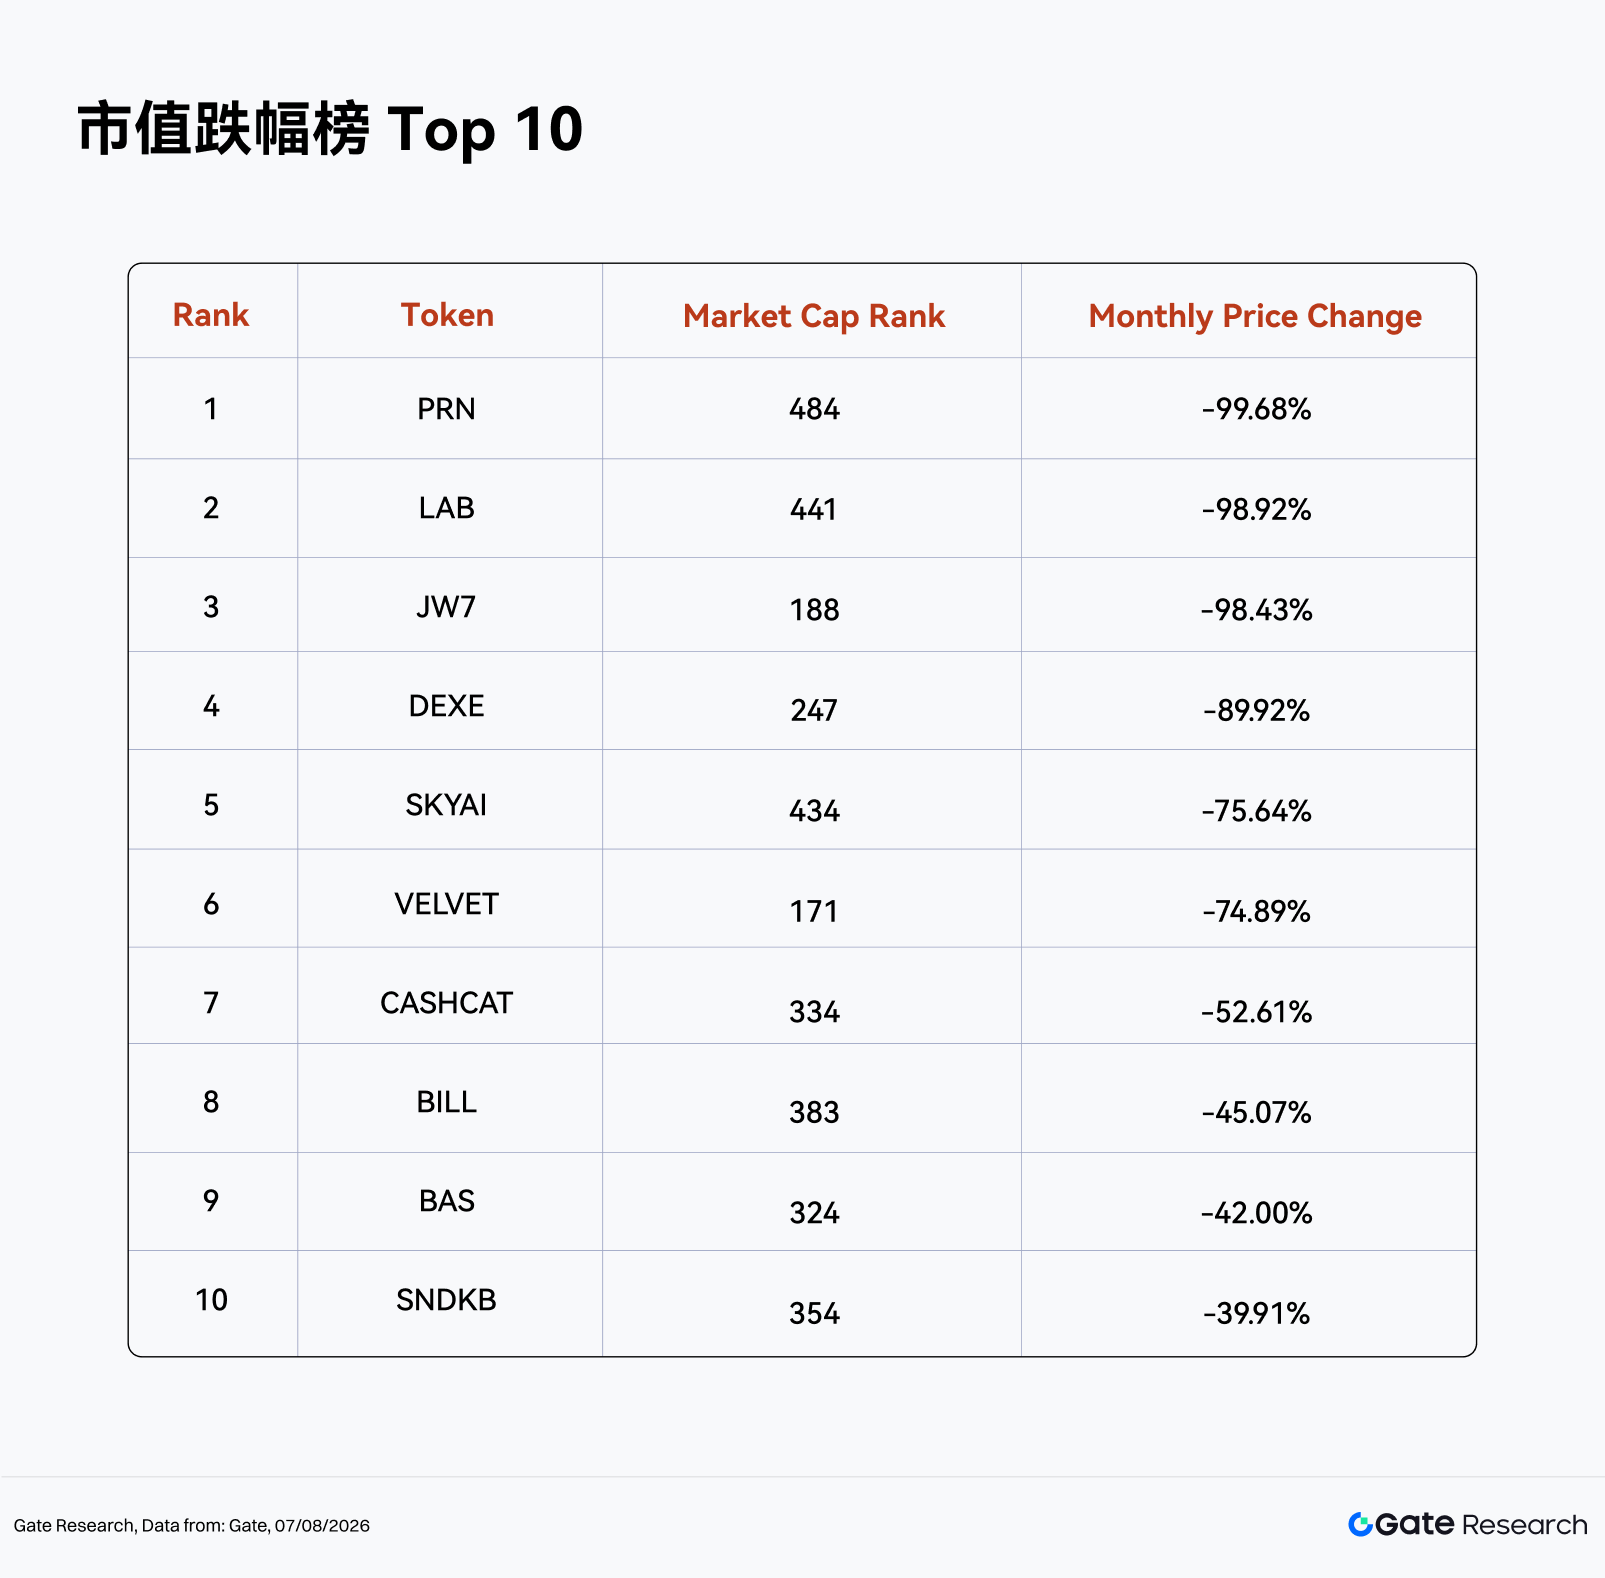
The losers list was full of violent pullbacks in small caps, previously overextended names, and volume-led drops. PRN (-99.68%), LAB (-98.92%), and JW7 (-98.43%) were nearly wiped out. DEXE (-89.92%), SKYAI (-75.64%), and VELVET (-74.89%) also went through heavy corrections. CASHCAT, recalculated using its July 9 effective price, dropped 52.61%, another case of tail-end volatility risk.LAB (Rank 441) is a good example. It had surged earlier on DeSci/AI narratives, but by July it had slipped to the tail of the market cap rankings, failed to keep capital support, and gave back almost all of those gains. When hype fades, narrative-driven tail assets can collapse much faster than large caps. Simple as that.
DEXE (Rank 247) is the classic volume-driven decline. Heavy volume didn’t help price recover. It showed up alongside deep losses instead, which points to concentrated selling or valuation repricing during high-turnover periods. This is different from low-volume drift. High-volume red candles like DEXE deserve caution because they can signal capital getting out through better liquidity.
VELVET (Rank 171) looks like profit-taking in a strong June winner. After a big run, it had no fresh catalyst in July and retraced quickly. That’s a familiar pattern: low-cap DeFi/strategy names driven by short-term money can correct hard once market style changes.
Market Cap Ranking vs. Returns
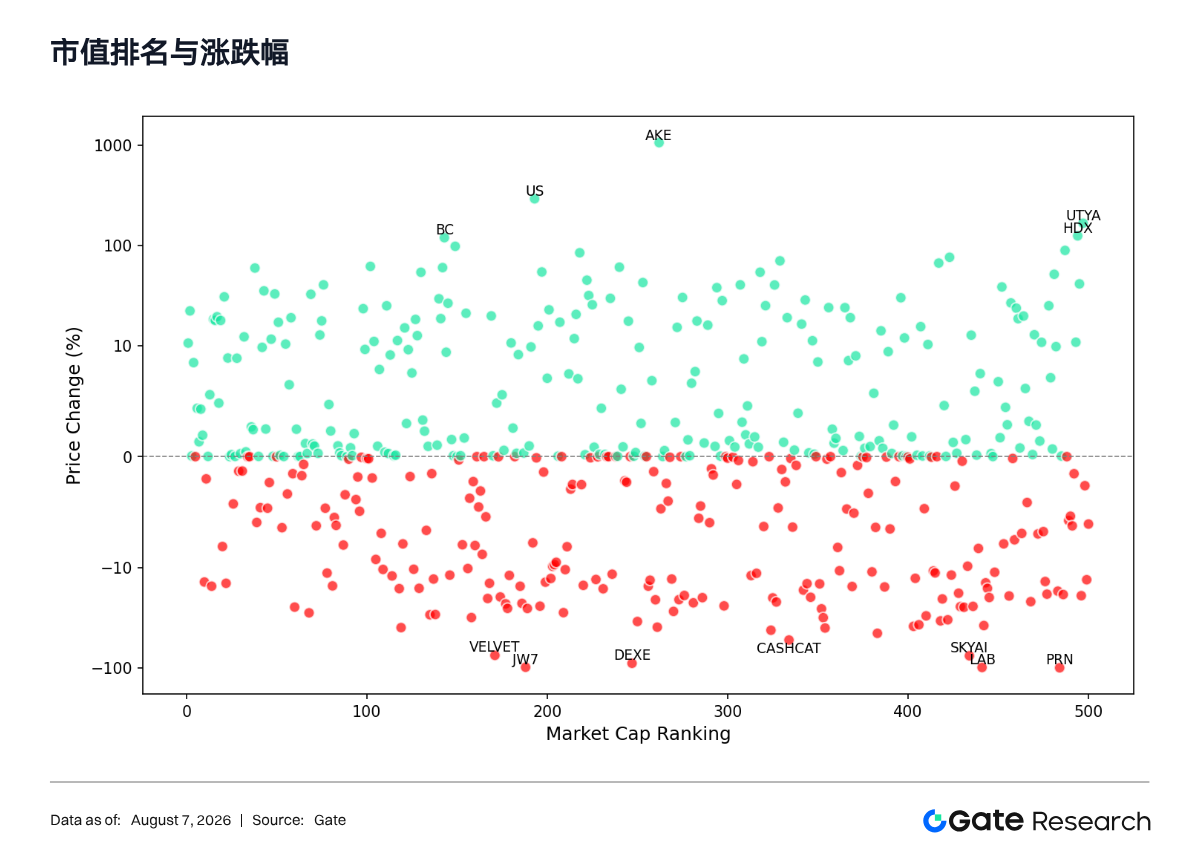
The scatter plot of market cap rank against returns shows July was plainly better than June. The Top 100 had more winners, with BTC, ETH, UNI, ONDO, AAVE, and LINK all rebounding and helping form the base of the recovery. The Rank 100-300 zone had more elasticity, with mid-cap names such as KAITO, BC, US, AKE, and ZAMA adding a lot of the upside.But the Rank 300-500 zone was still the center of tail risk. UTYA, HDX, SENTIS, REKT, and DGB logged big gains, while PRN, LAB, SKYAI, CASHCAT, EXOD, and PMUSD took deep losses. The pattern is pretty blunt: the farther down the market cap table you go, the less stable the return distribution gets. Investors need to watch liquidity, trading continuity, and pullback risk after spikes much more closely there.
Top 100 Cap Movers
Among the top 100 by market cap, 63 rose and 36 fell, clearly better than June. UNI (+59.3%) led the group, followed by PUMP (+40.3%), ONDO (+35.1%), M (+32.7%), BEAT (+32.4%), and DAI (+30.6%). ETH (+22.1%), AAVE (+17.0%), LINK (+17.8%), and ADA (+17.8%) also gained, showing rotation from mainstream assets into DeFi and on-chain application tokens.On the weak side were PI (-28.1%), WLD (-24.7%), RAIN (-15.3%), ATOM (-15.2%), and HYPE (-13.9%). Overall, the quality of the recovery in the Top 100 was better than in the mid and tail tiers. Still, this wasn’t a broad rally. Capital favored names with clear liquidity, narrative catalysts, or actual application scenarios.
Volume Performance Analysis
Volume Growth Analysis
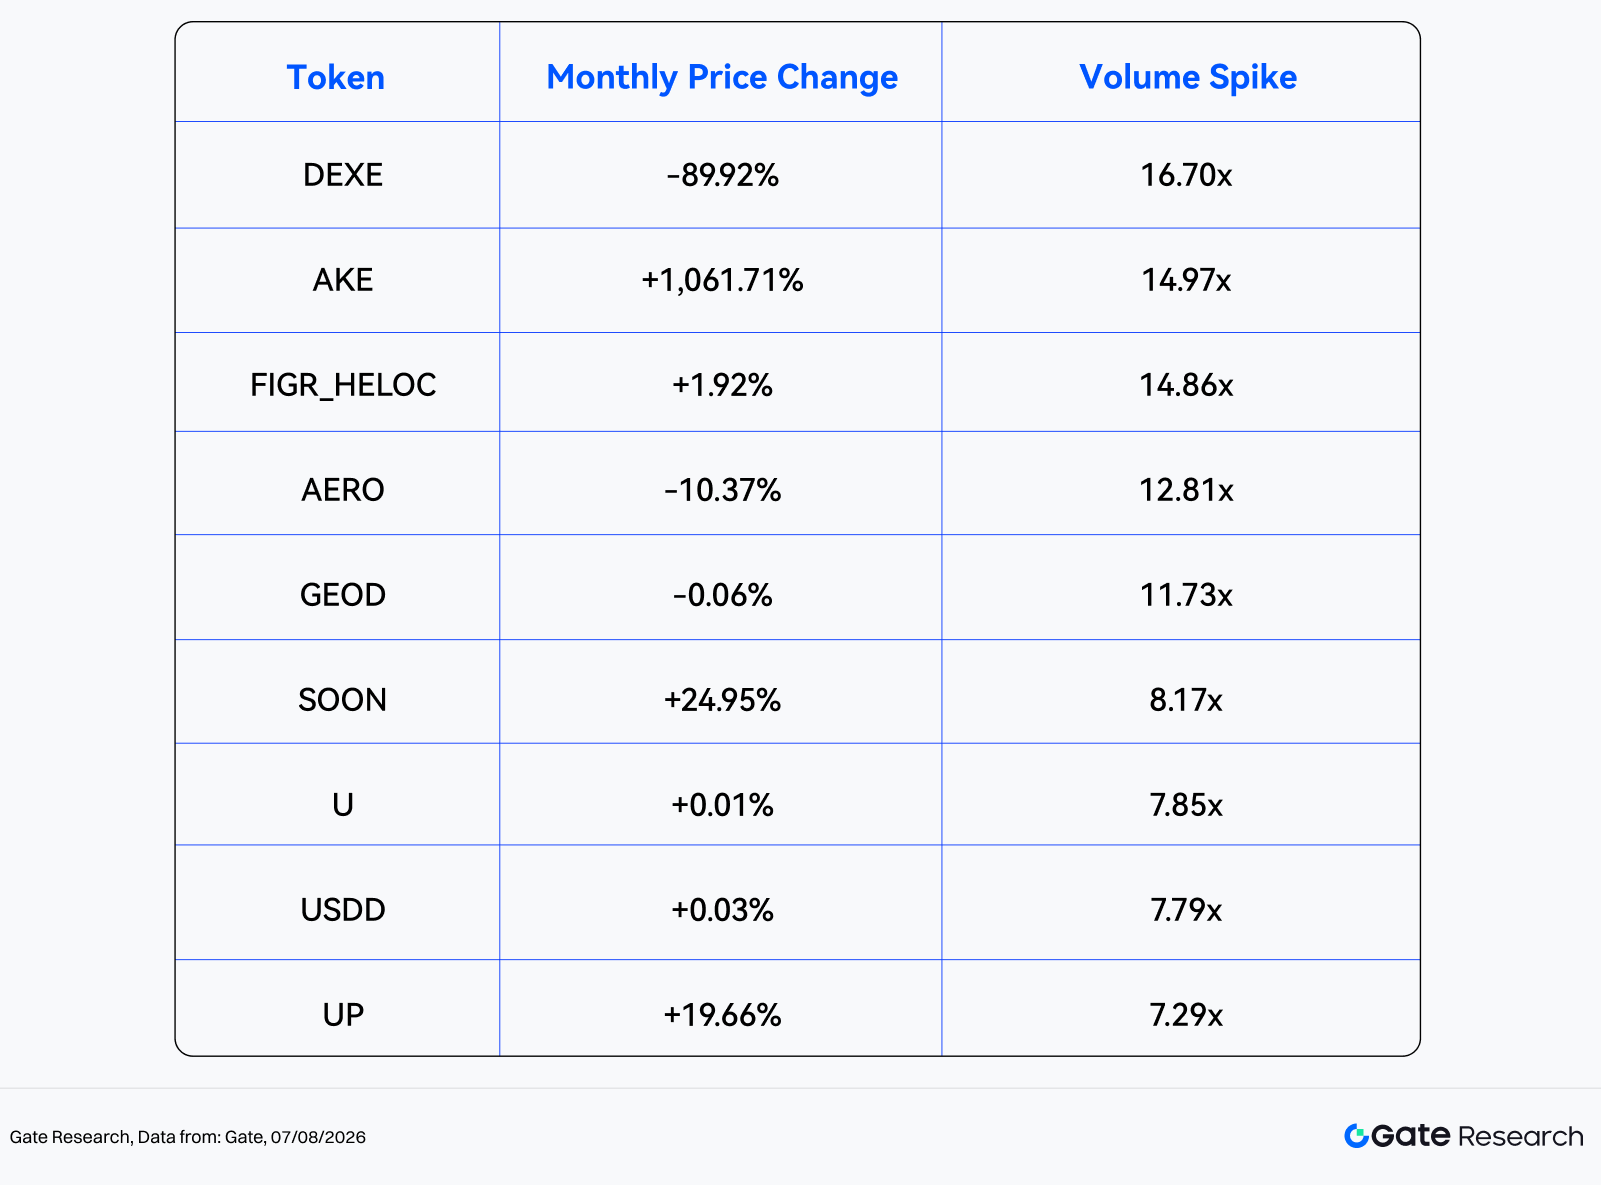
Using monthly volume change to compute Volume Spike, 451 tokens had valid volume data. Excluding CASHCAT, the average volume multiple was about 1.21x, and the median was 0.80x. In total, 28 tokens posted volume spikes above 3x, 18 were above 5x, and 6 were above 10x.The biggest volume spikes came from DEXE (16.70x), AKE (14.97x), FIGR_HELOC (14.86x), AERO (12.81x), and GEOD (11.73x). But high volume does not automatically mean a directional trade. FIGR_HELOC, USDD, USDG, AVUSD, and CUSD are stablecoin/RWA/yield assets, where volume spikes can come from on-chain rebalancing, arbitrage, or capital migration. Risk assets such as AKE, ZAMA, KAITO, UPUMP, and BOME are more useful for trend reading when volume jumps come with price gains.
High-volume tokens break into three buckets: (1) low-base outliers, where the multiple gets inflated by tiny starting volume and price did not rise under effective trading; (2) stablecoins, RWAs, or yield assets, where volume surges reflect capital rebalancing and offer limited price direction; (3) risk assets such as AKE, ZAMA, KAITO, UPUMP, and BOME, where rising volume and rising price together make them more credible short-term rotation candidates.
Volume and Price Analysis
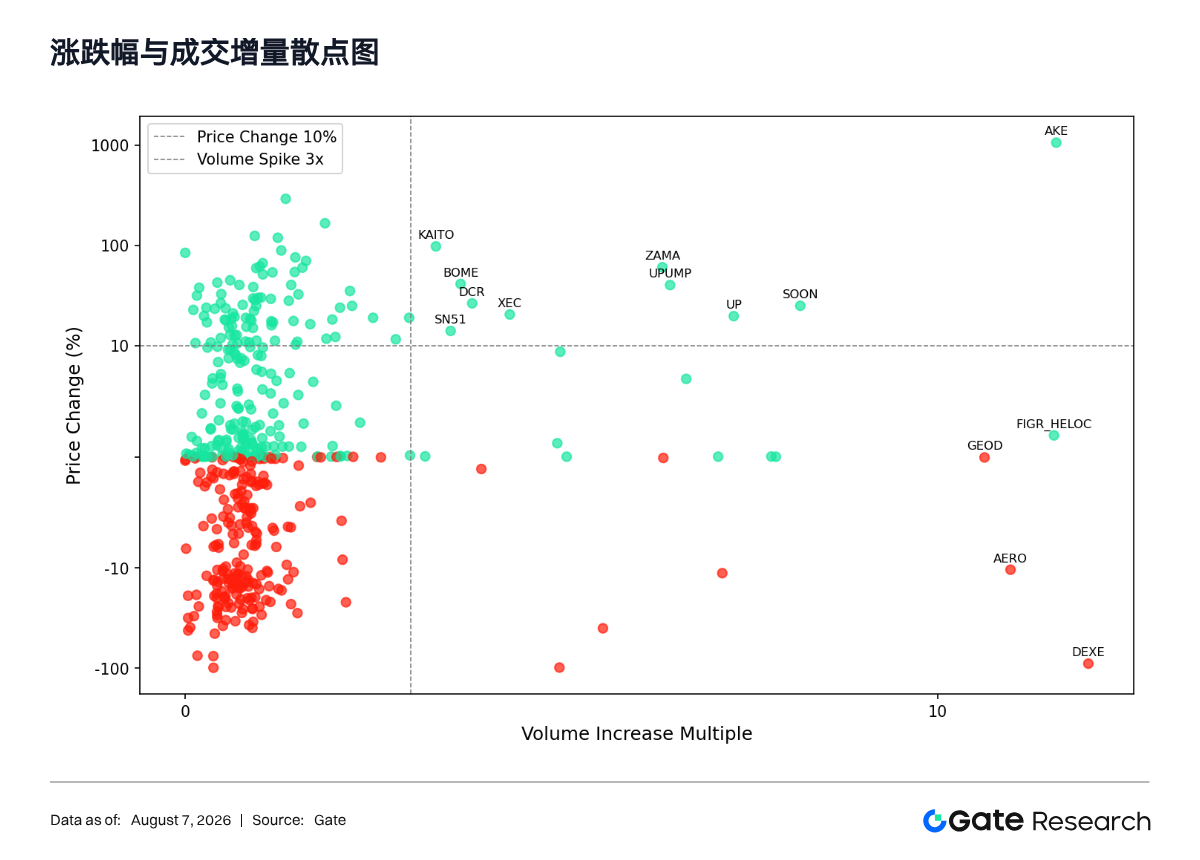
The July scatter plot shows a pattern of “high density in low-volume range, improved signals in mid-volume, and polarization in ultra-high volume.” Compared with June, the 3-10x range had a much higher share of gainers, which suggests some real buying came back. But the above-10x range still included volume-led declines and false signals. So this part needs to be read in layers.- 0-3x low-volume range: 423 tokens, 218 up, 204 down, median return +0.01%. This was the bulk of the market, moving from broad losses in June to near balance in July. US (+291.7%, 1.3x), UTYA (+166.4%, 1.9x), HDX (+124.4%, 0.9x), BC (+119.2%, 1.2x), and SENTIS (+89.0%, 1.3x) all posted big gains without major volume expansion, showing the price elasticity of low-liquidity assets.
- 3-10x mid-volume range: 22 tokens, 17 up, 5 down, median return +4.11%. This range improved sharply from June. KAITO (+97.8%, 3.3x), ZAMA (+60.5%, 6.3x), BOME (+41.2%, 3.7x), UPUMP (+40.1%, 6.4x), DCR (+26.4%, 3.8x), and SOON (+25.0%, 8.2x) showed solid volume-price alignment, pointing to effective breakout signals. But ZIL (-11.2%, 7.1x), SNDKB (-39.9%, 5.6x), and JW7 (-98.4%, 5.0x) were still volume-driven decliners, so caution around distribution or risk clearing remains justified.
- Above 10x ultra-high volume: 6 tokens, 2 up, 4 down, the most polarized group. Positive cases were AKE (+1,061.7%, 15.0x) and FIGR_HELOC (+1.9%, 14.9x), though the latter had limited price elasticity. Negative cases included CASHCAT (-52.6%, 2,164,691,068.2x), DEXE (-89.9%, 16.7x), AERO (-10.4%, 12.8x), and GEOD (-0.1%, 11.7x), suggesting that ultra-high volume without a price breakout may point to capital flight or valuation repricing.
Correlation Analysis
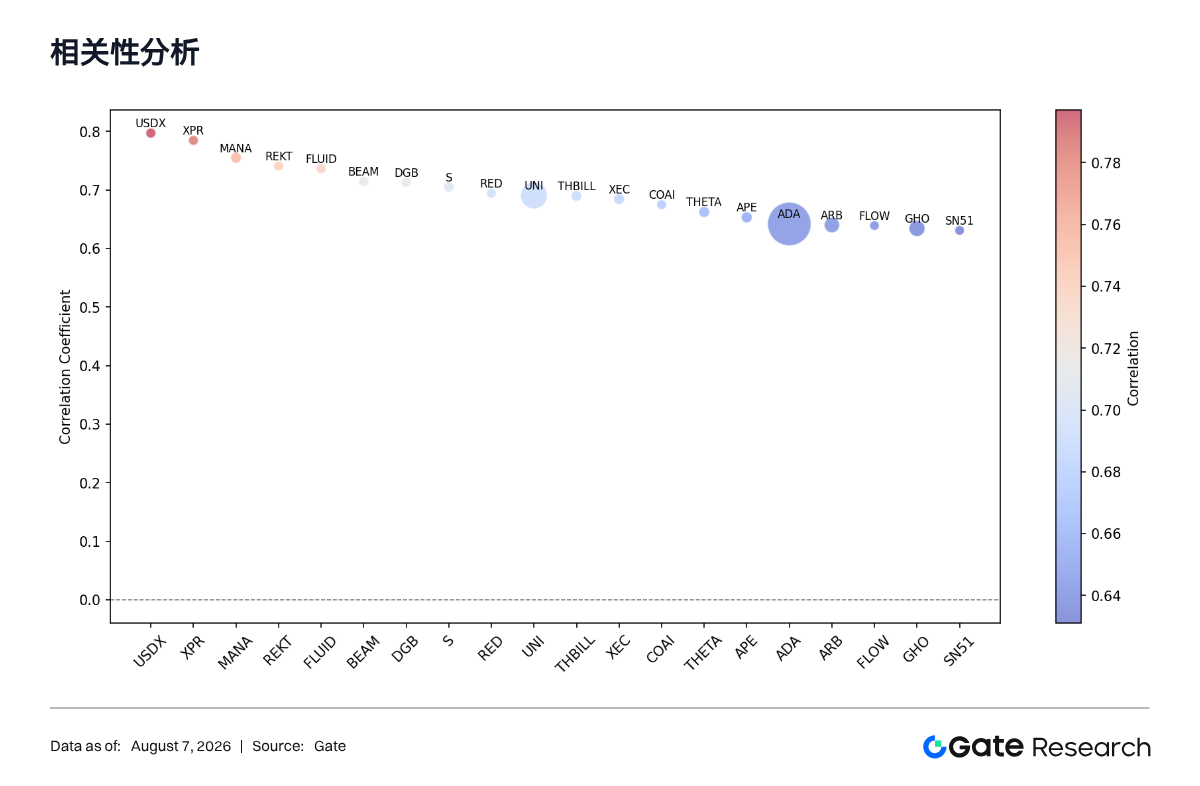
Leaders in volume-price correlation included USDX (0.80), XPR (0.78), MANA (0.75), REKT (0.74), FLUID (0.74), BEAM (0.71), and DGB (0.71). High correlation means capital activity explained a big chunk of price movement, especially in small and mid-cap tokens and thematic rotation names where changes in volume translate quickly into price swings.And UNI (0.69) and ADA (0.64) also entered the higher-correlation range. That tells you something. In July, it wasn’t only tail-end assets reacting to stronger capital activity; some leading DeFi names and major L1 tokens were too. That lines up with the broader structure: ETH outperforming BTC and DeFi blue chips bouncing back.
Summary
The crypto market was plainly stronger in July than in June. Aggregate market cap across the Top 500 climbed 8.31%, more tokens rose than fell, and BTC, ETH, and DeFi blue chips all recovered, which improved risk appetite. But the median return was only +0.02% and the average was +3.78%, so this still looks structural rather than like a full-market bull run.Structural opportunity gathered around three themes: (1) DeFi blue-chip recovery driven by ETH strength, such as UNI, AAVE, and LINK; (2) AI/InfoFi and mid-cap application tokens like KAITO and ZAMA; (3) short-term capital piling into Meme and long-tail ecosystem tokens such as UTYA, REKT, and DGB. That third bucket is extremely volatile. Better as a sentiment read than a stable allocation. The CASHCAT recalculation also shows how badly illiquid starting prices can distort gain/loss analysis.
Looking into August, the next question is whether the rebound can turn into a sustained trend. That depends on whether BTC and ETH hold their strength and whether volume broadens from long-tail and mid-cap names into more Top 100 assets. If the 3-10x volume range keeps showing volume-price alignment, recovery quality could improve. But if ultra-high volume keeps arriving with flat or falling prices, caution around post-bounce profit-taking is still the right call.
References:
- CoinGecko, https://www.coingecko.com/
- Gate, https://www.gate.com/trade/BTC_USDT
- CoinDesk: https://www.coindesk.com/markets/2026/07/15/bitcoin-tops-usd64-000-as-cooling-u-s-inflation-guts-the-fed-rate-hike-trade
- TFTC Bitcoin ETF Flows: https://www.tftc.io/bitcoin-etf-flows/july-2026
- DeFiLlama: https://defillama.com/
Gate Research is a blockchain and cryptocurrency research platform that publishes in-depth content including technical analysis, hot-topic insights, market reviews, industry research, trend forecasts, and macroeconomic policy analysis.
Cryptocurrency market investments carry high risk. Users are advised to conduct independent research and fully understand the nature of purchased assets and products before making any investment decisions. Gate is not liable for any losses or damages arising from such investment decisions.
【Disclaimer】Market risk exists; invest cautiously. This article does not constitute investment advice. Users should consider whether any opinions, views, or conclusions herein fit their specific circumstances. Invest at your own risk.