
July Market Divergence: BTC Repair, ETH Strength, No Altcoin Season
July did not bring the usual rotation from large caps into wild altcoins. Bitcoin climbed from $58,566 to $62,897. Ethereum moved from $1,570 to $1,863. Solana, by contrast, slipped from $73.56 to $72.88. Month-end returns came in at +7.39%, +18.68%, and -0.93%. The message was pretty plain: money stuck with assets that had spot ETF access and deep mainstream liquidity, instead of fueling a broad altcoin run.
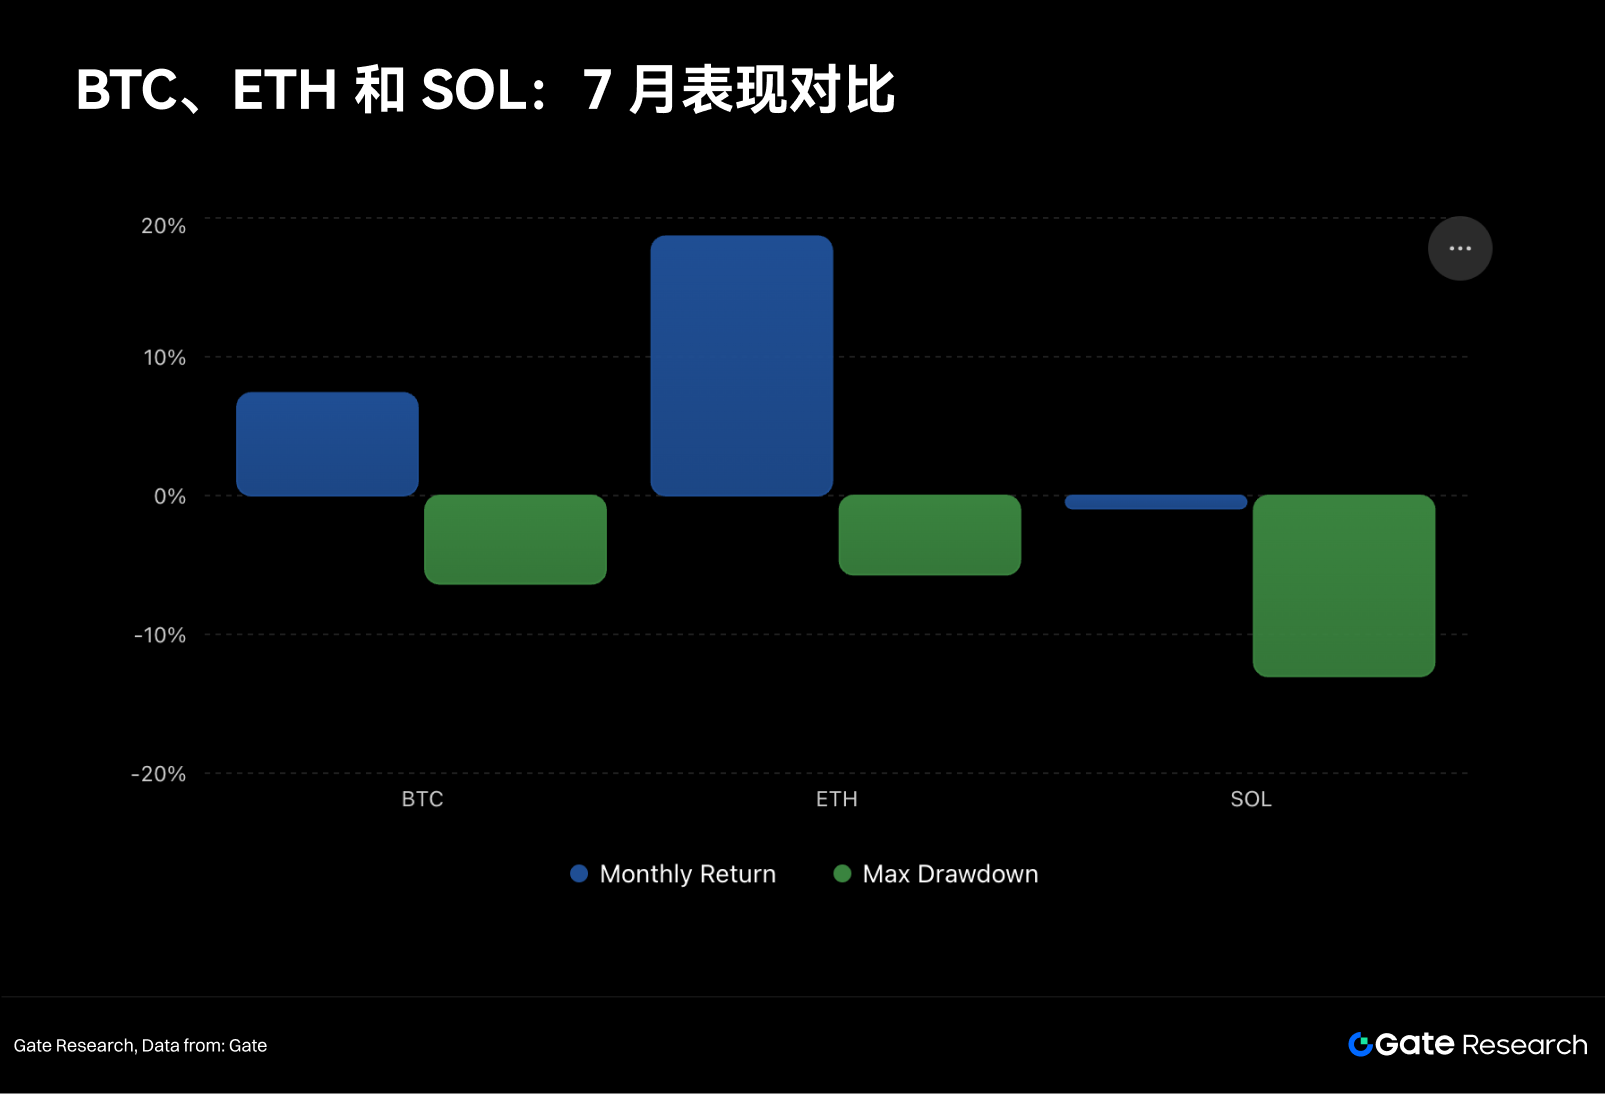
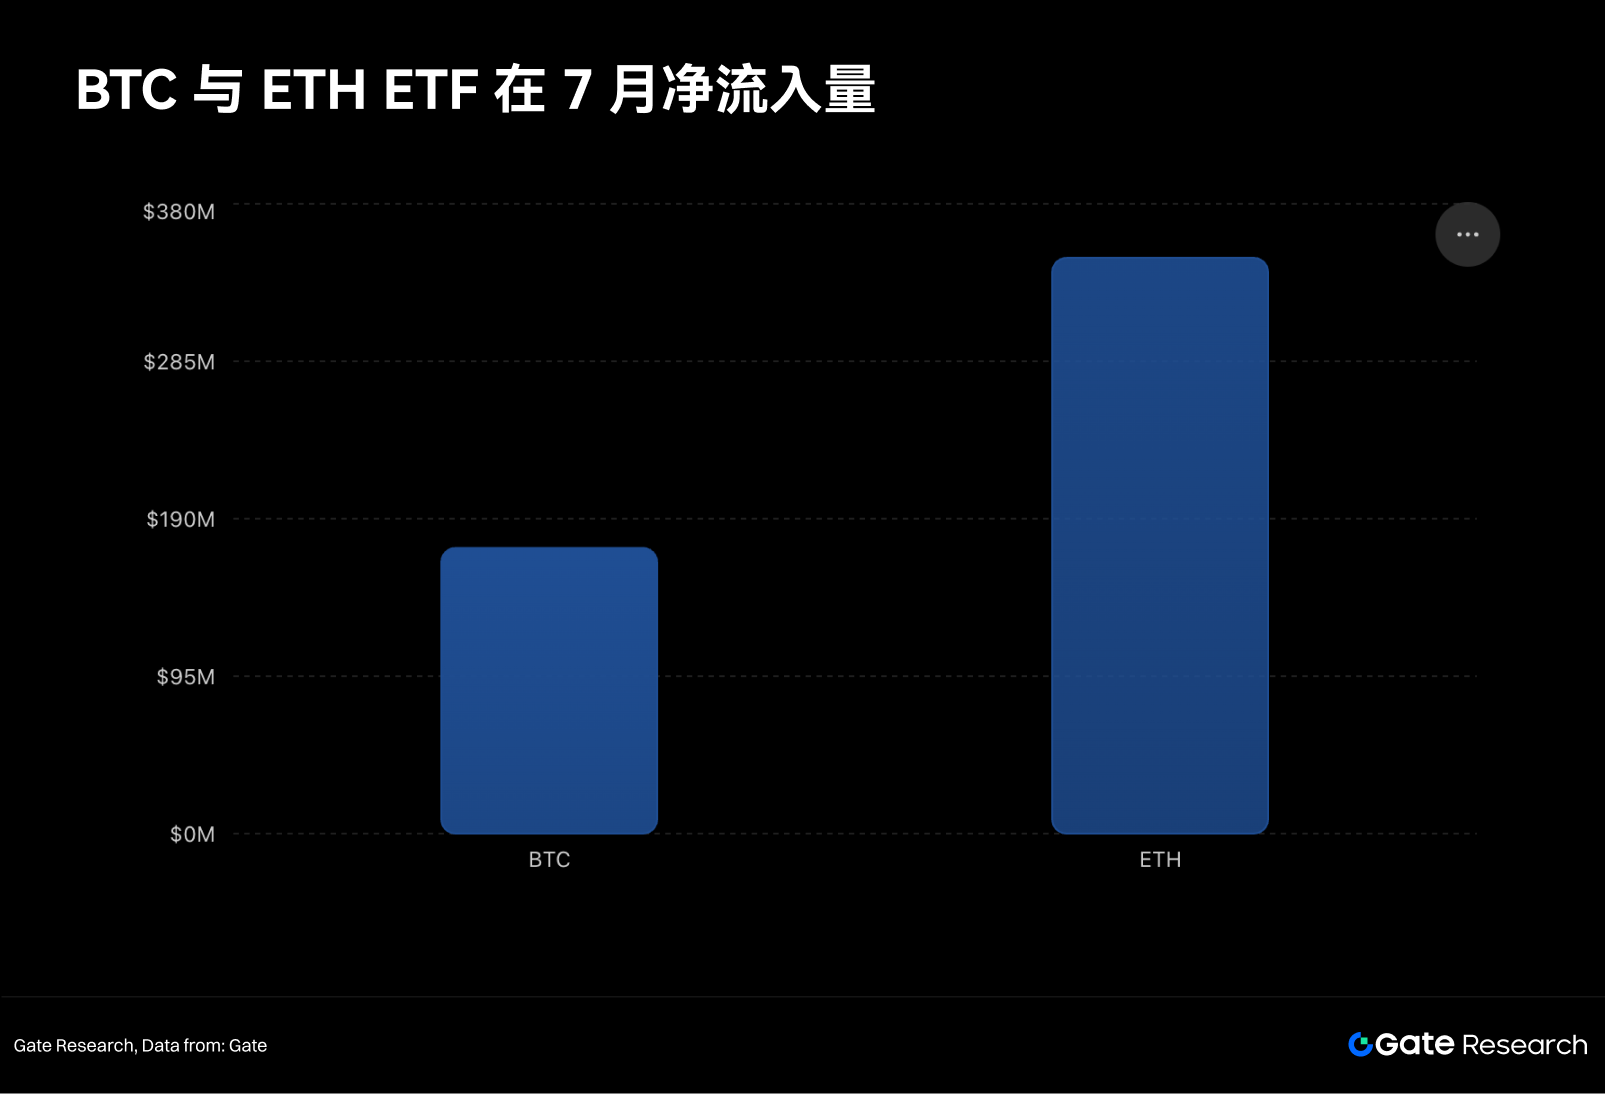
Bitcoin hit a monthly high of $66,803, then finished roughly 5.8% below it, with a maximum drawdown of 6.35%. Buyers managed to drag BTC out of the $58K area and back above $60K. Past that, around $66K, the push ran out of steam. Ethereum did better. Its monthly high-low amplitude reached 25.44%, and its maximum drawdown was just 5.7%, lower than Bitcoin's. The ETH/BTC ratio increased from 0.02680 to 0.02962, a 10.51% gain. U.S. spot ETH ETFs posted net inflows on 17 of 22 trading days for a total of $347.4M. Bitcoin ETFs brought in $172.4M, and the flow pattern was choppier.
Solana briefly tagged $83.39, but still closed the month down 0.93%, with a 13.02% max drawdown. That weak follow-through in SOL, a high-beta asset, points to something pretty specific: ETH strength looked more like a repricing of ETH itself, not a green light for the wider altcoin market.
Price Rhythm: From Panic Recovery to Late-Month Caution
On July 1, Bitcoin ETFs recorded a net outflow of $294.6M. That still looked like June de-risking hanging around. But on the very next day, inflows snapped back to $221.7M, and another $265.7M arrived on July 6. Big reversal. Fast too. Selling pressure at lower levels eased and buying stepped in, even if institutional demand still lacked consistency.
By the middle of the month, Bitcoin ETF flows had turned jumpy. July 13 brought the biggest single-day outflow, $424.7M. Then July 14 saw $181.1M in inflows. Across the seven trading days from July 14-22, combined inflows totaled about $999.4M, only for outflows to return on July 23-24 at $465.3M. So yes, the monthly net inflow was $172.4M. But that number hides the real story: repeated reversals tied to macro expectations and BTC price swings.
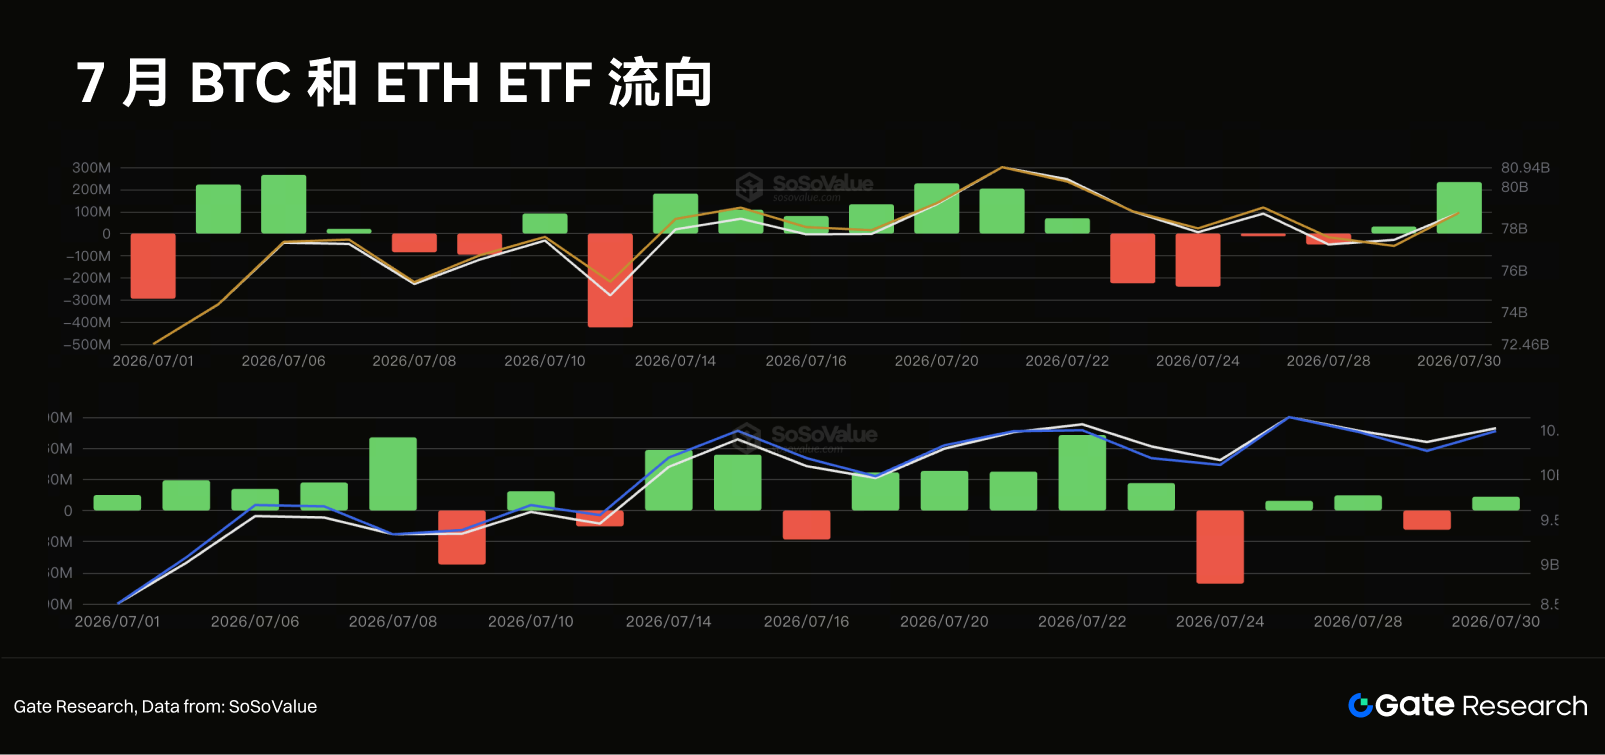
Ethereum ETFs were steadier. Over 22 trading days, net inflows reached $347.4M, and 17 of those days were positive. From July 14-23, cumulative inflows got to about $295.4M. Even a $70.7M outflow on July 24 did not really knock that trend off course. CoinDesk said that in the first three days of the week ending July 16, ETH ETFs took in $96M, while BlackRock's ETHA and ETHB absorbed about $49.3M of the $53.8M on July 15. That suggests ETH is pulling in fresh money through regulated channels. But concentration in a small number of products means the data should not be stretched too far.
ETH also got help from on-chain narratives. Robinhood Chain launched on July 1, used ETH for gas, and settled to Ethereum. Daily DEX volumes there topped $800M, mostly driven by meme trading. Not the whole reason ETH rose. Still, it added activity around Ethereum.
On July 29, the Federal Reserve kept rates unchanged at 3.5%-3.75% in a 9-3 vote, saying the economy was still expanding while inflation remained above the 2% target. Three members voted for a 25-basis-point hike. So, no immediate tightening. But no dovish wink either. Attention shifted right back to inflation and energy prices.
Month-end ETF flows showed that caution. Bitcoin ETFs saw $233.1M in inflows on July 30, then $265.4M in outflows on July 31. BTC closed below its monthly high, which fit the Fed's mixed message.
Derivatives and Spot: How Deleveraging Changed Market Quality
A rally that lasts needs spot demand, not just borrowed heat. By July 16, perpetual swap funding rates were hovering near zero, which showed crowded long positioning had been flushed out. That cuts the odds of cascading liquidations. But near-zero funding, by itself, does not create a rally. You still need new buyers. Simple as that.
July's rebound leaned mostly on spot. Bitcoin ETFs logged $172.4M in net inflows, though daily flows were volatile. Ethereum ETFs posted $347.4M and did so with more consistent daily inflows. Solana ETFs existed, but flows stayed small and never backed a lasting rebound.
That is different from the classic contract-led move, where open interest jumps fast, funding rates rise, and prices break out quickly. July looked more like spot demand and ETF subscriptions doing the work, not leverage.
Quantitative Validation: Trend Strategy's Value Is Drawdown Control
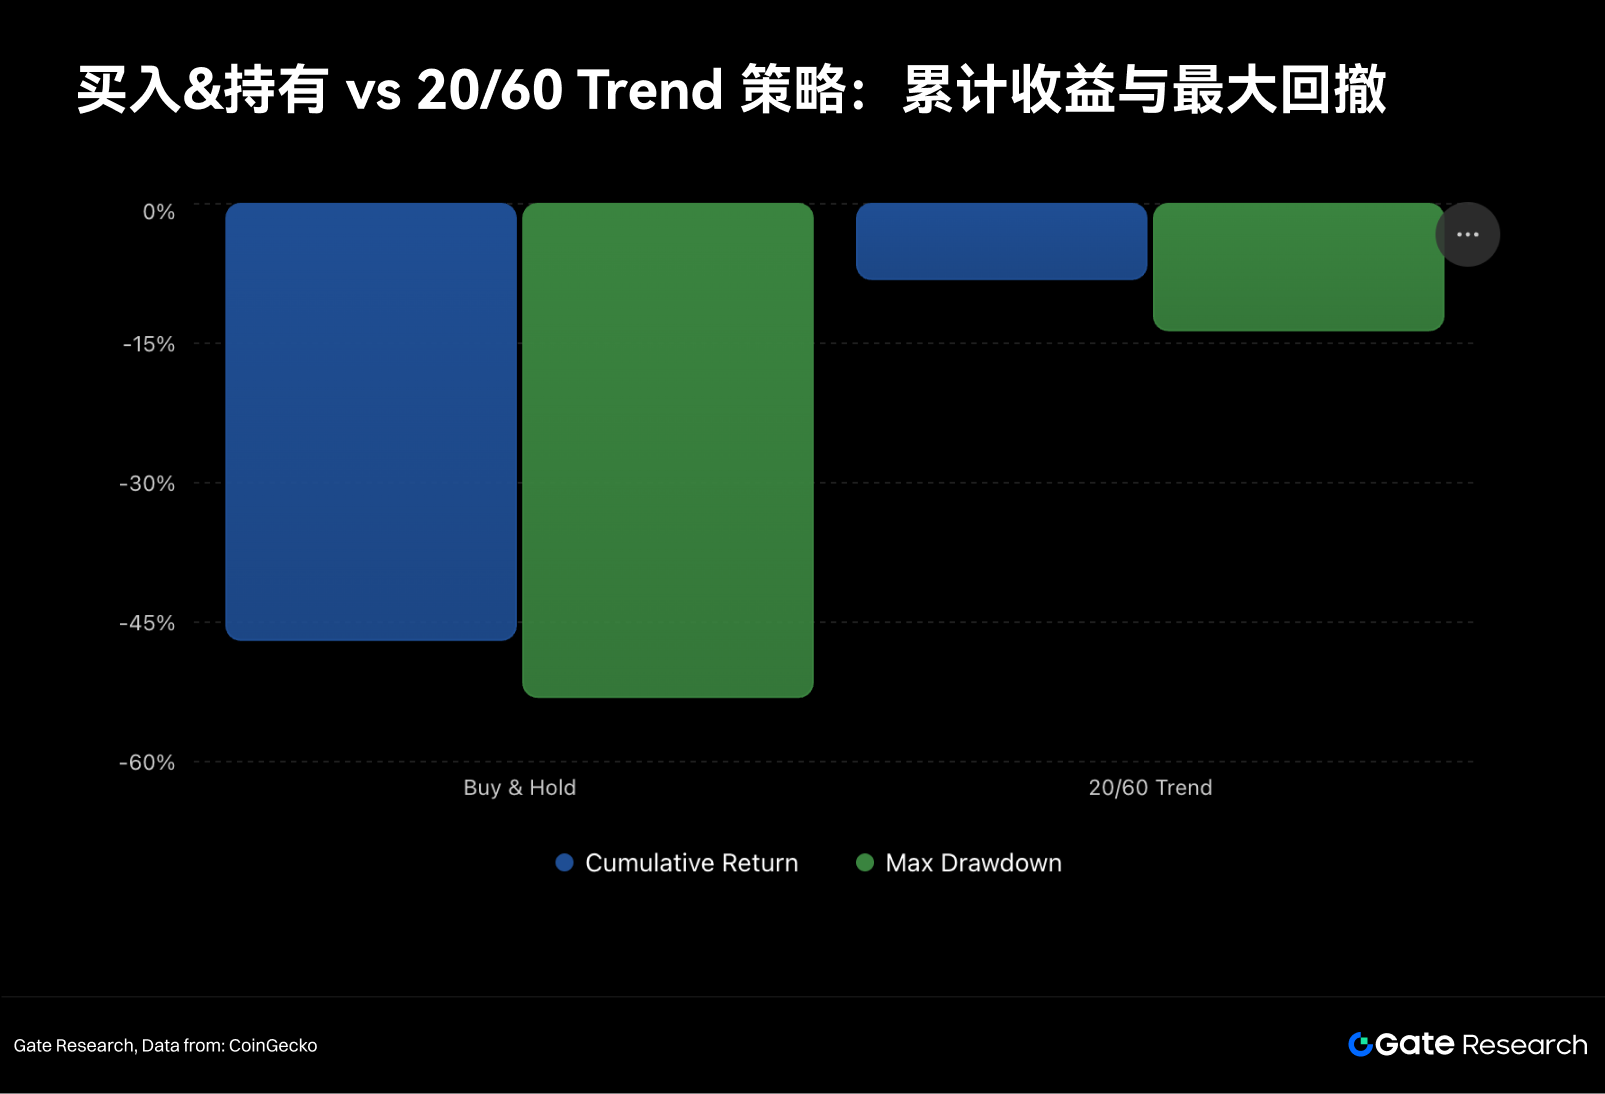
Take a basic trend filter for BTC spot: hold BTC when the previous day's close is above the 60-day moving average and the 20-day MA is above the 60-day MA; otherwise hold cash. Signals are executed with a one-day lag, and one-way cost is 10bp. The sample uses 365 daily returns from CoinGecko.
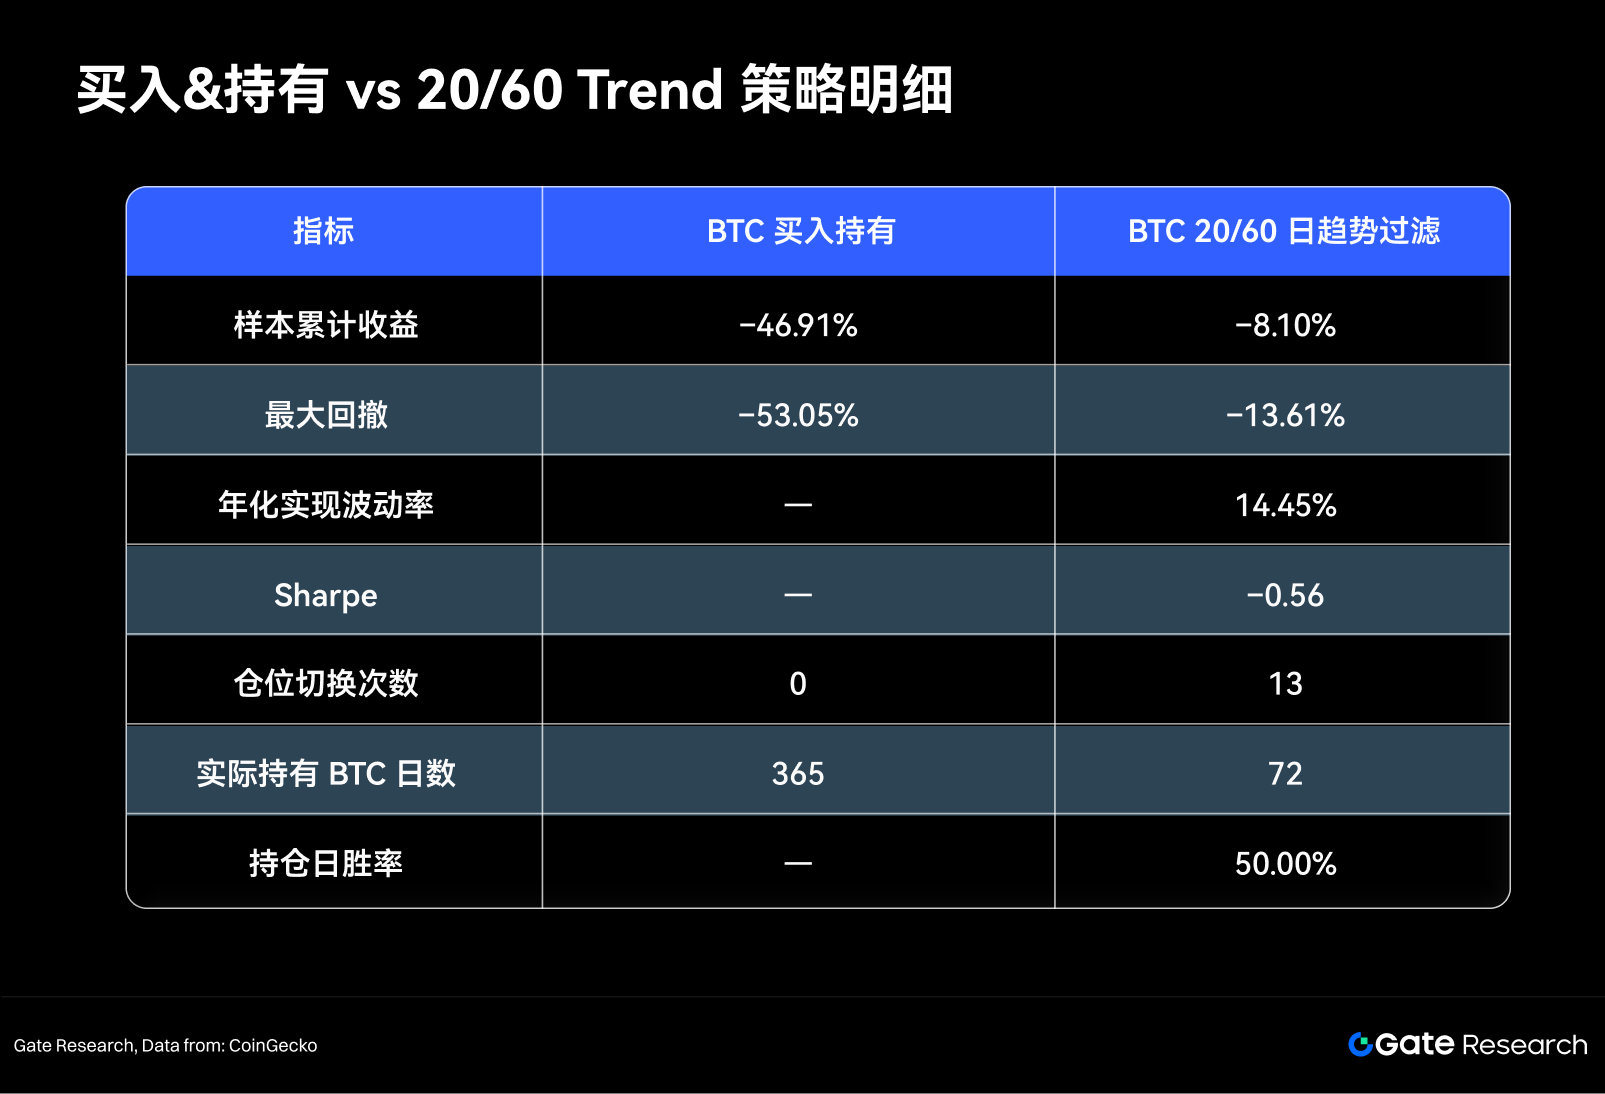
The strategy produced 13 position switches, creating 130bp in friction costs. If costs rose to 25bp, cumulative return would fall from -8.10% to about -10.05%. But the real number that matters here is drawdown. Buy-and-hold suffered a maximum drawdown of 53.05%; the strategy cut that to 13.61%, an improvement of 39.44 percentage points. Cumulative loss dropped from 46.91% to 8.1%.
BTC was held on only 72 of 365 days. It did not catch every move. It just stayed out when the trend looked bad. In July, direct BTC holding returned 7.39% but came with a 6.35% drawdown. The trend filter would have waited for confirmation.
For ETH, applying the same setup mechanically makes less sense. A better framework is this: first use BTC trend to judge broad market risk, then look at ETH/BTC and multi-day ETH ETF flows before adding ETH, and only after that watch SOL and altcoin breadth. In July, the first two layers got better. The third did not. That's the gap.
August and Beyond: Three Key Signals to Watch
At the time of writing, BTC was near $63,740, still below the July high of $66,803. The bounce from June weakness is in motion. Whether it turns into a real uptrend will depend on three signals.
First, Bitcoin has to lock in a stable medium-term uptrend, with price above the 60-day MA and the 20-day MA above the 60-day MA. If BTC keeps wobbling below $66K and the moving averages bunch together, then July may have been just a repair. Second, ETH needs to keep beating BTC. The ETH/BTC ratio went from 0.02680 to 0.02962 in July; if it slides back toward early July levels and ETH ETF cumulative flows turn negative, the basis for ETH's relative strength is fading. Third, money has to start moving into altcoins. The altcoin season index sits at only 43, and SOL finished the month negative, so breadth across altcoins is still weak.
Those three signals trace a pretty direct capital path: BTC trend confirmation → ETH relative strength → altcoin spread. July got to step two, not step three. If all three improve, the market can carry more risk. If BTC softens or ETH/BTC and ETF flows worsen, risk should come down. And macro can still wreck the setup—inflation, energy prices, Fed hawkishness.
Conclusion
July was a layered recovery. Bitcoin rebounded from June's selloff and got back above $60K. Ethereum outperformed, helped by steady ETF inflows and a rising ETH/BTC ratio, with on-chain activity from Robinhood Chain adding support. Solana lagged and posted the larger drawdown. Capital came back to core assets. It did not fan out into high-volatility altcoins.
Derivatives leverage cooled and funding rates stayed near neutral, which made the move more spot-led and steadier, though still dependent on continued buying to extend higher. The trend-following strategy's big advantage was drawdown control, cutting maximum drawdown from 53.05% to 13.61%. The roadmap is straightforward: confirm BTC trend, then ETH relative strength, then altcoin breadth. July managed only the first two.