



Gate Research said U.S., Japanese, South Korean and Hong Kong equities are all shaped by the same global backdrop of growth, rates, trade policy and geopolitical risk, but the sources of earnings behind each market remain different. In the report, U.S. equities are framed around profit growth and technology investment, Japan around capital efficiency and monetary normalization, Korea around the semiconductor cycle, and Hong Kong around Chinese corporate earnings, capital flows and risk premia.
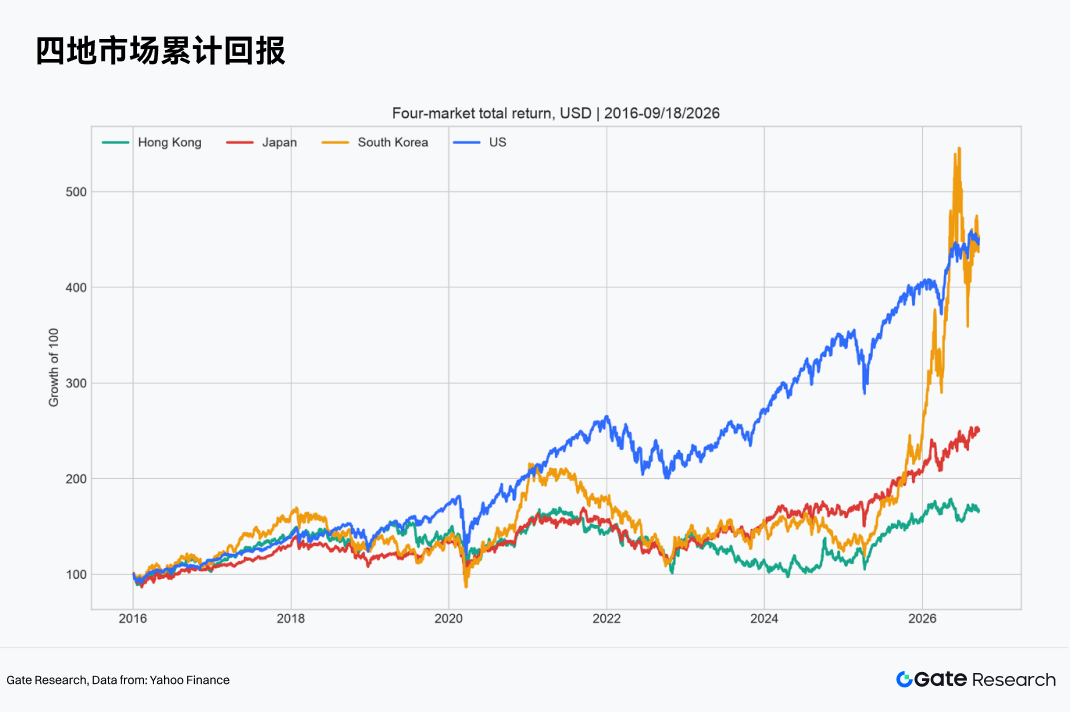
The study also says cross-market allocation can broaden return sources, but it does not automatically improve returns or eliminate drawdowns. Since 2016, U.S. equities delivered the strongest risk-adjusted performance in the sample. Korean equities offered more cyclical upside but came with much higher volatility and deeper drawdowns. Japanese equities added some diversification value, while Hong Kong equities went through a longer valuation repair cycle.
Shared global shocks, different earnings engines
Citing the International Monetary Fund's July 2026 projections, the report said the global economy is expected to grow 3% in 2026 and 3.4% in 2027. The IMF forecast U.S. growth at 2.3% in 2026 and China at 4.6%. Energy shocks, trade policy and geopolitical risks are weighing on overall growth, while technology investment in North America and Asia is providing a partial offset.
Gate Research said those macro forces reach each market through different channels. Large U.S. technology companies are absorbing artificial intelligence-related capital spending, with global revenue exposure and high margins acting as an earnings buffer, though elevated valuations also raise the bar for execution. Japanese equities sit at the intersection of nominal growth, corporate governance reform and monetary normalization, with operating improvement and yen moves jointly shaping returns for overseas investors. Korean equities are more sensitive to memory-chip prices, server investment, export orders and foreign flows. Their profit elasticity comes from higher operating leverage, which also means earnings can contract quickly when the cycle turns. Hong Kong-listed companies are closely tied to China's economy, while U.S. dollar financial conditions affect discount rates, leaving earnings expectations and risk premia to move prices at the same time.
The report assigns a distinct portfolio role to each market: U.S. equities provide exposure to sustained earnings and innovation, Japan offers capital-efficiency improvement and rate-normalization exposure, Korea gives investors access to the global semiconductor cycle, and Hong Kong offers China exposure, dividends and valuation-repair potential. Putting the four markets into one portfolio, it said, starts with judging whether those return drivers are complementary, then matching capital to valuations.
For the comparison, Gate Research selected SPY, EWJ, EWY and EWH, four U.S.-listed, dollar-denominated country or regional ETFs, and used adjusted prices to calculate total returns in U.S. dollars. The report said that format captures dividends, fund fees, tracking error and currency moves, making it closer to the actual holding experience of overseas investors and USDT-based capital. It added that even though EWH trades in dollars, the underlying Hong Kong companies are still influenced by Hong Kong dollar rates, Chinese demand and regional capital flows.
The report said daily tracking should place equities back into a broader cross-asset setting. Through Gate TradFi's interface for stocks, indices, foreign exchange and precious metals, investors can use indices to confirm regional trends, use pairs such as USD/JPY to separate equity returns from currency effects, and use gold to gauge demand for safety. Cross-asset prices can help validate macro views, though company earnings and balance sheets still need to be studied on their own.
Valuation gaps reflect different constraints on earnings, capital and governance
Gate Research said cross-market valuation comparisons often fall into the trap of static multiples. Higher U.S. index valuations are linked to sector mix, earnings stability, shareholder returns and global revenue capacity. Lower Hong Kong valuations reflect cyclical sector weights, risk premia, earnings visibility and investor structure. Japan and Korea sit between the two, but each is shaped by its own currency and cycle. Price-to-earnings differences, the report said, already embed judgments about growth duration, cost of capital and governance quality, so they cannot be read in isolation from earnings structure.
For U.S. equities, the key question is whether earnings can catch up with valuations. If an index rises while 12-month forward earnings estimates are revised higher, profit growth can gradually absorb valuation pressure. If prices rise mainly because multiples expand, higher long-end yields can amplify the downside. When looking at large technology companies, the report said investors should compare capital spending, depreciation, cloud revenue and free cash flow. AI spending counts as growth investment when it lifts revenue or customer retention. If revenue realization is slow while depreciation rises quickly, margins come under pressure.
For Japan, the report said the test is whether governance reform can change operating efficiency. A low price-to-book company that only raises one-off dividends may see a short-lived valuation improvement. If it also cuts cross-shareholdings, exits low-return businesses and lifts return on invested capital, shareholder returns and operating quality can improve over a longer cycle. Banks may benefit from rate normalization, but they also face credit costs and bond-portfolio volatility. Exporters gain from a weaker yen, while domestic-demand companies rely more on wage growth and household purchasing power.
Korean valuations, the report said, usually move with the earnings cycle. When semiconductor profits are near a trough, static P/E ratios can look high because the denominator has already shrunk. Near a cycle peak, the same multiples can look low. Valuation work therefore needs to include inventories, capacity utilization, product pricing, capital spending and normalized profits across different phases. Demand for high-bandwidth memory expands the industry's structural growth room, but supply expansion still determines how long margins can hold.
Hong Kong's discount reflects growth, governance, liquidity and geopolitical factors, according to the report. Better margins at internet platforms, buybacks and free cash flow can narrow part of that discount. Dividends from banks, telecom operators and energy companies provide carry, but payout capacity depends on cash flow and capital constraints. Policy support that does not feed into revenue, profit and capital inflows can leave valuation repair stuck at the trading stage. The report said investors need to watch earnings revisions, southbound flows, overseas institutional allocation and turnover together. When all four improve, the quality of the rally is stronger than in a move driven by a single policy event.
Capital flows also matter in different ways across the four markets. The U.S. market has a large passive base, and market-cap weighting reinforces leadership by the biggest names. In Japan, overseas money is sensitive to currency moves and governance reform. Korea is influenced by global technology positioning and foreign risk budgets. Hong Kong absorbs both international capital and mainland Chinese money. Flows do not explain all fundamentals, the report said, but they do affect how quickly earnings changes show up in prices.
Since 2016, U.S. and Korean returns were similar, but the path was not
The report said annualized returns since 2016 were close for U.S. and Korean equities, at 14.95% and 14.87%, respectively, but the route to those returns was very different. SPY posted annualized volatility of 17.73% and a maximum drawdown of 33.72%. EWY's annualized volatility reached 29.42%, with a maximum drawdown near 49.73%. Similar ending values did not translate into similar risk-adjusted outcomes. SPY's Sharpe ratio was 0.88, versus 0.62 for EWY. Gate Research said Korea can add cyclical upside to a portfolio, but it requires tighter position limits and clearer exit rules.
Japan's EWJ delivered positive returns and some diversification value, though long-run performance still lagged the U.S. The report linked that gap to sector structure, earnings growth and currency effects. EWJ posted an annualized return of 8.77% and a maximum drawdown of 33.14%. Governance reform can improve the market's appeal, it said, but it does not remove losses tied to global recessions and liquidity shocks.
Hong Kong's EWH returned 4.66% annualized, with annualized volatility of 19.44%, a maximum drawdown of 42.71% and a Sharpe ratio of just 0.33. The report said low valuations did not turn into stable risk-adjusted returns. Without support from earnings improvement, cash distribution and capital inflows, valuation discounts can take much longer to close. Hong Kong still has a role in portfolios, but the report said it is better approached through a mix of earnings confirmation, trend validation and sector selection.
A daily return correlation matrix showed that the four markets share global risk factors while retaining regional differences. Correlation alone is not enough to remove systemic drawdowns, especially during liquidity shocks, when correlations often rise together. Diversification helps reduce dependence on a single industry or a single policy path, the report said, but it does not guarantee protection in a crisis.
Once the comparison moves into actual trading, the report said the latest prices and trading activity can help identify short-term conditions, while daily and weekly candlesticks can be used to validate trends and drawdowns. Those checks can be done on Gate TradFi instrument pages. A one-day gain is not enough to support a medium-term view. Price signals become more credible when weekly direction, earnings expectations and sector catalysts line up.
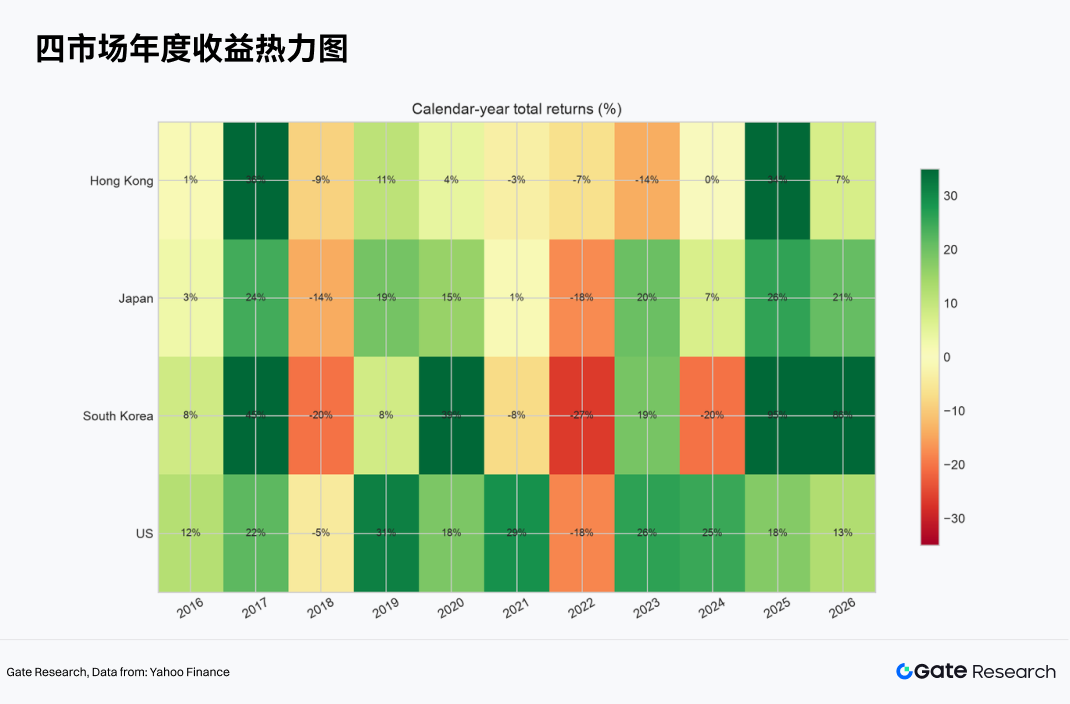
The report added that annual return tables also show market leadership is not fixed. In strong years, performance gaps are often driven by a mix of industry cycles, currency moves and valuation repair. In weak years, markets may all fall together, but the ranking of losses is not stable. A portfolio that simply chases the previous year's winners can end up adding risk near the top of a cycle. A steadier method is to break annual performance into earnings changes, valuation changes and currency changes, then test whether those drivers can continue.
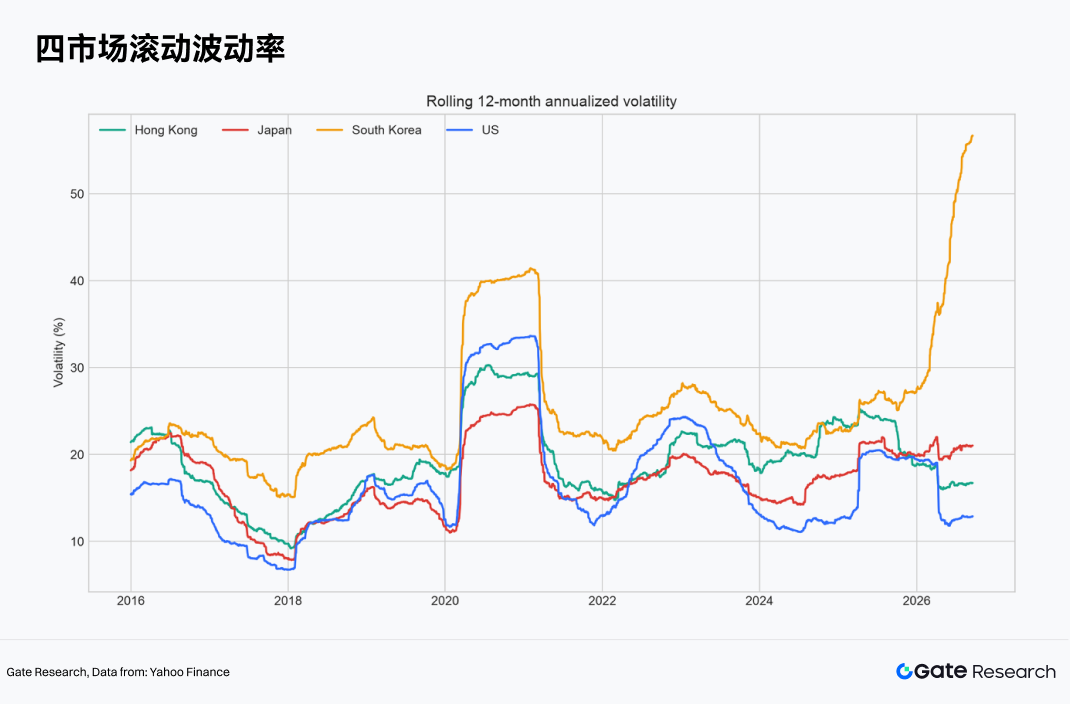
Rolling volatility data showed that risk changes with market conditions. Korea has structurally higher volatility, and the gap widens when the semiconductor cycle shifts quickly. Hong Kong can also see volatility spikes when policy and growth expectations are repriced. U.S. and Japanese long-run volatility are closer to each other, though both still rise in crises. Fixed weights can let portfolio risk drift with market conditions. Inverse-volatility allocation can cut exposure to high-volatility assets, but it can also miss part of their upside.
U.S. equities lean on earnings compounding, Asia leans more on cycles and repricing
Gate Research said the long-run edge in U.S. equities comes from the combination of corporate earnings, shareholder returns and index-refresh mechanics. Large technology platforms, semiconductor companies and high-quality service firms generate strong free cash flow, while market-cap weighted indices automatically raise the weight of winners. That improves long-run efficiency, but it also concentrates leadership. If AI-related capital spending turns into cloud revenue, software payments and productivity gains, high valuations can be absorbed by earnings growth. If returns on that spending disappoint, the index can face both earnings downgrades and multiple compression.
To analyze U.S. equities, the report said investors should watch the gap between capital-spending growth and revenue growth, free-cash-flow coverage, market breadth and equal-weight index performance. If the broad market rises on the back of only a few companies, core exposure can remain in place, but new money should be deployed more carefully. If earnings upgrades spread to industrials, financials, software and smaller companies, the structure of the rally is healthier.
On Gate TradFi, the report said the U.S. market can be viewed in three layers: broad benchmarks, technology sectors and the largest weighted companies. If the benchmark rises while most stocks weaken, concentration risk inside index exposure is increasing. If earnings upgrades at the leaders pull more sectors higher, the broad-market signal has wider support. The platform serves as the market and trading entry point, while layered observation helps determine whether positions should follow index moves.
For Japan, the report focused on whether governance reform can create per-share value growth. Buybacks and dividends can improve shareholder returns, while asset sales, lower cross-shareholdings and exits from low-return businesses affect long-term capital efficiency. The Tokyo Stock Exchange continues to publish official data on turnover, market value and yields, giving investors a way to test reform progress. Rate normalization can help bank net interest margins, but it can also pressure high-valuation stocks and raise financing costs. A weaker yen helps exporters when profits are translated back, but it also raises the cost of imported energy and raw materials. The report said risk inside Japan should be spread across financials, industrials, exporters and domestic-demand names.
It also said the first batch of roughly 300 Japanese stocks added to Gate's stock system covers markets including the Tokyo Stock Exchange Prime segment, with names such as Toyota, Sony, SoftBank Group, Mitsubishi UFJ Financial, Nintendo and Tokyo Electron. Those listings line up with the main research themes in Japan: autos and electronics reflect the export cycle, banks reflect rate normalization, gaming and internet names reflect global consumer demand, and semiconductor equipment links back to AI capital spending. That allows an index view to move down to the company level and test whether gains are being driven by currency translation or by better operating returns.
Korean equity returns are highly dependent on the semiconductor cycle, the report said. AI servers are lifting demand for high-bandwidth memory, while chip prices, inventories and capacity utilization jointly determine profit elasticity. Share prices often move ahead of financial statements, so relying only on reported earnings can miss turning points. The report said investors should track memory pricing, Korean semiconductor exports, corporate inventory days, capital-spending guidance and major customer orders at the same time. Official EWY materials show the ETF provides exposure to Korean large- and mid-cap stocks, and its three-year historical volatility is clearly above that of broad developed-market benchmarks, matching the report's longer-run backtest results.
In practical market observation, Gate TradFi can help distinguish whether index moves in Korea are being driven by semiconductor leaders alone or by broader improvement across autos, batteries, financials and consumer sectors. If gains are concentrated in a few heavyweights, broad-market exposure still carries substantial single-industry risk. If strength spreads across sectors, the report said, export momentum is starting to feed into a wider set of corporate earnings.
Hong Kong pricing is shaped by Chinese corporate earnings, U.S. dollar rates and investor risk premia at the same time. Statistics from Hong Kong Exchanges and Clearing show that Hong Kong ranked among the world's leading exchanges by IPO fundraising in 2025, suggesting a recovery in primary-market financing. Whether the secondary market can generate sustained returns still depends on platform-company revenue and buybacks, cash-flow coverage at high-dividend companies, and the stability of Chinese consumption and the property chain. Internet platforms, high-dividend sectors and macro-cyclical sectors each have different cash-flow profiles and risk sources, so the report said they should be monitored with separate signals and risk budgets.
For Hong Kong names on Gate TradFi, the report recommended building separate watch groups for internet platforms, high-dividend financials and cyclical sectors, rather than using the Hang Seng Index as a single summary of the market's internal structure. Candlestick charts can confirm whether prices are forming a medium-term trend, but earnings, buybacks and dividend capacity still need to be verified through company disclosures. In that setup, platform prices become evidence in the research chain rather than a substitute for fundamentals.
Cross-market transmission exists, but independent cycles remain
The report said U.S. technology capital spending and Korean semiconductor earnings are linked through demand and supply. More server investment by cloud platforms can lift demand for high-bandwidth memory and advanced packaging, but chip-company profits still depend on supply discipline, yields and product mix. A rally in U.S. technology stocks does not guarantee a parallel move in Korea. The signal is only complete when capital spending, chip prices and export volumes improve together. Holding both markets in one portfolio can increase exposure to the AI factor, the report warned, meaning apparent country diversification may still hide industry concentration.
The relationship between Japanese equities and the yen is more split by sector. Yen weakness boosts translated export revenue, but it also raises the cost of imported energy and raw materials. Yen strength can help dollar-based investors through FX translation, but it may also weigh on exporter profit expectations. The report said EWJ should be analyzed by separating local equity performance from currency contribution. If Japanese stocks rise in local terms but look flat in dollars, overseas returns may have been offset by FX. If both the yen and equities rise together, that often points to foreign inflows or stronger recognition of domestic-demand and governance themes.
Hong Kong, meanwhile, is exposed to both U.S. discount rates and China's earnings cycle. Higher U.S. rates raise the discount rate applied to Hong Kong equities, while slower Chinese growth lowers earnings expectations. When both move in the same direction, valuations and profits can contract together. If U.S. rates fall while Chinese earnings remain stable, Hong Kong has room for valuation repair. If rates fall because of a global recession, lower discount rates may not offset earnings downgrades. Rate direction only becomes useful when it is analyzed together with the reason for the growth move, the report said.
Correlations across the four markets create room for diversification in calm periods, but they can rise in crises. Trend filters allow a portfolio to reduce exposure to weaker assets, lowering reliance on stable correlations. Even so, allocation models still need to identify repeated factors: SPY and EWY may both be exposed to AI investment, EWJ and EWY may both be tied to global manufacturing, and EWH remains closely linked to Asian consumption and China's credit cycle.
Backtests: diversification is not a substitute for selection, rotation changes the risk path
Gate Research tested three cross-market strategies and used buy-and-hold SPY as the benchmark. The equal-weight strategy allocated 25% to each of the four markets every month. The inverse-volatility strategy used the past 60 trading days of volatility, with a 50% cap on any single market. The trend-rotation strategy calculated 10-month momentum at month-end and held only the top two assets that were also above their 200-day moving averages, with unselected capital left in cash. All signals were executed on the next trading day, and one-way trading costs were set at 10 basis points. The report said no future data were used and no parameters were adjusted for any single crisis.
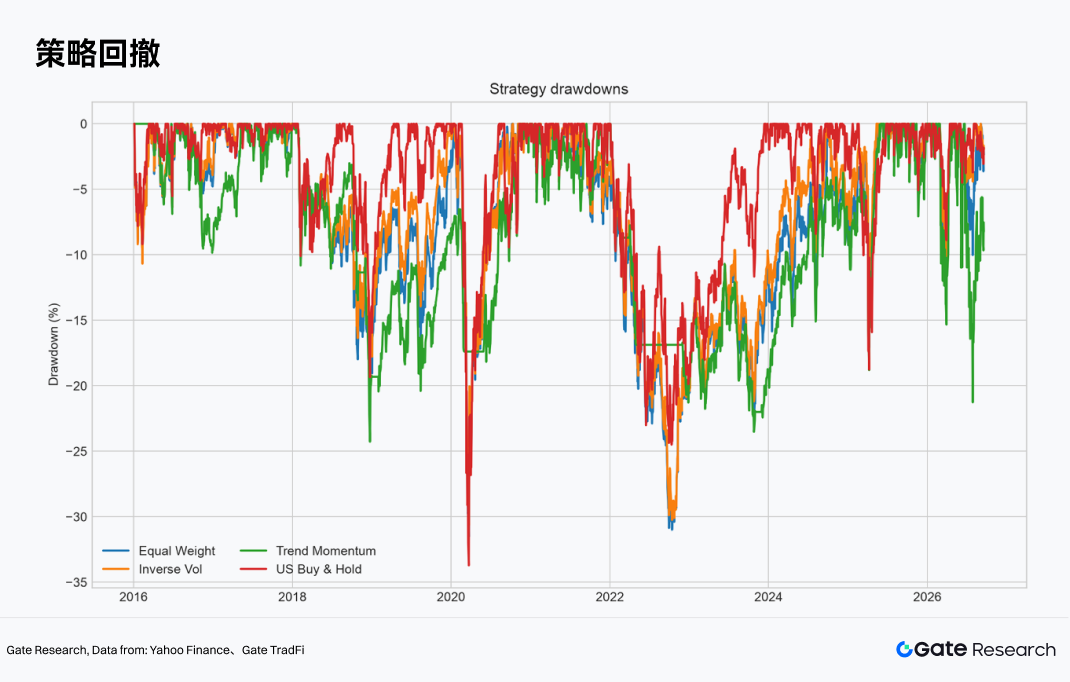
The equal-weight strategy did not beat U.S. equities. Its value, the report said, lies in spreading single-country risk across four return sources. The inverse-volatility strategy reduced annualized volatility to 16.68%, but annualized return also fell to 11.08%. Because volatility control only reacts to price movement and does not judge whether an asset is in a long-term weak phase, it can end up increasing the weight of low-volatility, low-return markets.
The trend-rotation strategy produced a 12.1% annualized return over the full sample, below buy-and-hold SPY, but cut maximum drawdown to 24.27% and lifted the Calmar ratio to 0.50. Average annual turnover was about 491%, making trading costs and execution quality important in live trading. If actual spreads, slippage and financing costs are higher than assumed, returns will fall. The report said the strategy is better treated as a risk-management layer than as a return enhancer that can reliably beat a single strong market.
In the sub-sample since 2021, trend rotation delivered a 15.06% annualized return with a 23.52% maximum drawdown. Over the same period, SPY returned 14.82% annualized with a 24.50% maximum drawdown. Equal-weight and inverse-volatility strategies returned 11.55% and 10.66%, respectively. The report said trend rotation benefited in that period from Korean market strength and shifts in market leadership, but the sample is still too short to confirm persistent long-term excess returns.
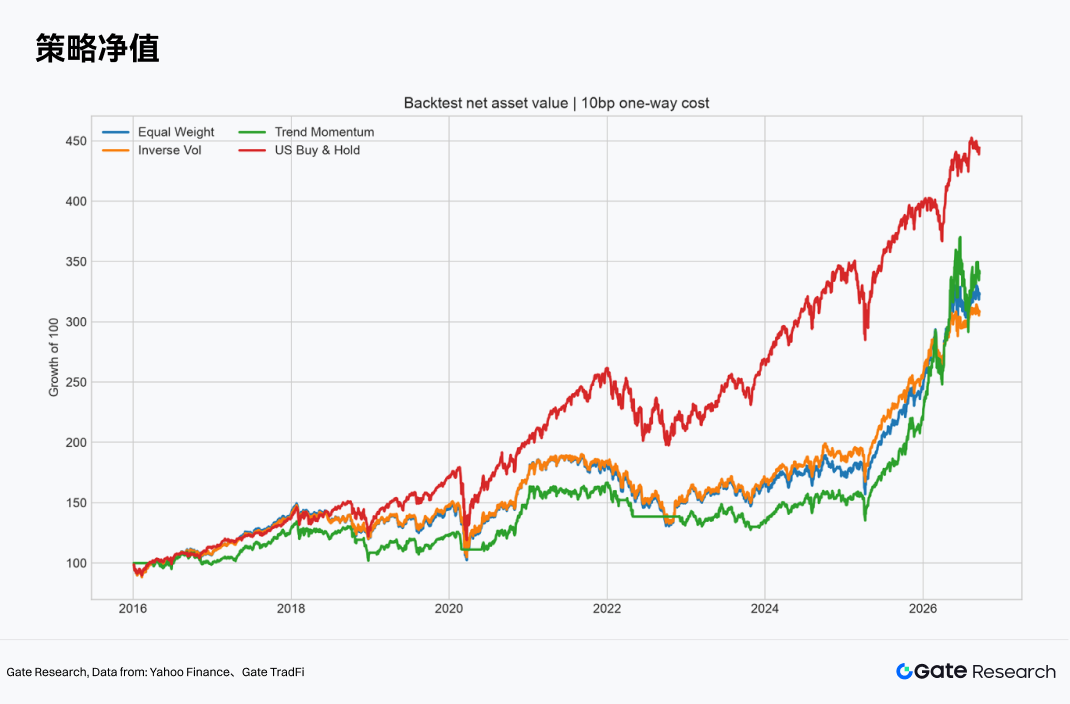
Drawdown charts showed that fixed allocation cannot fully avoid losses during global liquidity shocks. Equal-weight and inverse-volatility strategies hold all markets, so their risk reduction mainly comes from different weights. Trend rotation can cut exposure after monthly signals weaken, but it cannot avoid the first leg of a decline before confirmation. In a fast drop followed by a sharp rebound, the strategy can also exit near the lows and re-enter late, creating losses on both sides.
The report said the 200-day moving average and 10-month momentum have an economic rationale: the first gauges medium- to long-term trend, the second compares relative strength across markets. But parameter choice still carries risk. Shorter moving averages react faster and trade more often, while also generating more false signals. Longer averages filter noise but delay exits. Using a 150-day, 200-day or 250-day moving average can change local outcomes. Before deployment, the report said investors should test whether nearby parameter choices produce similar directional results. If returns are concentrated in one narrow parameter set, the strategy lacks stability.
Trading costs matter a great deal for trend rotation. With average annual turnover near 491%, every additional 10 basis points of one-way cost erodes long-term compounded returns. The ETF backtest also does not include the spreads, financing fees or trading-hour differences of specific Gate TradFi products. After each rebalance signal, the report said users should first verify prices and spreads through the platform ticker, then use candlestick charts to check whether the signal is affected by time zones or closing-price conventions. If CFDs or perpetual contracts are used for multi-month holding periods, financing costs may exceed spot ETF management fees. If stocks or ETFs are used instead, market holidays and settlement rules can affect rebalancing.
The report added that out-of-sample results cannot prove a strategy will keep leading in the future. The stronger showing by trend rotation since 2021 was tied to a phase of Korean market strength and changes in market leadership. The sample includes only a limited number of full macro cycles and does not cover every inflation, war, regulatory or technology cycle. Gate Research said trend rotation is best treated as a disciplined position-management method, not as a direct return target.
Scenario analysis and portfolio structures
In its base case, the report assumes low-speed global growth, resilient U.S. technology investment, continued nominal growth in Japan, expanding semiconductor demand and gradually stabilizing Chinese corporate earnings. Under that setup, U.S. equities keep the core weight, Japan and Korea provide cyclical and industry diversification, and Hong Kong combines high-dividend names with platform leaders. The portfolio goal, the report said, should be to capture multiple return sources while avoiding excessive overlap in AI supply-chain exposure.
In an upside growth scenario driven by better global manufacturing orders, broader technology investment and a recovery in Chinese demand, Korean equities would usually show the strongest earnings elasticity. Japanese industrials and Hong Kong cyclical and consumer sectors could also benefit. The report said Asian weights can be raised in that phase, but chip inventories and corporate capital spending still need to be watched to avoid chasing late-cycle supply expansion.
In an inflation-and-rates-up scenario, high-valuation assets would come under pressure, while energy-importing economies would also face cost strain. The report said portfolios should reduce exposure to long-duration growth stocks and highly leveraged products, while raising allocations to cash, high-dividend companies and businesses with stable margins. Within the U.S., that means shifting from expensive growth toward quality and cash flow. In Japan, it means adding financials and trimming expensive export growth. In Korea, it means controlling semiconductor momentum chasing. In Hong Kong, it means checking dividend coverage and liability structure first.
In a recession scenario, lower rates do not automatically help equities because earnings downgrades may arrive before valuation repair. Trend signals can help reduce overall equity exposure, while fixed equal-weight portfolios need an added drawdown budget. The report gave an example framework: if the portfolio falls 10% from its peak, stop adding new risk positions; if the drawdown reaches 15%, cut high-volatility market weights by one-third; rebuild exposure only after prices recover above medium-term averages and earnings expectations stabilize.
The report also outlined three investor profiles. A conservative portfolio would hold 35% U.S. equities, 20% Japan, 10% Korea, 20% Hong Kong and 15% cash and defensive assets. A balanced portfolio would hold 40% U.S., 20% Japan, 20% Korea and 20% Hong Kong. An aggressive portfolio would hold 40% U.S., 15% Japan, 25% Korea and 20% Hong Kong. Those weights are only starting points for risk budgeting, the report said, and actual allocations still need to be adjusted for trend, volatility and product costs.
Implementation discipline and baseline allocation
In its concluding allocation framework, Gate Research said the four-market mix should be built around sources of return. U.S. equities keep the core role for high-quality earnings and technology innovation. Japan serves as an allocation to capital-efficiency improvement and the yen cycle. Korea acts as an enhanced position when semiconductor conditions improve. Hong Kong provides valuation-repair exposure through high dividends, better platform profitability and policy-sensitive assets. Equal-weight suits investors who want systematic diversification, inverse-volatility suits those who prioritize lower portfolio volatility, and trend rotation suits those who can tolerate higher turnover and follow rules strictly.
The baseline portfolio in the report starts with 40% U.S. equities, 20% Japan, 20% Korea and 20% Hong Kong, with monthly reviews and quarterly rebalancing. If a market falls below its 200-day moving average and its 10-month momentum turns negative, its weight can be cut in half. If it also drops out of the top two momentum rankings across the four markets, the remaining risk budget can be moved into cash or defensive assets. The maximum weight for any single market is set at 50%, and Korea can be given a lower stock-level concentration cap because of its structurally higher volatility.
The report added that equities across the four markets can now be observed and managed within the same stock-account system on Gate TradFi, reducing one layer of cross-platform capital fragmentation during rebalancing. Even so, market holidays, order status and corporate actions still need to be handled separately by market. For long-term allocation, the report said unleveraged stocks should come first, while CFDs and perpetual products are better suited to short-term hedging and tactical positions.
Overall, the report said the data point to a clear pattern: the U.S. market delivered the highest risk-adjusted returns in the sample period, and cross-market diversification came with an opportunity cost. Asia's contribution was concentrated in cyclical elasticity, valuation repair and shifts in market leadership. Trend rules can reduce the drag from holding weak markets for too long, but they also bring higher turnover and the risk of missing rebounds. Portfolio construction, the report said, should begin with a clear definition of acceptable risk types and use transparent rules to control exposure. Short-term rankings can inform market conditions, but they should not become the only reason for frequent rebalancing.
References and risk disclosure
- Gate: https://www.gate.com/tradfi
- IMF: https://www.elibrary.imf.org/display/book/9798229047999/CH001.xml
- HKEX: https://www.hkex.com.hk/Market-Data/Statistics/Consolidated-Reports/Annual-Market-Statistics/2025-Annual-Market-Statistics?sc_lang=en
The article notes that Gate Research is a blockchain and cryptocurrency research platform that provides technical analysis, market reviews, industry research, trend forecasts and macro policy analysis. Its risk disclosure says cryptocurrency investing involves high risk and that users should conduct independent research and fully understand the nature of the assets and products they buy before making investment decisions. Gate does not accept liability for losses or damages arising from such decisions.