
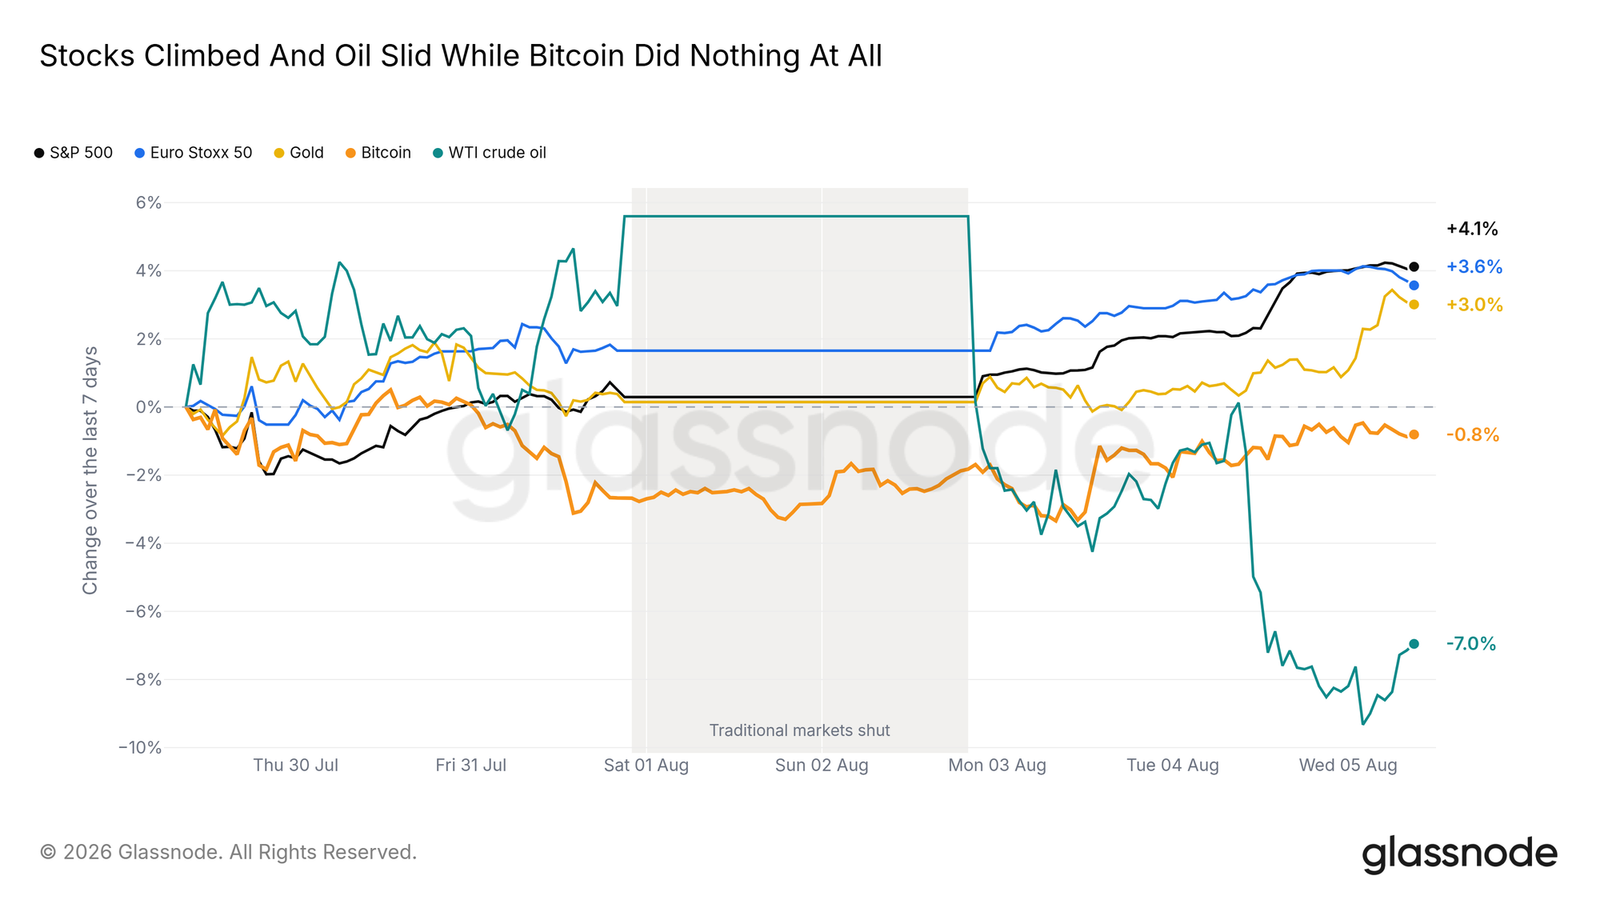
Bitcoin barely moved during a week when stocks hit records, gold rose, and oil opened sharply lower after supply-risk premiums were erased, according to Glassnode’s latest market report.
The firm frames that stillness as the core story: a market that absorbed a theft, registered bottom-like signals through boredom rather than capitulation, and showed an options surface pricing very little movement while sentiment remained jumpy on small swings.
Bitcoin was the one major asset that did not move
Glassnode said the contrast was obvious when major markets were plotted on the same baseline. Two major equity indexes set fresh highs, gold moved up with them, and oil repriced lower as geopolitical tension eased. Bitcoin, the only asset in the set that trades through the weekend, was left slightly below where the prior report had ended and underperformed the S&P 500 by more than four percentage points.
That gap sets up the report’s main question: why did nearly everything else move while BTC stayed still?
Markets quickly reversed their post-FOMC fear
The report ties the equity move to the Federal Open Market Committee decision on July 29. The Federal Reserve left rates unchanged, and the market’s first response was to sell. The S&P closed at its lowest level of the summer, and equity fear briefly peaked.
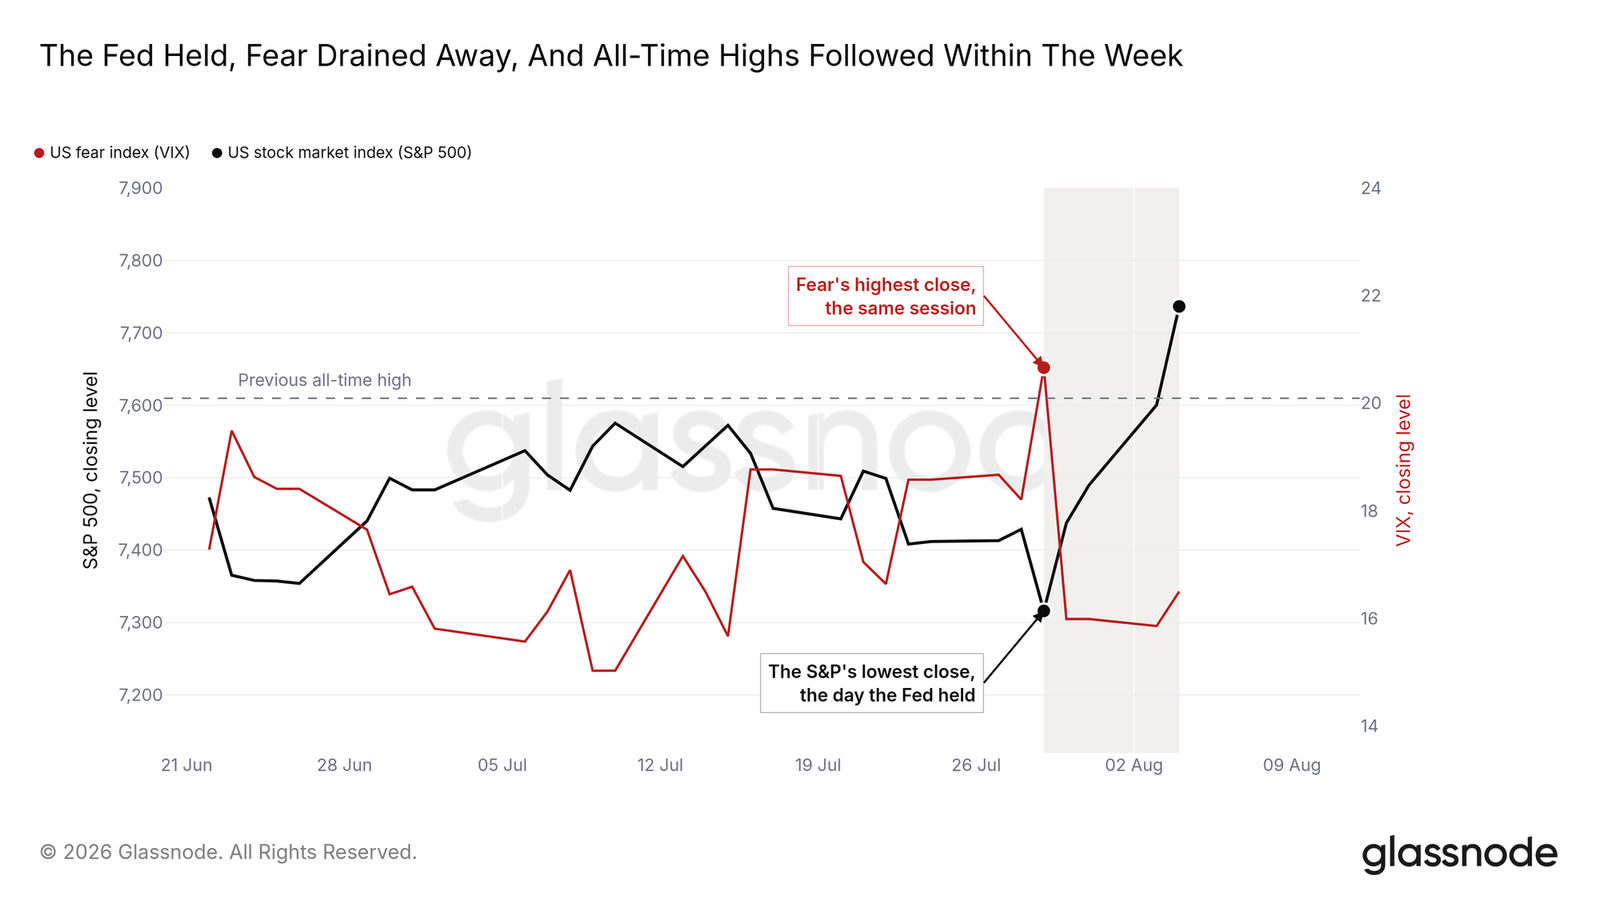
That reassessment took only one trading day. Glassnode said the speed of the fade in fear ranked with only 10 other instances since 2009. Four days after the decision, the index closed at 7,737, breaking the record highs seen since June. On the same day, the Euro Stoxx 50 also set a record. In Glassnode’s telling, markets first sold “patience,” then spent four days deciding that patience was actually good news.
Forward-looking data improved, but Bitcoin did not reprice
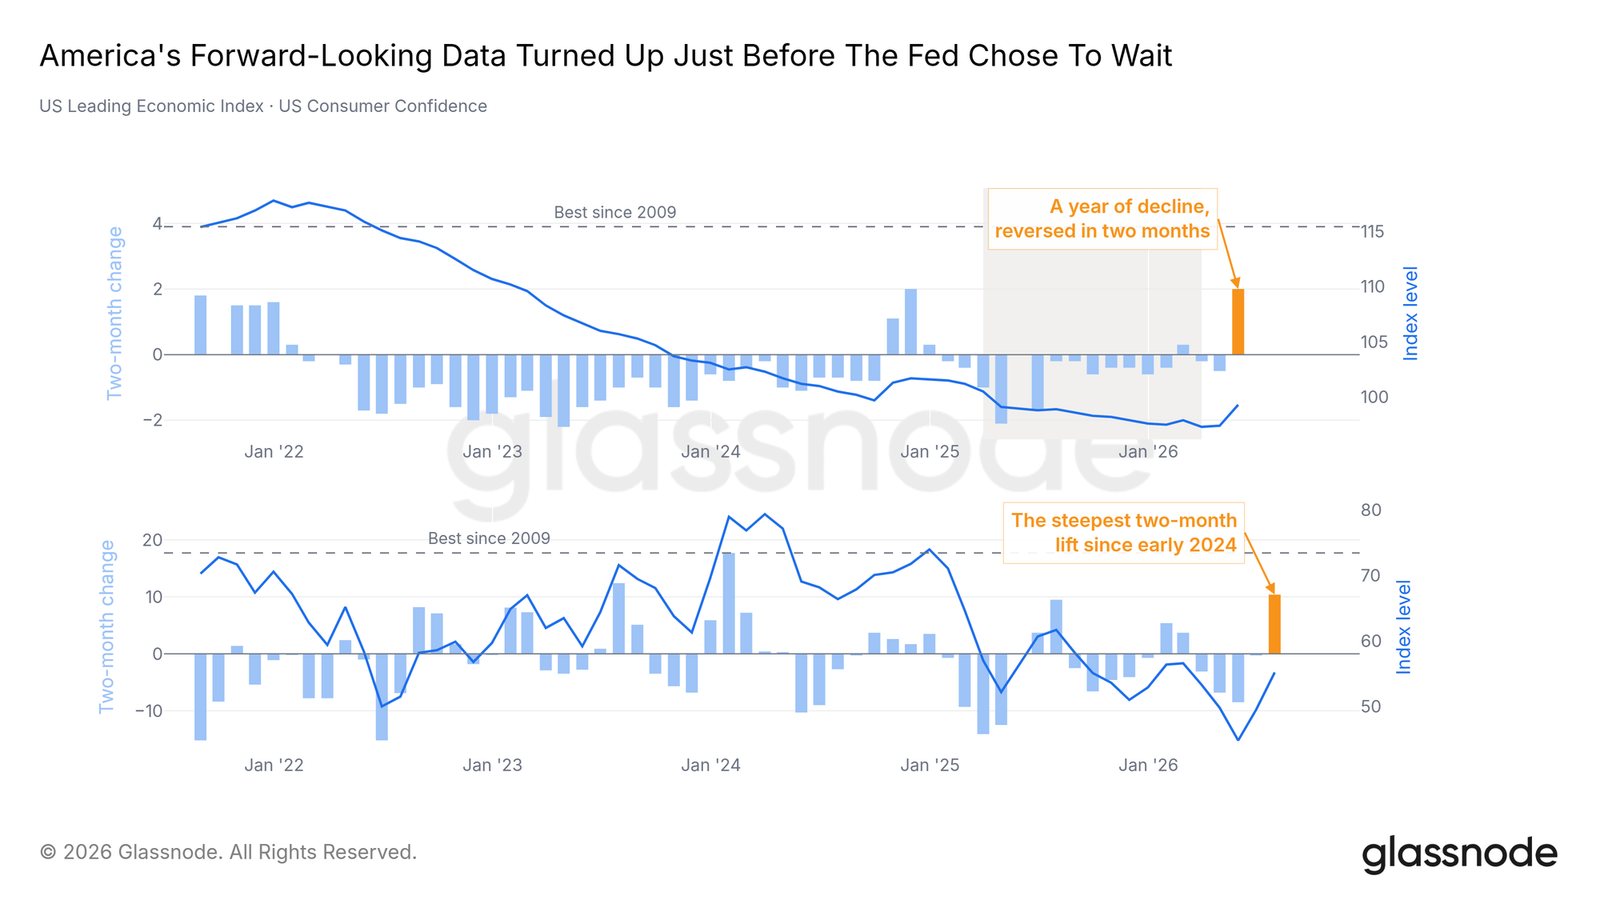
Glassnode said the positive read-through from the Fed decision was possible because underlying data had turned. The leading economic index reversed a year-long decline within two months, while consumer confidence logged its steepest two-month increase since early 2024.
With the central bank standing still and forward indicators improving, the risk of additional tightening was effectively removed, leaving growth expectations to do the work. Equities priced that change. Bitcoin did not.
A 25-minute theft became a live stress test
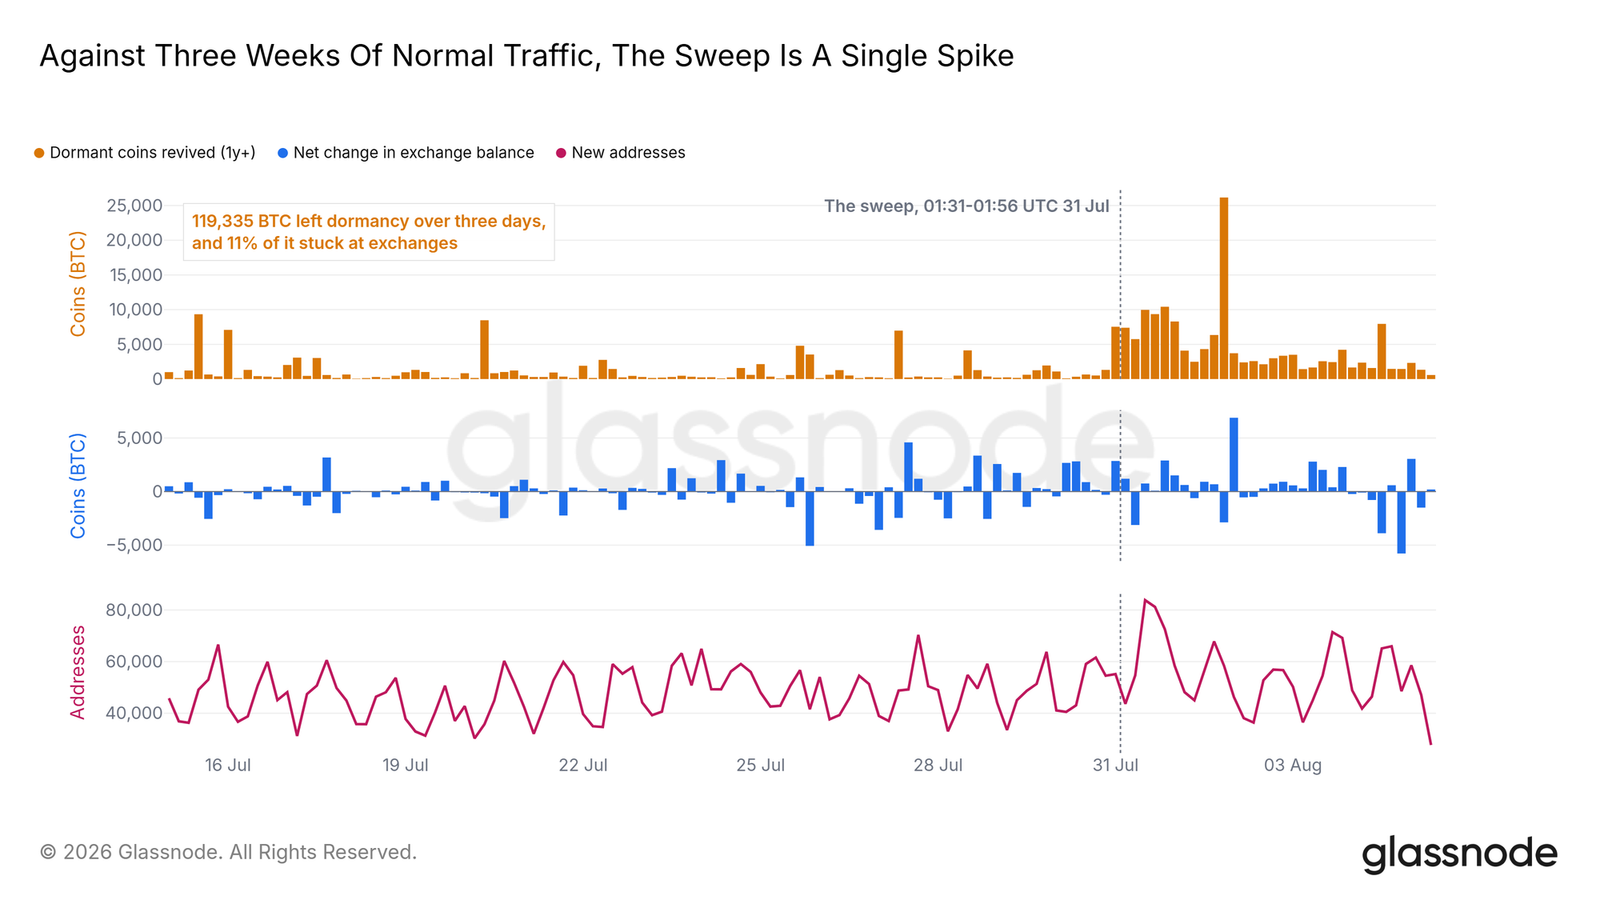
In the early hours of Friday, July 31, the market went through what Glassnode called an unnamed stress test. Over 25 minutes, attackers exploited a five-year-old key-generation flaw in Coldcard hardware wallets and stole about 594 BTC, worth roughly $38 million, from around 500 self-custodied wallets.
The theft was over almost as soon as it began. The on-chain response lasted for days and produced what Glassnode described as one of the clearest natural experiments in holder behavior seen in this cycle.
Supply last active more than one year ago jumped to about 119,000 BTC over the following three days, roughly 200 times the amount stolen. Across the ecosystem, holders moved coins out of seeds that may have been compromised. Compared with normal traffic over the previous three weeks, the move was an isolated spike.
Only about one-tenth of that flow ultimately reached exchanges. New-address creation returned to baseline within three days, and supply held by wallets younger than one month rose 40% afterward and was still climbing. Glassnode said that pattern points to migration into new cold wallets rather than liquidation.
Spot markets barely registered the event
Glassnode stressed that the biggest forced movement of old coins in this cycle did not produce measurable selling pressure or a recognizable price reaction. Spot markets were nearly indifferent.
In the firm’s view, a market that can watch a core self-custody cohort get robbed and still show little reaction is a market with neither active buyers nor active sellers. That is the state later cycle indicators also describe.
Bottom conditions are appearing without a liquidation flush
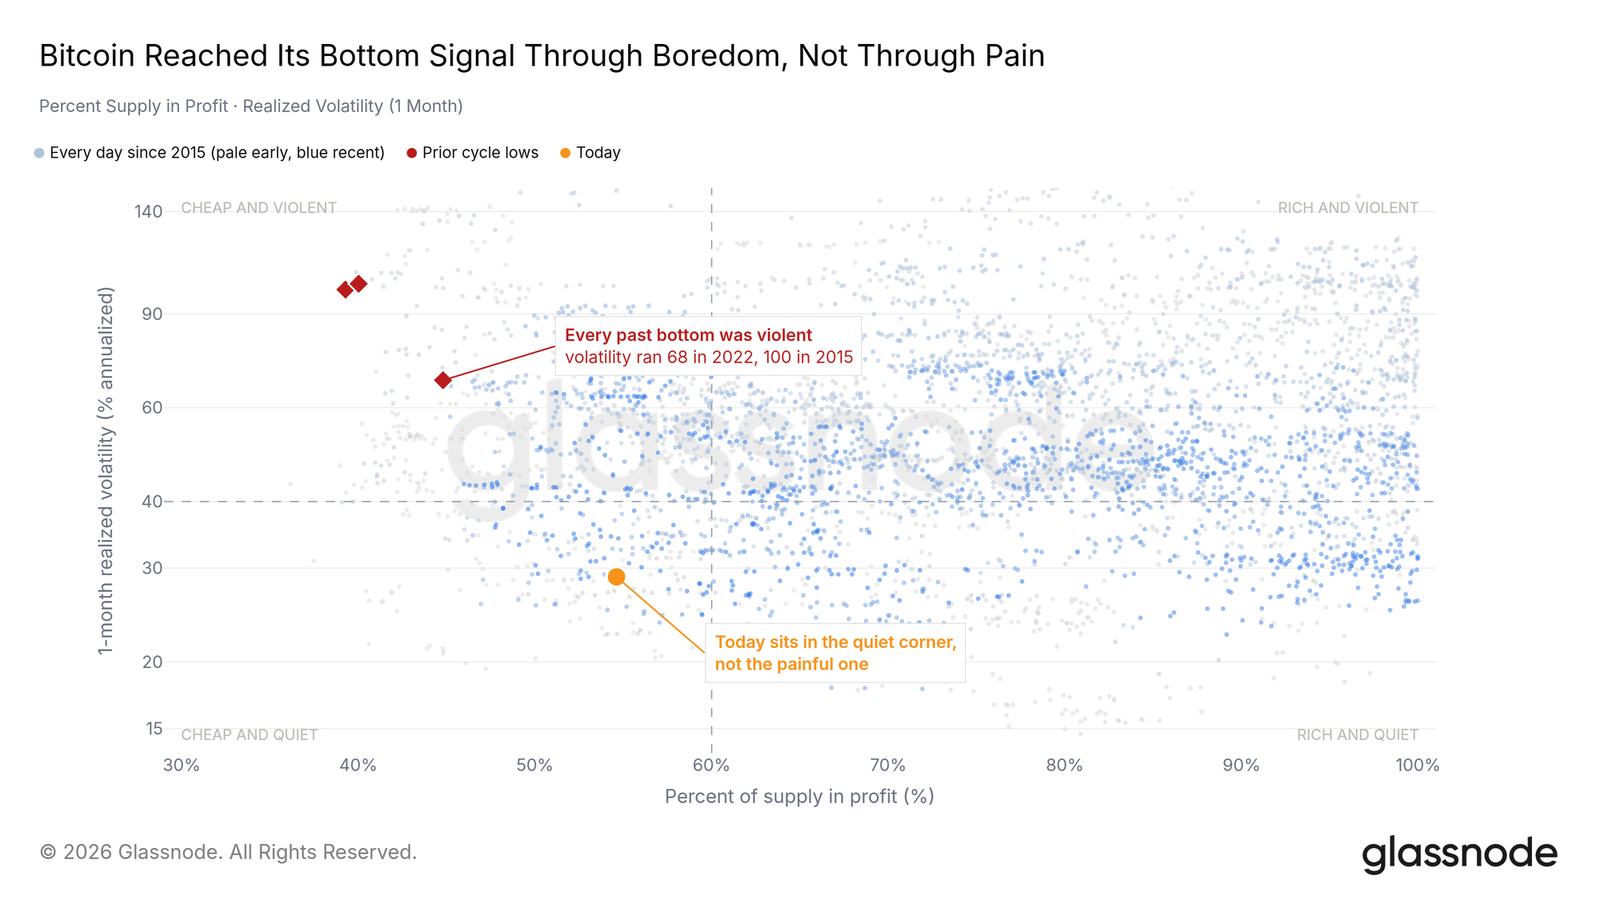
Bitcoin bottoms have usually arrived through pain. In earlier cycles, capitulation crushed the share of supply in profit while realized volatility exploded. This time, Glassnode said, the same region is being approached through boredom. Profit compression is already in place, but it was produced by months of slow decline and arrived with volatility near the floor, not the ceiling.
The destination looks familiar. The path does not.
Seller exhaustion is near the door, not yet in the room
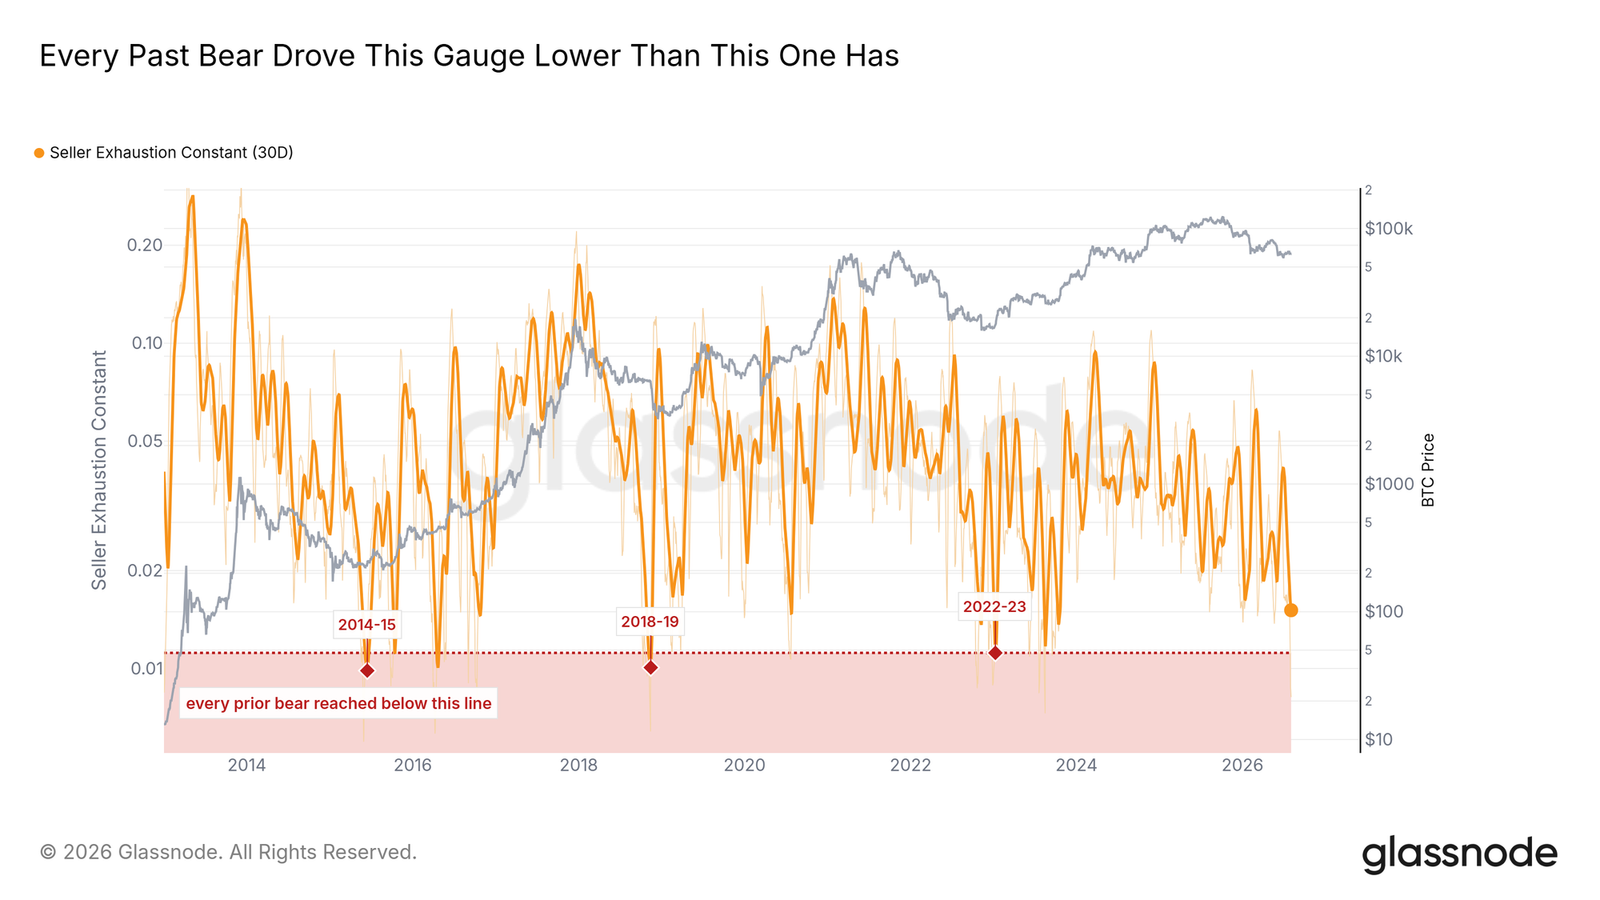
Glassnode uses its seller exhaustion constant, defined as the share of supply in profit multiplied by realized volatility, to make that point more clearly. The 30-day average is now at the cycle low and has entered the zone associated with every prior bottom-building phase.
It still remains about one-third above the floor ultimately reached in earlier bear markets. Glassnode’s conclusion is direct: the indicator is standing at the door, but it has not yet entered the room. If past cycles are the template, the final leg down may still be missing.
The institutional demand tracks are still running in reverse
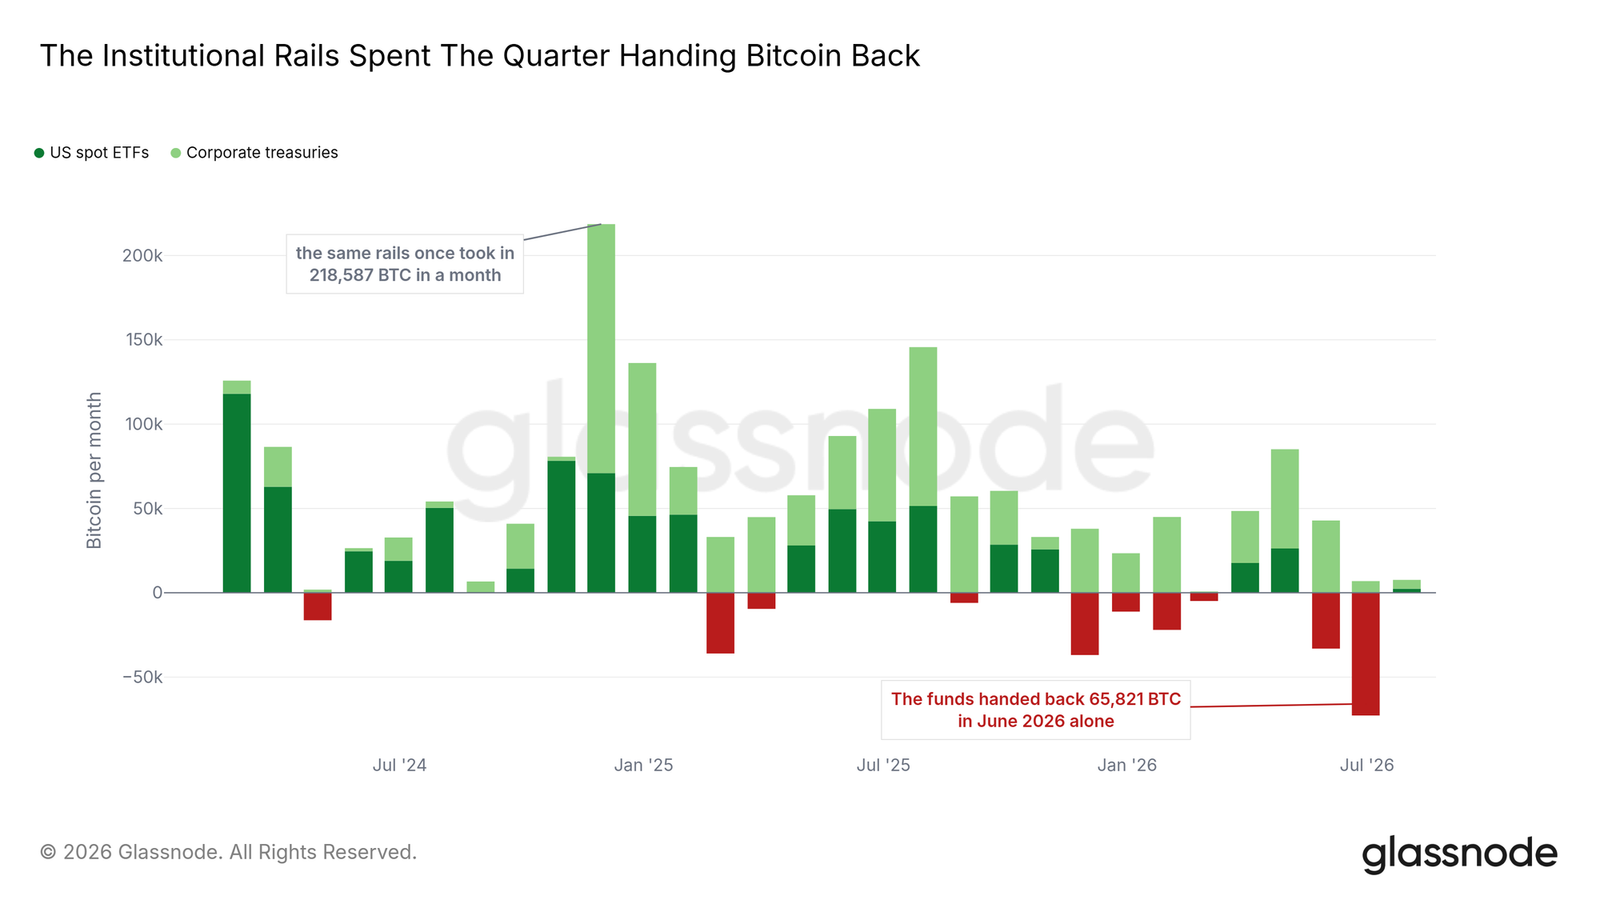
Demand data tell a similar story. Glassnode said the institutional rails that drove the last bull market, namely US spot ETFs and corporate treasuries, have spent the past quarter giving coins back.
Funds posted net outflows of about 65,800 BTC in June alone, the worst month on record. By contrast, the strongest month at the end of 2024 saw net absorption above 218,000 BTC. Corporate treasury buying continues, but not at a scale large enough to offset fund outflows.
However this bottom forms, Glassnode said, it will have to form without the structural bid that defined the last two years unless those flows turn again.
Market conditions have shifted from risk-off to defensive
Glassnode’s market compass shows the composite indicator moving into a defensive zone after spending nearly three weeks pinned in risk-off territory. The inputs are broadly aligned.
Defensive, in this framework, means deterioration has stopped but momentum has not arrived. Half the bottom checklist is complete. The missing half, the report said, is waiting on the same absent ingredient: a forced event.
No one is paying much for direction in options
In options, Glassnode sees a different kind of imbalance. Implied volatility on the upside wing has printed near the lowest level in the history of the measure, close to 23%. Downside implied volatility looks far more ordinary, with the last cheaper reading dating back to August 2023.
The asymmetry does not reflect an aggressive bid for puts. Instead, it shows demand for calls has disappeared. The market is not paying up for upside, and it is not paying much for downside either.
Short-dated sentiment keeps flipping anyway
Even with muted directional pricing, sentiment is not sitting still. Glassnode’s fastest positioning gauge, the one-week 25-delta skew, dropped more than eight points in a single day this week while spot was almost unchanged. A similar vacuum opened around the July high two weeks earlier and was filled again within four days.
Short-term fear keeps getting repriced on moves of only a few percentage points, while the volatility level being priced stays pressed to the floor. Most of that whipsaw is happening in options. Perpetual funding rates remain pinned near their long-run norm, which suggests leverage is not the amplifier here. Sentiment is. The market bought one week of calm and kept paying a premium for six months of risk.
History favors an upside release from deep compression
Glassnode said history has a clear tendency when one-month realized volatility is compressed to similar depths. The release has almost always resolved upward, making that statistic the report’s most constructive data point.
There is a condition attached. In past episodes, most compressions formed while the demand engine was at least idling in the background. This time, the institutional rails are still moving in reverse, and the final washout may not be complete.
“Priced for zero, overreactive” is not stable
Glassnode summed up the current regime as a compressed, under-positioned market that has been left behind by improving global risk appetite. Bottom conditions are assembling, but they are not complete.
The firm said a return to sustained net inflows on the ETF rail or an upward expansion in volatility out of the current squeeze would confirm improvement. If the seller exhaustion constant is pushed into the zone reached at the final lows of earlier bear markets, that would mark completion of the classic bottom template.
Its closing line was blunt: “Priced for zero, overreactive” is not a stable state.