

Gold is under heavy short-term pressure after a record burst of speculative buying entered the market only weeks ago. The chart setup has weakened quickly, and a large amount of newly built long exposure now sits above spot prices, leaving traders focused on how much downside could be amplified if those positions unwind in a rush.
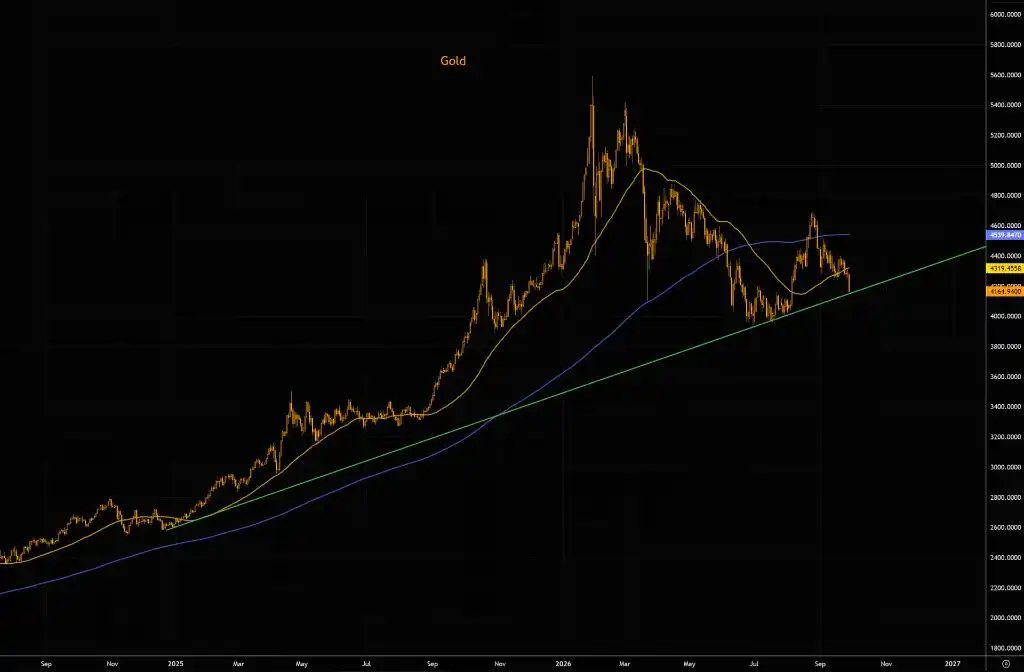
Technical support is being tested, with $4,000 in focus
Data from LSEG Workspace show that gold has already moved below its 200-day moving average and is now breaking under its 50-day moving average while directly testing the main trendline that has supported the bull run since 2025.
Analysts cited in the report said that if gold closes below that trendline, it would signal a meaningful deterioration in the technical picture. In that case, $4,000 becomes the next support level to watch closely. If that level fails, $3,887 would be the next line of defense, followed by the $3,500 area previously marked by the World Gold Council.
According to information from Goldman Sachs' trading desk, sovereign and institutional buyers have placed bids around $4,000, offering some support near that level. Whether that support can hold remains unclear.
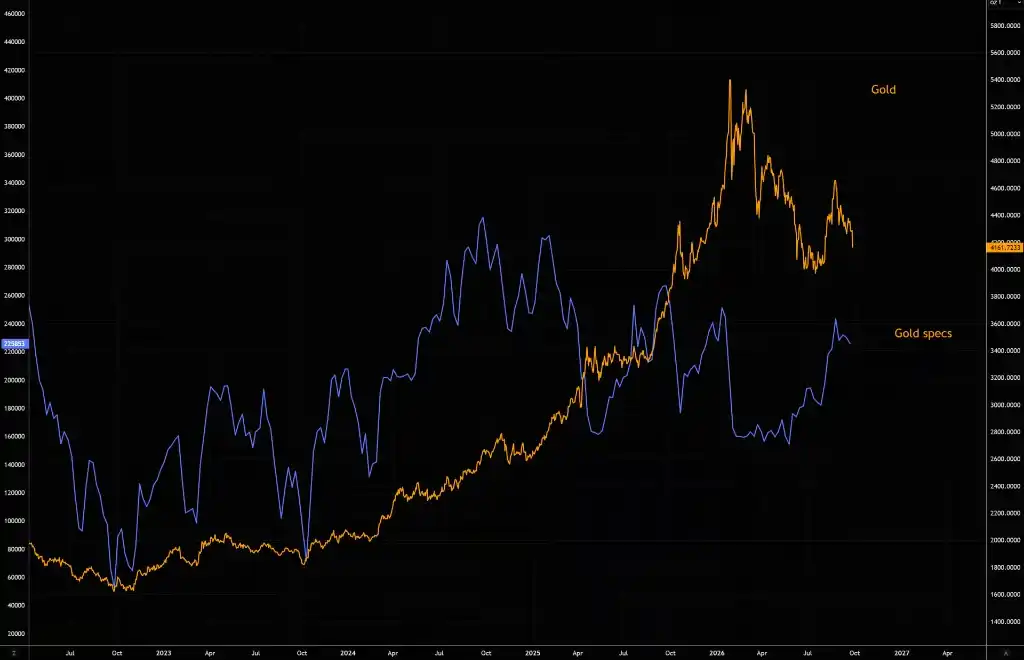
Record speculative buying has left a large overhang
One of the market's main concerns is the speed and scale of long-position accumulation, both of which the report describes as historically rare.
COT positioning data show that when gold started to pull back about a month ago, speculators bought a record notional amount of gold futures over a three-week period. The buying was not concentrated in a single group. It was broad-based across speculative categories.
That leaves a large number of long positions with entry prices above the current market level. As long as prices rise, that is manageable. Once the trend turns lower, those positions can become fuel for a faster decline. The key question now is how quickly those longs decide to exit.
China positioning and the holiday calendar add to the risk
Signals from China are also drawing attention. Goldman Sachs' gold trading desk said that during the day's session on the Shanghai Futures Exchange, long positions were closed out at the open, with open interest falling by about 11,000 contracts, or roughly 2.6%.
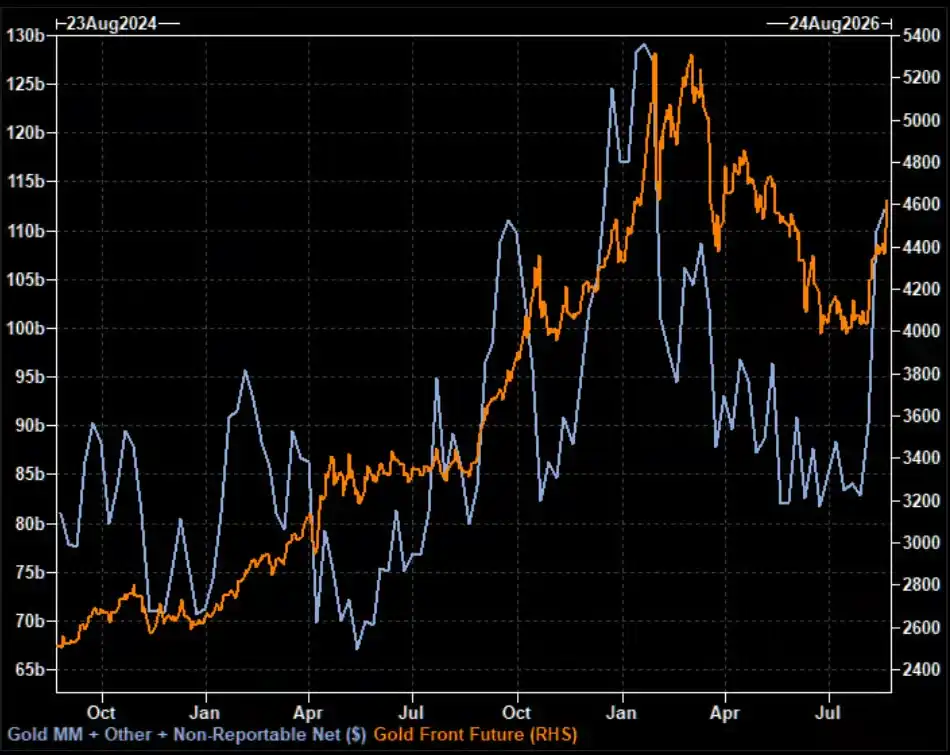
Goldman said nominal SHFE positioning may overstate the true size of speculative longs because of large EFP arbitrage positions between domestic SGE longs and SHFE shorts. Even so, Chinese speculators as a whole remain net long.
The calendar matters as well. The Shanghai Futures Exchange will be closed for the National Day holiday from Oct. 1 to Oct. 7. With both the Iran situation and interest rates in flux, speculators have little incentive to carry large long exposure through a full week of market closure. The report said the market expects pre-holiday position reduction pressure to continue.
Higher real yields and a stronger dollar are weighing on gold
The macro backdrop is also turning less supportive. LSEG Workspace data show that front-end real yields have climbed sharply in recent weeks, with the 2-year real yield rising back to its highest level in more than two years. The increase in inflation expectations has not been large enough to offset that move.
Goldman Sachs analyst Privorotsky said this is a very unfavorable environment for a non-yielding asset. Gold can hedge inflation, fiscal stress, and geopolitical risk, but once cash instruments begin offering meaningful positive real returns, the opportunity cost of holding gold starts to erode its appeal.
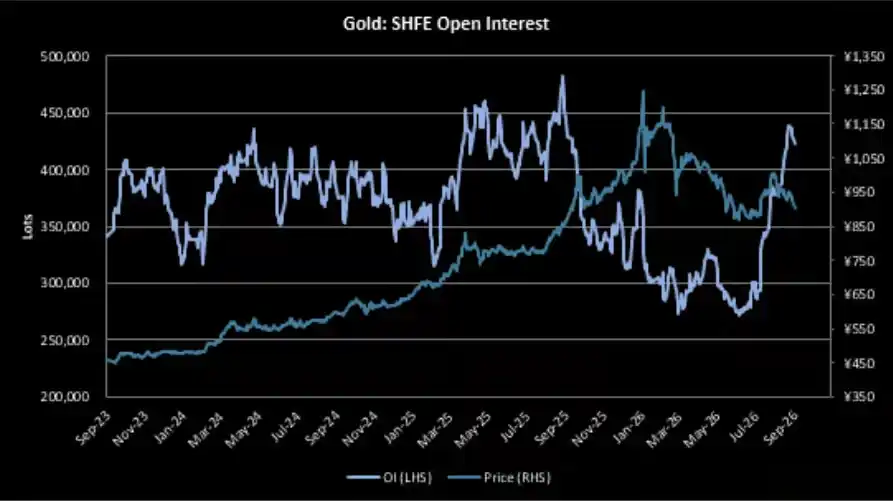
At the same time, the negative correlation between gold and the U.S. dollar has remained highly stable over nearly the past year. That means trading gold is, to a significant extent, also a trade on the dollar. A stronger dollar has added another cap on rebound attempts.
Options signals are mixed as implied volatility keeps falling
The options market is sending a more divided message. Gold usually trades with an upside volatility skew, with call demand historically stronger than put demand. Goldman data show that call demand is still relatively firm, yet implied volatility in gold has continued to move lower.
That divergence suggests the options market is not fully pricing in a sharp upside move in gold, and expectations for a rapid rebound in the near term remain limited.
The structural bull case remains, but marginal buyers are stepping back
The Market Ear said the structural long case for gold may still be intact, but the near-term trading setup is becoming "quite ugly."
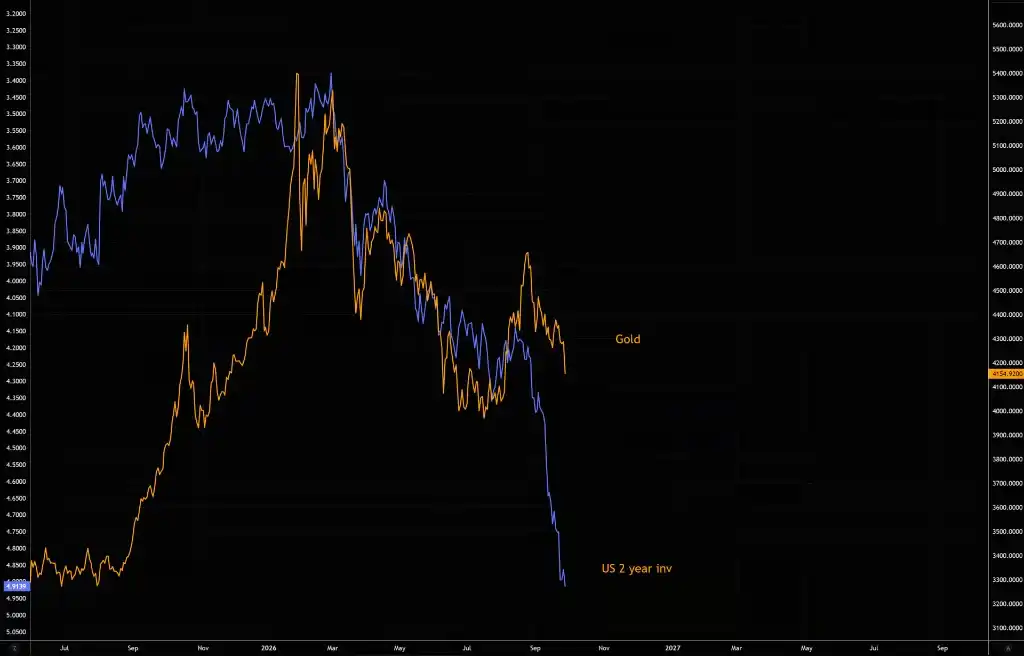
Longer term, the report said gold's structural support has not been broken. Central banks are still adding to gold holdings, with average monthly purchases running at about 91 tons, around five times the level seen before 2022. Safe-haven demand tied to long-term fiscal sustainability concerns also remains in place.
In the short run, though, the problem is that marginal buyers are pulling back. The realization of hawkish rate-hike expectations is weakening the macro policy-hedge logic that had supported gold prices, while higher real yields are also hitting ETF investors who are more sensitive to rates. Global outflows from gold ETFs are accelerating.
For now, price action is being driven less by the long-term structural story and more by short-term speculators looking for the exit.